Climate Science Glossary

Term Lookup

Enter a term in the search box to find its definition.

Settings

Use the controls in the far right panel to increase or decrease the number of terms automatically displayed (or to completely turn that feature off).

Term Lookup

Settings


All IPCC definitions taken from Climate Change 2007: The Physical Science Basis. Working Group I Contribution to the Fourth Assessment Report of the Intergovernmental Panel on Climate Change, Annex I, Glossary, pp. 941-954. Cambridge University Press.

Home Arguments Software Resources Comments The Consensus Project Translations About Support

Bluesky Facebook LinkedIn Mastodon MeWe

Twitter YouTube RSS Posts RSS Comments Email Subscribe


Climate's changed before
It's the sun
It's not bad
There is no consensus
It's cooling
Models are unreliable
Temp record is unreliable
Animals and plants can adapt
It hasn't warmed since 1998
Antarctica is gaining ice
View All Arguments...


Username
Password
New? Register here
Forgot your password?

Latest Posts

Archives

The Medieval Warm(ish) Period In Pictures

Posted on 10 July 2011 by Rob Painting

The Medieval Warm Period (MWP) is a subject of "skeptic" focus, primarily because it was a time of natural warming. It took place from about 950-1250 AD, and, as opposed to today's warming which is global in extent and due to human activities, the MWP was mainly a northern hemisphere phenomenon and smaller in scale. Indeed, the advance of North American glaciers during the MWP is in stark contrast to what is happening in North America today. 

The MWP in global maps 

Mann (2009) was an analysis of a large set of climate/temperature proxies (ice cores, tree rings, cave mineral deposits, sediments, etc.) covering the MWP. See below:
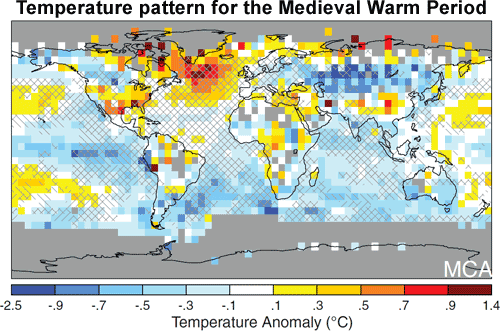
Figure 1: Reconstructed surface temperature anomaly for Medieval Warm Period (950 to 1250 A.D.), relative to the 1961–1990 reference period. Gray areas indicate regions where adequate temperature data are unavailable.

It's clear from the map that only limited areas of the world were warmer during the MWP than the 1961–1990 reference period, Greenland in particular.  Much of the rest of the planet, especially the oceans, were cooler. And take note of the cooler North American west coast, which is consistent with the glacier advance there during the MWP. Obviously, the Earth has continued to warm even further since the 1961–1990 period, so the difference in temperature between the MWP shown in the reconstruction and today is even greater.

Climate Models and the MWP

The climate proxies suggest a rather different distrubition of heat and rainfall than today. So the question arises: based on the current well-understood climate system, can ocean-atmosphere processes produce temperature patterns like the MWP? For answers we turn to climate models.

The cool central and eastern Pacific suggested by Mann 2009 explain some of planet-wide climate features observed in the MWP, but they fail to explain other aspects, such as as a more positive North Atlantic Oscillation (NAO), and increased rainfall in parts of Asia.

Graham (2010) used the NCAR climate model and, based on findings from other modelling studies and proxy evidence for a warmer Western Pacific Ocean, found that by forcing the simulation to have a slightly warmer Indian and Western Pacific Ocean relative to other ocean basins, the model results match the climate suggested by the proxies.

Below are the comparisons between the climate model control runs (a pre-industrial baseline) and the simulations including a warmer Indian-Western Pacific Ocean, for the northern hemisphere (boreal) winter (figure 2 and 3)
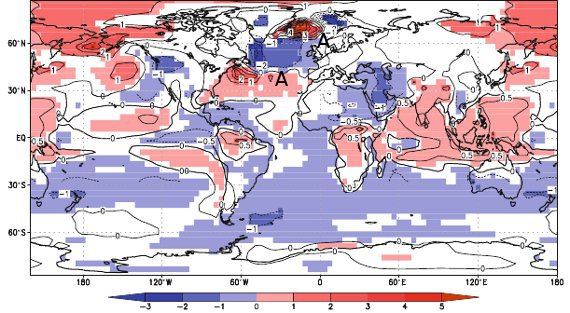
Figure 2: Differences in December–March temperature between the Indian Ocean Warm Pool (25) and control simulations (°C, color; values are Sea surface temperature over ocean and 2-m temperature over land).Lined contour interval is 0.5°C between 30°N and 30°S and 1°C elsewhere. From Graham 2010.
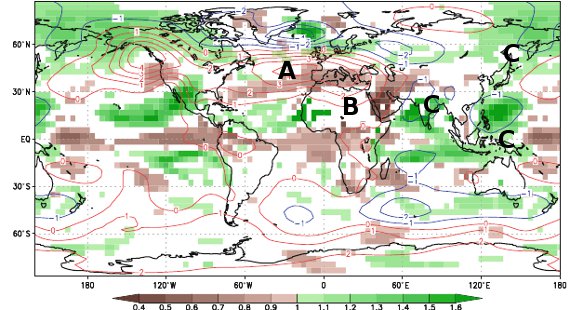
Figure 3: Differences in December–March precipitation (expressed as fraction of Control simulation, color) and Sea level Pressure (difference, hPa) for the Indian Ocean Warm Pool simulation. SLP contour interval is 1.0 hPa except 0.25 hPa in the region 30°S–40°N and 25°E–100°E where the ?ner interval highlights temperature-driven low pressure around continental periphery of northern Indian Ocean. From Graham 2010.

The warm Indian-Western Pacific Ocean, combined with the cool Central and Eastern tropical Pacific reveals a good match with the paleoclimate proxies shown in the Mann 2009 reconstruction, namely:

  • The NAO becomes more positive (A in figure 2 and 3), matching proxies of Atlantic sea surface temperature and sea ice distribution. This due to an atmospheric teleconnection (two connected atmospheric processes separated by large distances) between the NAO and warming over the Indian Ocean.
  • Seasonal dryness in northeast Africa (B in Figure 3 ) 
  • And wetter conditions in India, Southeast Asia and China(C in figure 3)

A mechanism for such warming of the Indian and western Pacific Oceans has not been found, nor do the climate model simulations resolve all the patterns suggested by the proxies (such as warming of the British Isles); however, these findings represent another small step forward in piecing together the puzzle of the MWP, and also support the interpretation of the proxy data in Mann 2009.

Science marches on while skeptics don't

The MWP was very unlike warming today; the growing North American glaciers during the MWP being somewhat of a giveaway. The MWP only affected warming in a handful of regions, with Greenland being especially warm (Figure 1), whereas much of the Earth was actually cooler than the late 20th century.  By comparison; today virtually every glacier and ice sheet on the planet is in rapid retreat.

Both the climate proxies and the climate models imply that the MWP was a re-organization of the Earth's climate, and that much of this re-organization can be explained by oceanic patterns of warming and cooling, although what started all this rolling in the first place is still unknown.

So while some climate "skeptics" are stuck in a time loop, wilfully reliving their own version of Groundhog Day, science continues to move forward.

0 0

Printable Version  |  Link to this page

Comments

Prev  1  2  

Comments 51 to 64 out of 64:

  1. Sea level is a bit trickier to ascertain as local levels may change much more dramatically than global levels, with causes unrelated to global changes. However, here are a few examples regarding to sea level during the MWP: http://people.rses.anu.edu.au/lambeck_k/pdf/237.pdf http://www.sciencemag.org/content/150/3700/1165.abstract
    0 0
  2. Eric, from your first reference: The preservation of Neolithic leather indicates permanent ice cover at that site from ca. 4900 cal. yr BP until AD 2003, implying that the ice cover was smaller in 2003 than at any time during the last 5000 years. For second, can you point me to where you see evidence that glacial retreat in MCA was further than today? And surely you are not falling for Easterbrook trick ("0" in the ice core is 1905" As for sealevel - to make a comparison, you have to apply GIA adjustments.
    0 0
  3. DB@48: I am not inferring a global event from the Sargasso Sea. I was just pointing out that proxy data from a number of papers it seems, does not agree with the reanalysis presented by Dr. Mann. I agree with the area of the Sargasso Sea as presented in this Wikki link. http://en.wikipedia.org/wiki/Sargasso_Sea
    0 0
    Response:

    [DB] I believe you pointed out one paper, which itself has "issues".

  4. To reinforce Phil Scadden's point about global sea level during the MWP, as compared to the present:
    0 0
  5. So Camburn, when you are sorting through proxy data sets what methodology would you use to identify outliers? (from memory, Mann's is described in the supplementary info.)
    0 0
  6. Mr. Mann used proxy data that he deemed relevant. From that data he then used re-amalysis to obtain what he thinks the temp patterns were during the MWP. The Sargasso Sea proxy data appears to show his re-amalysis has a flaw in it. I do not know what his error bars were. DB: I have not seen any rebuttals to the Sargasso Sea temperature proxies. I have seen supporting papers as the thermocline, currents etc seem to make this an excellent source of temp data. If you have any, I am open to reading them.
    0 0
  7. scaddenp: What would I use to identify outliers? Something that is out of the norm, I would want to examine the method of determing it as a suitable proxy. If the method of determination falls within accepted science and has been consistent, that would cause me to examine the other proxies to see why the variablility. It could very well be the other proxies are wrong and the outlier is correct.
    0 0
  8. Then perhaps you should rerun Mann's analysis and see if come up with a different result. (A good basis for a publication).
    0 0
  9. That would be up to Mr. Mann to rerun his analysis with the proxy data included.
    0 0
  10. Scaddenp, Are you satisfied now that glaciers did recede during the MWP? Your posts seem to indicate that.
    0 0
    Response:

    [DB] Some glaciers retreated, some advanced at the same time.  Not a "silver bullet" marker to hang one's positional hat on.

  11. True, But some glaciers are advancing today also, but I would not conclude that the world is cooling. There is enough glacial evidence to support the assertion that the planet warmed during the MWP.
    0 0
    Response:

    [DB] It is not a question of "some". The majority of the world's glaciers today are embarked on a decades-long retreat:

    Decadal Trend

    Reference Series

    [Source]

    There is enough glacial evidence to support the assertion that the planet periodically cooled or did not warm uniformly during the MWP.

    Again, not a metric to rely upon to prosecute your narrative.

  12. Eric, I did not doubt for a moment that glacier would retreat when it was warm. I also noted that the warming not synchronous across the planet like warming is today. What I was countering in the post, was the idea that MCA was globally warmer. Most glaciers have retreated further than did in medieval times and sealevel is higher.
    0 0
  13. Camburn#56: "I have not seen any rebuttals to the Sargasso Sea temperature proxies." Perhaps not. However, here is an excellent rebuttal to the numerous misrepresentations of Keigwin's Sargasso Sea data that continue to rebound throughout deniersville. Keigwin’s Fig. 4B (K4B) shows a 50-year-averaged time series along with four decades of SST measurements from Station S near Bermuda, demonstrating that the Sargasso Sea is now at its warmest in more than 400 years, and well above the most recent box-core temperature. Taken together, Station S and paleo-temperatures suggest there was an acceleration of warming in the 20th century, though this was not an explicit conclusion of the paper. Keigwin concluded that anthropogenic warming may be superposed on a natural warming trend. ... Keigwin’s Fig. 2 showed that δ18O has increased over the past 6000 years, so SSTs calculated from those data would have a long term decrease. Thus, it is inappropriate to compare present-day SST to a long term mean unless the trend is removed. -- emphasis added This analysis, Misrepresentation of Scientific Data by Hillary Olson at UT, is based on a 2010 GSA talk by Boslough and Keigwin. It features a point-by-point demonstration of the manner in which deniers cherry-pick from a legitimate study, modify, distort and misrepresent. It includes a discussion of how internet memes arise and gain traction despite being factually incomplete or incorrect. This particular 'Saragasso Sea was warmer way back when' meme is traced to the folks behind the Oregon Petition. For the benefit of any skeptical educators, Olson includes the relevant sections from the Texas Essential Knowledge and Skills (TEKS): The student uses critical thinking, scientific reasoning, and problem solving to make informed decisions within and outside the classroom. The student is expected to: (A) in all fields of science, analyze, evaluate, and critique scientific explanations by using empirical evidence, logical reasoning, and experimental and observational testing, including examining all sides of scientific evidence of those scientific explanations, so as to encourage critical thinking by the student; (B) communicate and apply scientific information extracted from various sources such as current events, news reports, published journal articles, and marketing materials; (D) evaluate the impact of research on scientific thought, society, and public policy; It is too bad those skills are in such short supply these days.
    0 0
  14. More bad news from the Sargasso Sea: The graph shown in the source cited in #28 (Bluemle), attributed as 'modified' from Keigwin's original work, is really the misrepresentation done by Art Robinson, Sallie Balliunas and Willie Soon (originally published in 1998 by that prestigious climate source, the Journal of American Physicians and Surgeons; apparently they liked it so much they published it again, under the same title, in 2007). The lower panel in this composite is the version in Bluemle; the upper is Robinson. Neither contain all of the data published by Keigwin 1996. This is clear-cut scientific dishonesty, yet the meme lives on. Olson's work is a must-read.
    0 0

Prev  1  2  

You need to be logged in to post a comment. Login via the left margin or if you're new, register here.


The Consensus Project Website

THE ESCALATOR

(free to republish)


© Copyright 2024 John Cook
Home | Translations | About Us | Privacy | Contact Us