Climate Science Glossary

Term Lookup

Enter a term in the search box to find its definition.

Settings

Use the controls in the far right panel to increase or decrease the number of terms automatically displayed (or to completely turn that feature off).

Term Lookup

Settings


All IPCC definitions taken from Climate Change 2007: The Physical Science Basis. Working Group I Contribution to the Fourth Assessment Report of the Intergovernmental Panel on Climate Change, Annex I, Glossary, pp. 941-954. Cambridge University Press.

Home Arguments Software Resources Comments The Consensus Project Translations About Support

Twitter Facebook YouTube Mastodon MeWe

RSS Posts RSS Comments Email Subscribe


Climate's changed before
It's the sun
It's not bad
There is no consensus
It's cooling
Models are unreliable
Temp record is unreliable
Animals and plants can adapt
It hasn't warmed since 1998
Antarctica is gaining ice
View All Arguments...


Username
Password
New? Register here
Forgot your password?

Latest Posts

Archives

Arctic Ice March 2011

Posted on 30 March 2011 by logicman

This is a repost of my Science 2.0 article Arctic_Ice_March_2011_Update_#2, with an introduction, updates and minor edits.

Introduction

The main mass of Arctic sea ice has previously consisted mostly of thick multi-year ice.  In the winter of 2006 - 2007 there was a crossover: first year ice became the majority component.

The Arctic sea ice cap is getting younger.  A population of older ice is being replaced as the older ice is lost and new ice does not linger long enough to get old.  The former dominance of thick multi-year ice together with a gyratory motion caused new ice to enter the main pack and be trapped there for many years. The Transpolar Drift and Beaufort Gyre formerly brought new ice into the main pack and exported old ice - mainly on the Atlantic side through Fram Strait.  The export and import were formerly in broad balance.  They are not balanced now.

Younger and thinner ice now allows a more rapid transit of floes through the pack.  The age of the oldest ice is the length of time during which it was prevented from advecting south by being trapped in the main pack.

It appears that as the ice gets thinner and more mobile, that very mobility is a positive feedback to ice loss.

Arctic Ice March 2011

The melt season of 2010 ended with a low extent and with little ice older than two years. There are strong indications that the winter of 2010 - 2011 did not compact and thicken the sea ice as much as would normally be expected.

Arctic sea ice extent averaged over December 2010 was 12.00 million square kilometers (4.63 million square miles). This is the lowest December ice extent recorded in satellite observations from 1979 to 2010, 270,000 square kilometers (104,000 square miles) below the previous record low of 12.27 million square kilometers (4.74 million square miles) set in 2006 and 1.35 million square kilometers (521,000 square miles) below the 1979 to 2000 average.

... unfrozen areas of the ocean continued to release heat to the atmosphere, and an unusual circulation pattern brought warm air into the Arctic from the south. Although the air temperatures were still below freezing on average, the additional ocean and atmospheric heat slowed ice growth.

http://nsidc.org/arcticseaicenews/2011/010511.html

It appears to me that the 2011 melt season began with weaker, thinner, less consolidated ice than at any time in recorded history.  Where the slabbing and compaction has been least, the newest ice between the older floes is likely to melt soon.

I suggest that by mid-April the sea ice will be in a similar condition to that of late August 2010.  In plain terms, the 2011 melt season will soon continue more or less where the 2010 melt season left off.

To illustrate that last point, this animation compares 25 March 2011 ice extent on Greenland's northeast coast with 25 March, 10 April, and 01 June 2010.
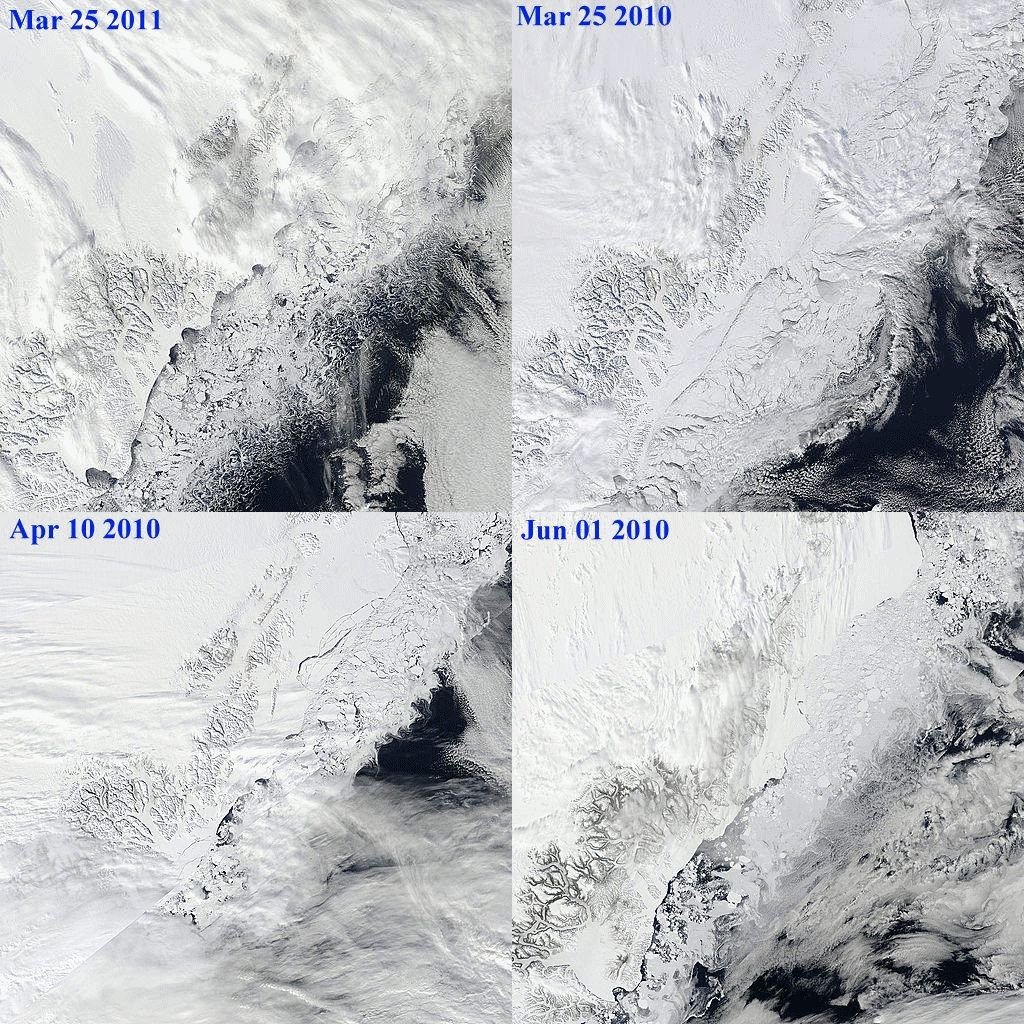
Scoresby animation
Ice extent comparisons - from MODIS Arctic mosaic images.


Melting and re-freezing

Many areas of the Arctic are melting, advecting and re-freezing.  This superimposes local variation noise on signals of ice extent.  I call this 'the Arctic ice jitters'.

Sea ice extent in February and March tends to be quite variable, because ice near the edge is thin and often quite dispersed. The thin ice is highly sensitive to weather, moving or melting quickly in response to changing winds and temperatures, and it often oscillates near the maximum extent for several days or weeks, as it has done this year.
Source: NSIDC report March 23, 2011

The following images show the ice jitter effect in an Arctic mosaic segment which includes Kara Strait.
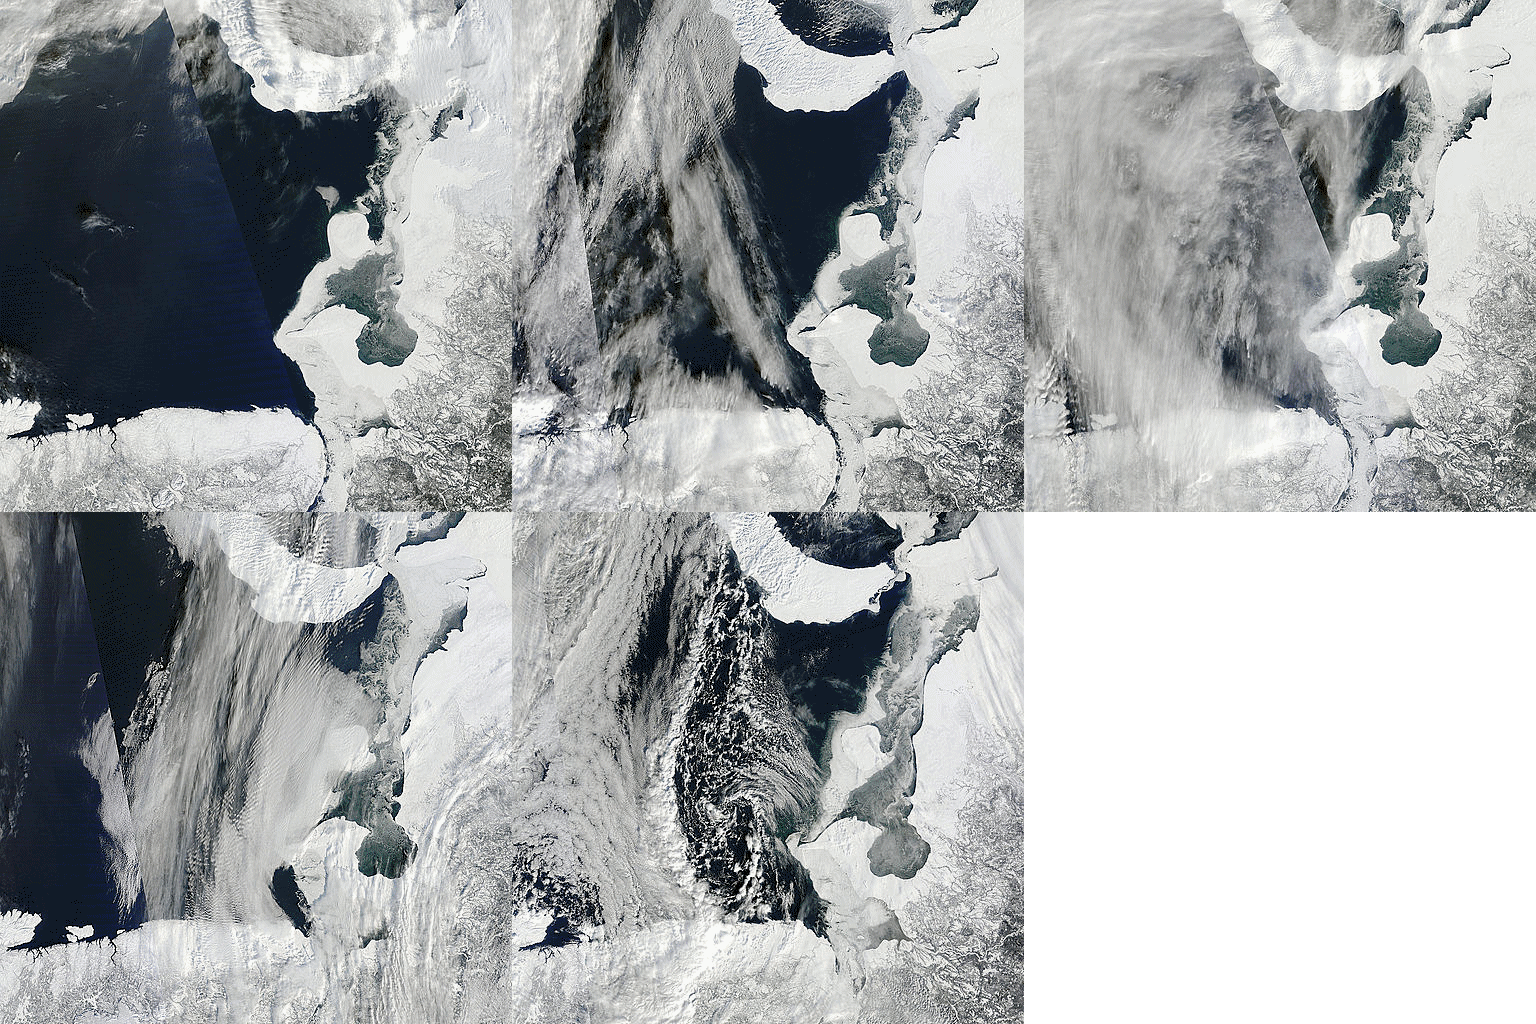

Kara Strait ice jitter
Kara Strait - ice extent jitters

Note that this sea ice will appear in extent numbers but will have no impact whatsoever on the mass of ice in the main polar sea-ice cap.


The tale of the tape

The unusual behaviour of Arctic ice this year is shown at a glance by the Cryosphere Today's 'tale of the tape':  the 2011 portion of the graph could not have been predicted from previous data.  The 2011 plot of anomalies is itself anomalous.
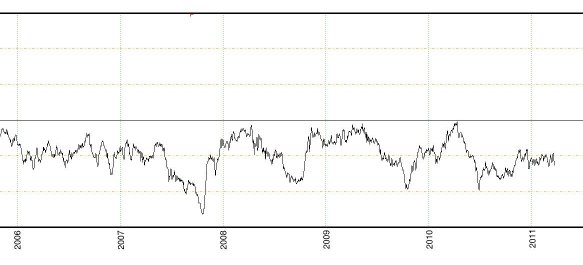
tape tail


The graph as a whole shows a clear negative anomaly trend since 1979.
tale of the tape
The latest update of the full sized 'tale of the tape' can be seen at http://arctic.atmos.uiuc.edu/cryosphere/

The animation below of the sea ice concentration chart from Cryosphere Today shows changes in ice distribution from 31 December 2010 to 22 March 2011 in 5 day steps.
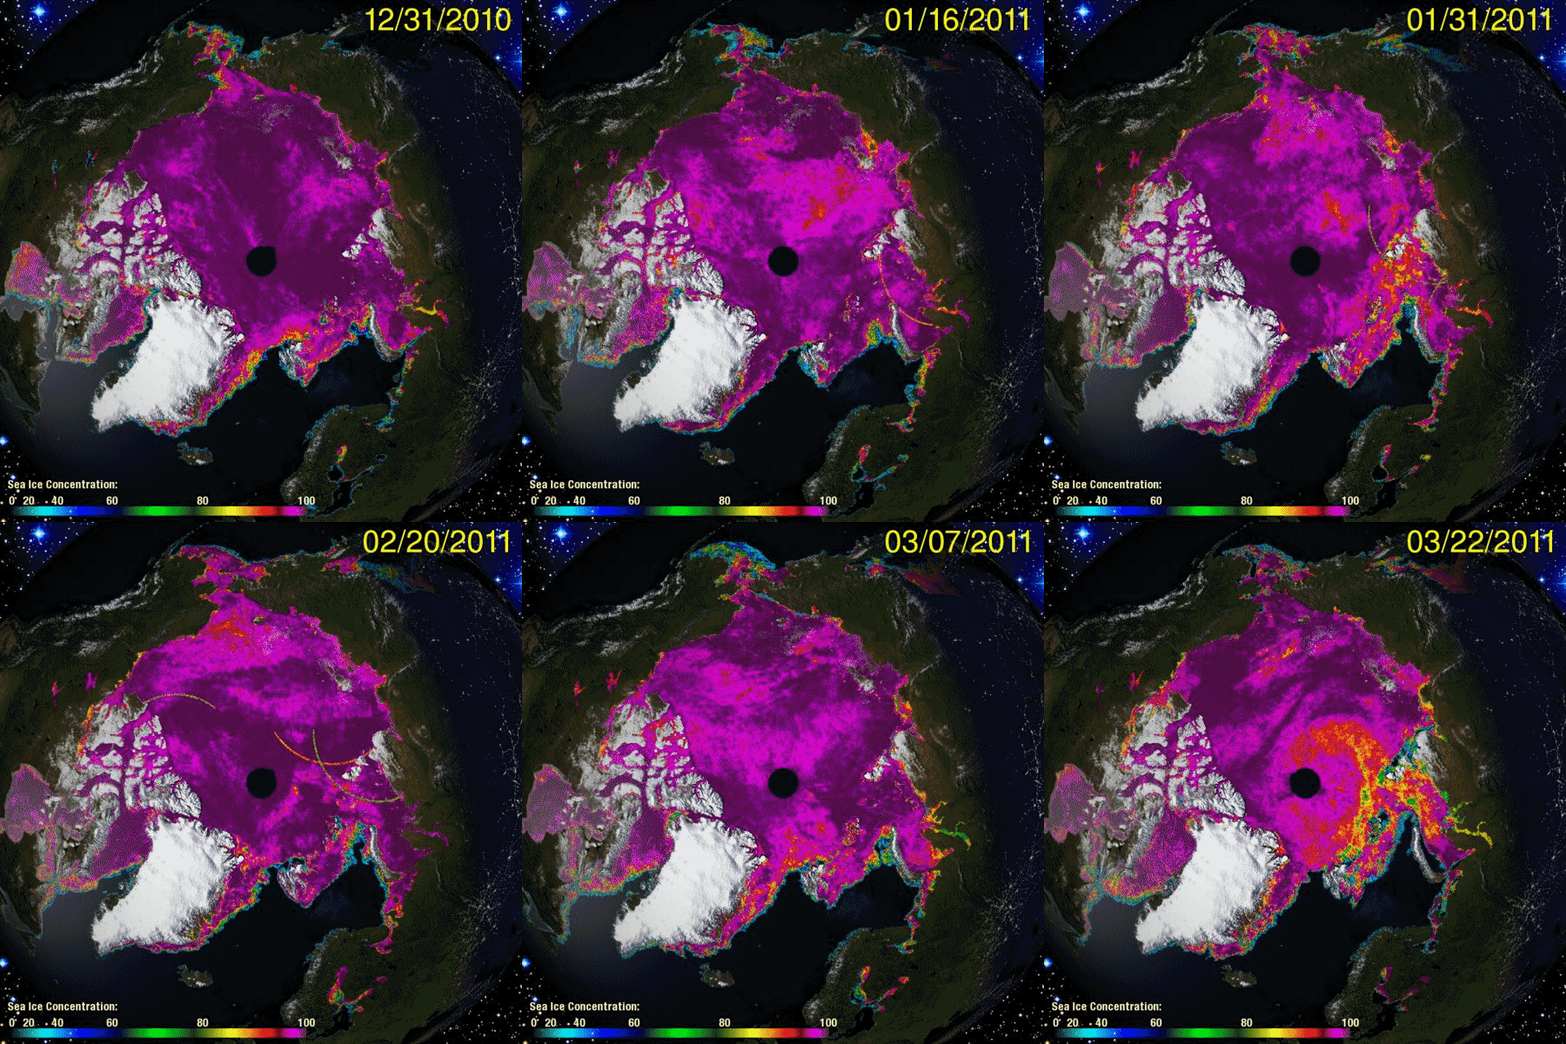
cryosphere animation
Sea ice concentration Dec 31 2010 to Mar 22 2011

The chart of sea ice concentration should be read in conjunction with the PIPS ice displacement chart animation and the current ice thickness chart below.
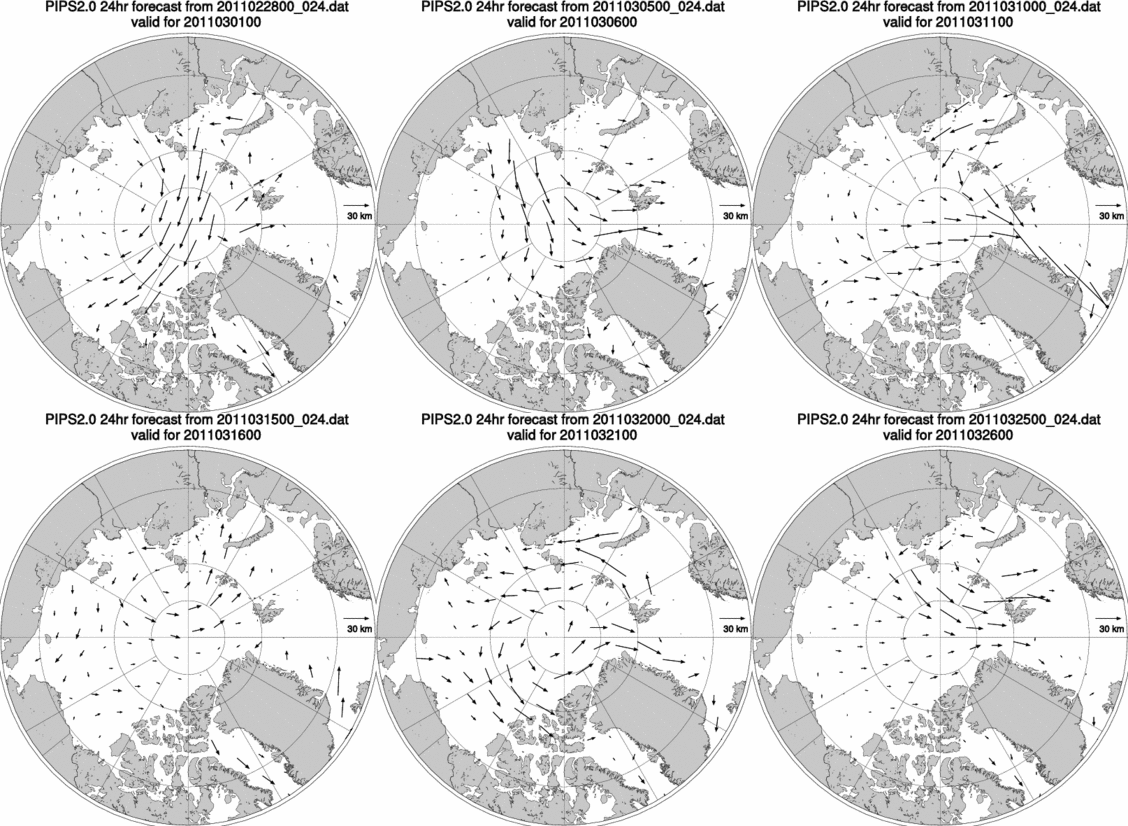
ice displacement animation
Ice displacement charts from March 01 to March 25 2011
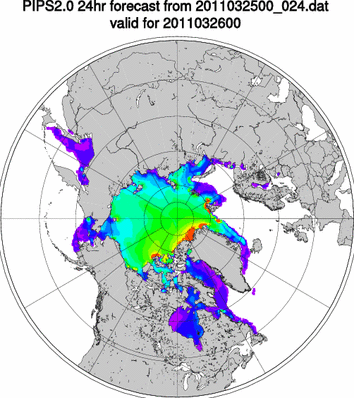

PIPS thickness
PIPS ice thickness forecast.

The red, yellow and green areas in the ice thickness chart are the last vestiges of sea ice thicker than 2.75 meters in the entire Arctic.  They consist of heavily fragmented ice much of which is being advected through the Fram Strait.  When the Nares Strait and NWP ice breaks up, that thick ice will be highly susceptible to advection through those passages.

The 3 to 5 thousand years old ice shelves which once extended north of Ellesmere island are now down to the last fragments.  If we discount those fragments there is little ice in the entire Arctic older than 5 years.  It bears constant repeating that the bulk of Arctic ice 2011 is 2 years old or less.

Nares Strait

Recent ice advection patterns; warm water advances into the Arctic from the Atlantic; ice distribution patterns: all of these things show that conditions continue to be advantageous for export of ice through Fram Strait.  Nares Strait is currently blocked by relatively weak ice.  As soon as the ice in Nares Strait breaks up, a continuation of current trends will be advantageous for the export of substantial volumes of the remaining older ice through that channel, supplementing the export through Fram Strait.

We are now (27 March 2011) within the time frame of my March 02, 2011 predition  for the breakup of the Nares Strait ice bridge.  Radar images show a melange of last year's floes and young ice.  This melange is so weak that a few cloudless days and / or a strong wind towards Baffin Bay will cause a rapid breakup of the ice bridge.  I expect to see ice being advected through Nares Strait about the 14th of April.
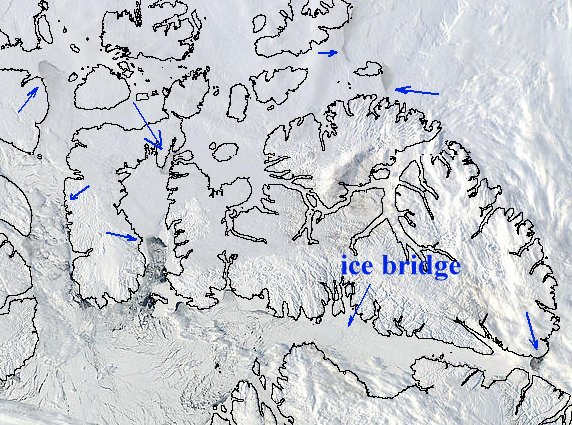
NWP Nares and Baffin Bay
NWP and Nares Strait

The arrows show 'places of interest' where ice is breaking up and being replaced by open water.  The ice bridge is still intact, but its breakup is imminent.
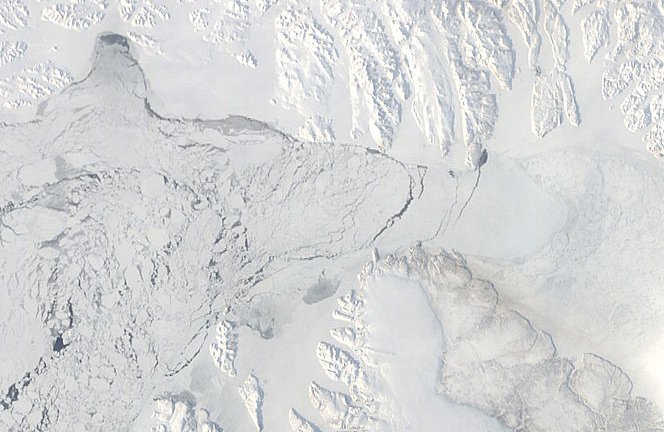
Nares ice bridge March 2011
Ice bridge at Kane Basin, Nares Strait March 26 2011


Ice volume

The decline in ice volume since 1979 is dramatically illustrated by this PIOMAS graph.
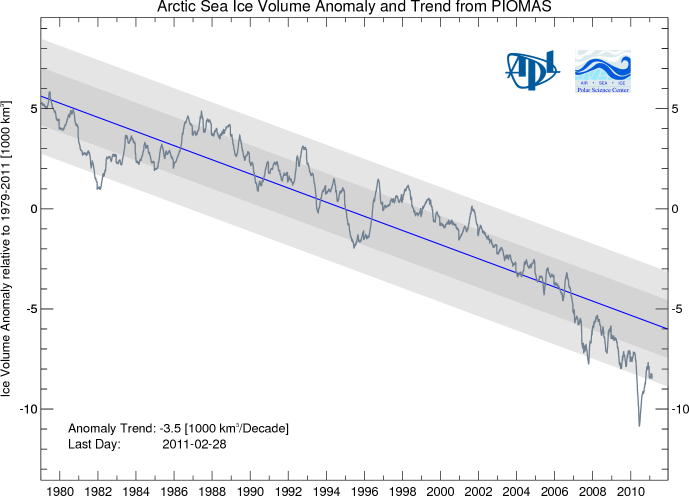
PIOMA ice volume
 
The importance of ice volume is that it reflects the ability of the Arctic sea ice cap to absorb heat without melting away entirely.  Thicker ice can survive summer melting longer than thinner ice.  Thicker ice has greater momentum by which massive floes slide over and under each other, slide over ice rubble, create massive compression ridges and generally make the ice more robust.  Thinner ice can melt away entirely, can fragment instead of slabbing.

An ice cap which is rejecting heat all winter can absorb the same amount of heat during summer without raising its temperature to the melting point.  Ice lost by ablation is readily replaced by the freezing of rain, snow and meltwater.  A robust ice cap, due to its thermal capacity, cannot melt away in summer.

The ice cap we see today is not robust.

Ice displacement patterns such as the one below will drive a great volume of ice out of the Arctic Ocean and into warmer waters.
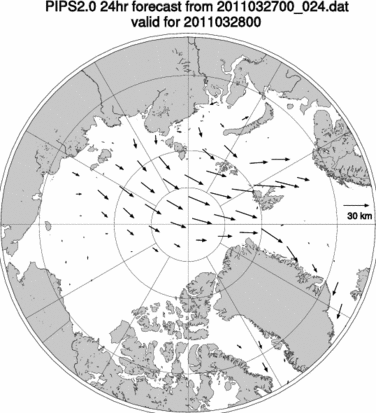
ice displacement

Summary

The melt season of 2011 is under way with less volume than former melt seasons.

Of that lesser volume, about 90% appears to be under 2.75 meters thick.

Much of the ice is less than 1 year old.

The Arctic's dynamic system seems primed to advect large quantities of ice out of the main ice cap area.

The Beaufort Gyre and Transpolar Drift have not yet appeared as stable patterns.  The instabilities in the ice drift patterns broadly favor ice export via Fram Strait.

Collapse of the Nares ice bridge is imminent.


Forecast

These forecasts represent what I expect to see based on a continuation of general trends.

Dates given should be taken as plus or minus 3 days.

The Nares ice bridge will be fragmented, and the ice in Kane Basin will be melting out by April 7th.

Ice from Lincoln Sea will be advecting through Nares Strait by April 14th.

The main North West Passage ice will show strong evidence of breakup and melt by April 30th.

By April 30th, ice extent graphs will show a strong downward trend similar to that of May - June 2010.

-------------------------------------------------
Sources:


http://nsidc.org/arcticseaicenews/2011/010511.html
Polar Science Center
http://arctic.atmos.uiuc.edu/cryosphere/
http://rapidfire.sci.gsfc.nasa.gov
http://www7320.nrlssc.navy.mil/pips2/


Further resources:

Arctic Sea Ice Blog
arctic sea ice graphs


Related articles:

Arctic Ice 2011 - Sail, Steam And Satellites
Arctic Ice March 2011
Arctic Ice March 2011 - Update #1
ice-in-baffin-bay
The ChatterBox Arctic Index

0 0

Printable Version  |  Link to this page

Comments

Prev  1  2  3  4  5  6  Next

Comments 151 to 200 out of 257:

  1. Yet more that the so-called skeptics can obfuscate about : Icy Meltwater Pooling in Arctic Ocean: a Wild Card in Climate Change Scenarios Freshwater is twice the volume of Lake Victoria and growing; Scientists inventory, synthesize 13 years of research on climate change and Europe’s marine environment A massive, growing pool of icy meltwater in the Arctic Ocean is a wild card in future climate scenarios, European researchers said today. Estimated in 2009 at 7,500 cubic km – twice the volume of Africa's Lake Victoria – and growing, the water could flush quickly into the Atlantic with unpredictable effect when prevailing atmospheric patterns shift, as occurred most recently in the 1960s and 1990s.
    0 0
  2. For the casual reader, Gilles has been trying to muddy the waters with a series of intersecting arguments. In logical order they are: A) The record of ice extent is too short to determine if the apparent trend is an actual trend or part of a larger cycle. Response: Epistemologically, this is an absurd argument. It is a truism of mathematics (and philosophy, where it is called the problem of induction) that any series can be generated by an infinite number of mathematical formulas which depart arbitrarily after a given point. Therefore, no length of recorded data is long enough to guarantee that the sequence is a declining trend rather than, for example, a cycle, or even just random noise. The epistemological solution, all else being equal, to use the simplest hypothesis, which will always have an a priori higher probability than the more complicated hypotheses. Mathematically, a declining trend is simpler than a cycle. Of course, in this case, all else is not equal, and there are good physical reasons to expect a declining trend rather than a cycle. We can illustrate this by considering a longer data series than the satellite arctic sea ice extent. The classic example would be the instrumental temperature record, which it is argued, by deniers is just the result of a 1500 year cycle (and never mind the inconsistency that the last peak in that cycle was just 500 years ago). I instead will use the historical arctic sea ice extent data:
    Sea ice extent in million square kilometers. Blue shading indicates the pre-satellite era; data then is less reliable. In particular, the near-constant level extent in Autumn up to 1940 reflects lack of data rather than a real lack of variation. Extends File:Seaice-1870-2007.png to 2009 using data from ftp://sidads.colorado.edu/DATASETS/NOAA/G02135/
    Let us put aside the small detail that this data completely rebuts Giles contention that the thirty year decline in sea ice on the satellite record may just be part of a 60 year cycle. After all, he can (and probably will) with equal validity argue that the historical data is just part of a four hundred year cycle, which just coincidentally shows a decline just as global temperatures rise sharply as a result of GHG forcing. Which is the point, really. No amount of data can prevent somebody seriously intent on obfustication from running Giles' argument. Sensible people make up their minds on the data we have - not on what might have been the data in some hypothetical nether world as Giles would have you do. B) The sea ice has "no memory" of any ice albedo fluctuations to drive further melting. Therefore, each winter resets the initial conditions preventing a feedback driven ice melt from creating any long term trend. Response: This is a shell and pea game. Gilles want to keep your eyes carefully watching the shells (sea ice extent) so that you don't notice the pea (sea ice volume) being slipped into his hand. Sea ice volume is particularly important in this context. Studies have shown that increased heat absorption due to exposed ocean surface has a far more direct effect on sea ice volume than on sea ice extent:
    Fig. 3. Solar heat input and melting. Comparison of (a) heat used in surface melting, Qms, to solar heat input to ice, Qi, during the period of surface melting and (b) heat used in bottom melting, Qmb, to solar heat deposited in open water, Qw. The straight lines are the linear leastsquares best fit to the data. In (a) the slope is 0.42, with a correlation coefficient of 0.38. In (b) the slope is 0.89, with a correlation coefficient of 0.94.
    This is not surprising. Direct radiation to the surface of the ocean warms the water, which then warms the ice by conduction. But the ice has far more contact with the water on its underside than on its edge. Further, a 100 meter melt on the edge of the ice cap will make a far smaller difference to extent than a 1 meter melt to the underside of the ice will make to volume. The consequence is that the ice albedo feedback has a far more significant direct impact on ice volume than on ice extent: Reduced sea ice volume in Spring aids the rapid reduction on sea ice extent by September both by making it easier (requiring less heat) to melt back the edges of the ice flows, and also by enabling a greater break up of the ice, by exposing more edges to the (relatively) warm water.
    0 0
  3. Tom Curtis #128 Tom Curtis has not responded at the Flanner thread so here is my point which took us there: Tom Curtis #40 says: **"I should first note that I originally identified the figure I calculated as the change in incoming flux only. I said, "Of course, not all the ice is melted because much of the energy escapes to space rather than being used to melt ice." (emphasis added) In a following post I said, " I am going to conclude that the "discreprancy" is simply a consequence of your mistaking different figures as representing the same estimate."** What is your point in calculating the incoming and ignoring the outgoing? Surely the whole discussion of AGW is about the *net* warming effects. One might as well suggest that we only look at possible changes incoming flux on *any* part of the Earth, while ignoring the changes in outgoing flux. A 0.75 degC increase in the surface temperature which is reflected in a similar emitting temperature will increase S-B outgoing radiation in proportion to (T1/T2)^4. That is the major cooling response. This applies equally to the Arctic as a 'black body' as anywhere else.
    0 0
  4. The trouble with arguing with Gilles is that he isnt interested in truth, only in winning an argument (or perhaps winning one). I bet he was tops in high school debating. You have to watch for the disingenuous debating trick all the time. Do you really think Gilles is unaware that ice volume is decreasing?
    0 0
  5. Ken Lambert @153: Answered! Relevant point for this thread: I did not just calculate incoming flux, I also referred you to Flanner who had calculated a change in forcing. In fact, I strongly suggest you use Flanner's result if you wish to make any argument about the inconsequential nature of the ice albedo feedback that is relevant to this thread.
    0 0
  6. I sincerely thank all people who care so much about my mental mind and can elaborate so deep thoughts about who I am, what are my real scientific capabilities , and what are my personal motivations. Unfortunately , as they don't know me personally, nor my life, or my personal opinions, they don't have the possibility to test their scientific theories by comparing them with reality. But obviously this doesn't change much their faith in their own beliefs. I'm the only one to be able to compare their judgements with my reality - and believe me or not, this is unfortunately not in favor of their perspicacity. But I can't prove them who I really am. Please notice that I wasn't claiming anything about the state of the ice in May , I was just asking for your opinion. Thanks to all who answers properly : no , there can be a lot of differences even if some parameters are equal. Well, that's what I would call a "memory", or more technically, a "hysteresis" . So let us admit there is such "memory" : my second question is : is there any clear parameter in the past (such as the value of last minimal, or maximal extent, the amount of < X years old ice, etc..) that would be useful to predict the next minimum, and allow such predictions to be made with a significative success ? (I stress again that I am not claiming anything, I just like to benefit from your deep scientific knowledge).
    0 0
  7. an answer to Tom : #152 well actually it seems that after dismissing totally the fact that we need historical records (much longer than T ) to interpret a variation over some give period T , you precisely use this method to validate the claim that you are doing - that the variation is indeed significative when compared with the past. But it was exactly what I was saying. It is not a question of fitting by any number of components, it is a question of comparing the amplitude of variation with a known noise - and to know the noise you have to measure it over a long enough period. Now it's unfortunate that the noise you're showing doesn't seem to be very accurately determined, since , "Blue shading indicates the pre-satellite era; data then is less reliable. In particular, the near-constant level extent in Autumn up to 1940 reflects lack of data rather than a real lack of variation." But there is fortunately a way of quantifying this inaccuracy : it is called "error bars" - do you have an idea of error bars associated with the pre-1940 measurements ?
    0 0
  8. another related question : do you have a physical explanation of why the arctic sea ice extent doesn't show any significative variation in the 1900-1940 period, when the average global temperature shows a variation similar , although slightly smaller, to the current one ? and when, noticeably , proxies data show the maximal variation ? are boreal trees much more sensitive to some kind of temperatures that sea ice doesn't feel, and reciprocally? on other word, could you explain the big difference in the post-1900 behavior of these two curves ? and this one ??
    0 0
  9. I note that Gilles has shown no evidence of having read the paper linked above which actually shows how to analyse for acceleration... and now we have a copy of Taminos explanation for sea level rise on site - yet he continues to shove one graph up against another and go "look, see"... 156 Gilles "But I can't prove them who I really am." No, but on discussion boards like this people tend to be judged by their deeds and words. And I echo others sentiments; I have worked with scientists, I know scientists, scientists are friend of mine. Gilles, you're no scientist.
    0 0
  10. Gilles ".... could you explain the big difference in the post-1900 behavior of these two curves ?" Off the top of my head? I'd say that looks very much as though starting the warming period with vast amounts of very thick ice is a great stabilising influence on ice extent. So influential in fact that once that particular warming period waned, it was easy for the ice to regain some, maybe not all, of the thickness invisibly lost from beneath to warmer waters.
    0 0
  11. les : you're just proving again your lack of perspicacity. I have 130 refereed papers, including 60 in a large scientific collaboration. Either something is wrong with you, or something is wrong with refereed papers - which is a problem for you anyway. If you only "know" scientist, or have only "friends", I do not consider you as a reliable person for judging who is a real scientist or not. 160 adelady : thank you for having the courage of proposing something - but what do you call "vast amounts of very thick ice " ? do you realize that most of the ice in winter is just 6 months old anyway, every year , so can't be "very thick"? so why the temperature change in the 1900-1950 period has not produced any change in the sea ice extent, whereas the largest change has occured only in the last decades - where strangely enough, on the opposite , temperatures haven't increased significantly since 1998 ? you seem all to say "come on, Gilles, it's obvious, the warmer it is, the more ice will melt" - but actually there is no obvious correlation on a year to year basis. I could equally argue that the melting of ice is "obviously" due to the motion of Pluto with the same data ....
    0 0
    Moderator Response: [Dikran Marsupial] Your claimed status as a scientist are off-topic unless you identify yourself so that the claim can be verified. Whether your posts have values depends on their intrinsic merit, not the merit of the source. Argument from authority is a logical fallacy, and unimpressive if the authority is unverifiable, so please everybody give it a rest, and limit the discussion to the science itself. The last paragraph is obvious trolling, there is a good physical reason to expect warming to result in ice melting, there is no good physical reason for the motion of Pluto to affect the ice melt, which is why one explanation is very much more plausible than the other. In science this is known as "Occams razor", if two theories explain the observations equally well, we should prefer the more simple. In this case any theory linking Pluto to ice melt is going to be pretty complicated.
  12. 161 Gilles - I understand, at least, that you are not first language English - the phrasing at the end of post 159 is a coining of Senitor Bentsen. You can't be blamed for not spotting that. In fact I [also] have a substantial background not least of all in science and engineering. But, as with all of us here, you cannot really validate that any better than I can or will go through your CV. Your arguments do not stand up to your claims of qualification. You should really strive to fix that.
    0 0
    Moderator Response: [Dikran Marsupial] Please, no more discussion of Gilles' science background, it is entirely irrellevant, and frankly just trolling.
  13. I imagine your scientific bona fides are called into question when you say things like "do you realize that most of the ice in winter is just 6 months old anyway" when you yourself provided a graph which showed that winter ice used to be 15 million sq k and dropped to 11 in the summer i.e 4 million was new ice. If the 11 million k multi-year ice was slowly being thinned by gradually increasing temps then there comes a point when it is thin enough to melt in summer allowing the sea to absorb more heat.
    0 0
    Moderator Response: [Dikran Marsupial] Gilles' scientific bona fides are off-topic, please let us not feed the troll on that one.
  14. Gilles: "is there any clear parameter in the past (such as the value of last minimal, or maximal extent, the amount of < X years old ice, etc..) that would be useful to predict the next minimum, and allow such predictions to be made with a significative success ?" No. None of the factors causing the ongoing trend of Arctic ice decline is consistently greater than short term weather variations. Ergo, no single such factor, nor even a combination of factors, can be used to precisely predict results in individual years. However, they can and have been used to predict the trend of the decline. Also: "do you have a physical explanation of why the arctic sea ice extent doesn't show any significative variation in the 1900-1940 period, when the average global temperature shows a variation similar , although slightly smaller, to the current one ?" Global != Arctic Arctic temperatures have risen much more in the recent warming phase than they did in the earlier part of the century. Further, as others have noted, the existing ice was much thicker in the past and thus the ice-albedo feedback effect was nowhere near as pronounced as it is now. That said, my recollection is that the perfect flat line in a few spots on that graph is due to lack of data for those years. Still, a gradual decline in Summer ice extent (i.e. the period most impacted by warming) can be seen in conjunction with the earlier warming period and a more pronounced decline with the current more pronounced Arctic warming. Finally: "so why the temperature change in the 1900-1950 period has not produced any change in the sea ice extent" As I noted, the Summer data does show a decline in the 1900-1950 period. Ignoring that in favor of the periods where warming would have less impact is essentially a return to the 'conditions have been reset' argument that you claimed you are not making.
    0 0
  15. 162 : les: I'm flattered that you waited until I didn't recognize a famous sentence before concluding english is not my mother language (I'm French - it's "Gilles" and not "Giles").But CB 164 : "However, they can and have been used to predict the trend of the decline." Fine : so please can you predict the trend , say, in the 10 next years, and how ? "Arctic temperatures have risen much more in the recent warming phase than they did in the earlier part of the century." The graph from Kaufman et al. 2009 that I reproduced just above obviously contradicts this assertion. And the biological proxies that are essentially summer responsive do show a much clearer increase at the beginning of century than now - so how do you explain that tree and lake sediments appeared to feel much more variable warmth in summer, at the beginning of the XXth century than sea ice ? another try ?
    0 0
  16. Michael : "winter ice used to be 15 million sq k and dropped to 11 in the summer i.e 4 million was new ice." ??? 6 months after being 15 or 10 millions km^2, winter ice becomes summer ice , with an extent between 4 and 5 Mkm^2 - so most of the 10 to 15 Mkm^2 of each year are only 6 months old anyway.
    0 0
  17. Prior to 1940 there seems not to be great deal of variance from: Winter 1 - 15 (Million sq k) Summer 1 - 11 Winter 2 - 15 (4 million k new ice) Summer 2 - 11 ... So 11 million k got to be multi-year ice i.e not "most of the ice in winter is just 6 months old anyway, every year". That we have less multi-year ice now is symptomatic of the problem. Or the above usage of 'most' could be just a language thing.
    0 0
  18. Gilles: "The graph from Kaufman et al. 2009 that I reproduced just above obviously contradicts this assertion." Let me guess, this is based on a 'highly scientific' eyeballing of the chart? If you actually measure out the years between 1500 and 2000 I think you'll find that the relevant values are (to the nearest 0.1 C); 1900: -0.2 1950: 0.0 2000: 1.0 So no, that graph does not 'obviously contradict' my statement that the more recent warming has been much greater. Also: "And the biological proxies that are essentially summer responsive do show a much clearer increase at the beginning of century than now" Source? Finally: "Fine : so please can you predict the trend , say, in the 10 next years, and how ?" Actually, I'm of the school of thought that the Arctic ocean will be largely ice free at the annual minimum by then. A decent writeup on this position can be found here. The next three years or so should clear up alot of the remaining uncertainty about where Arctic sea ice is headed. Best case scenario, the volume will level off soon and we can then look forward to a longer slow decline down to largely ice free in September around 2035. On the other hand, if volume continues to drop at anything like the rate it has been then we'll be seeing ice free Septembers by around 2015. It all depends on what the dominant factors driving recent ice decrease have been. To my thinking the data since 2007 suggest that increasing influx of warm water and stronger currents have become the most significant factors, and thus we are likely to see continued declines. If, on the other hand, direct greenhouse warming of the Arctic region is still the dominant driver then we'd see a more gradual decline (though it then becomes difficult to explain the recent sharp drops).
    0 0
  19. CBDunkerson : "If you actually measure out the years between 1500 and 2000 I think you'll find that the relevant values are (to the nearest 0.1 C); 1900: -0.2 1950: 0.0 2000: 1.0" It's a pity that we loose so much time on so simple things. ( -Baiting comment snipped- ) I read 1900: -0.4 1950: 0.2 2000: 0.3 so actually 85 % of the 1900-2000 increase occured before 1950, where apparently sea ice hardly varied. "Also: "And the biological proxies that are essentially summer responsive do show a much clearer increase at the beginning of century than now" Source?" uuuh ! Kaufman et al. 2009 !!! just said it. "It all depends on what the dominant factors driving recent ice decrease have been." ( -Baiting comment snipped- )
    0 0
    Moderator Response: [DB] Kaufman et al 2009 does not say what you think it says nor mean what you say it means. I suggest reading it, not a news story based on it. And please refrain from baiting (no more warnings). To all: Please only reply to the portions of Gilles'comments with substance; we will deal with the rest.
  20. Gilles,
    .... could you explain the big difference in the post-1900 behavior of these two curves ?
    Yes, because the warming at the poles in the past 30 years has been dramatically greater than during the 1900-1940 period (by GISTEMP, roughly 1.7˚C versus 0.7˚C). Look, this is very simple. Your position (No Global Warming):
    • Everything is either random or cyclical
    • We can't know anything
    • You are a scientist
    Science's position (Global Warming):
    • Ice melts from above due to warmer air
    • Ice melts from below due to warmer water
    • Less ice refreezes over winter, so the depth is less, although the extent is the same
    • Thinner ice melts faster
    • Summer ice extent has been dropping at an accelerating rate since the onset of serious global warming
    • Temperatures keep rising so each year the ice melts sooner
    • Open ocean absorbs more heat than ice, providing a positive feedback (i.e. warming the planet further)
    • You are a random/cyclical voice that repeatedly posts tiresome denial talking points at SS and RC, flavoring them with just enough detail and scientific language to give them an air of knowledge and superiority, while simply ignoring anything that anyone says that you can't easily obfuscate, or that exposes your obfuscation for what it is.
    • Because you ignore the points you can't obfuscate, but throw together huge diatribes where obfuscation is easy, you pollute entire threads with what appears to be reasonable debate, but is really merely part of your ongoing, unending effort to confuse the people for whom the facts behind any issue are not already painfully clear.
    0 0
  21. "Your position (No Global Warming):" could you please show me a post where I said there was no Global warming ? "Everything is either random or cyclical" could you please show me a post where I said that "everything" was either random or cyclical ? "We can't know anything" do you think we know everything ? [Discussion of scientific background snipped] "Ice melts from above due to warmer air Ice melts from below due to warmer water" I admit that ice rarely melts because it's getting colder. "Less ice refreezes over winter, so the depth is less, although the extent is the same" first winter extent and summer extent are poorly correlated. Second all the peripheric ice is one year old, as I said - so the depth doesn't vary much in the outer parts. I will not comment all the other sentences : just try to correlate the variation of sea ice extent or area and the variation of average temperature of the Earth, and show me the correlation. and again, how much of your comments does belong to the category of "ad hominem " comments ?
    0 0
    Moderator Response: [DB] Please look up the definition of "ad hominem". [Dikran Marsupial] I have already warned you that discussion of your science background is irrelevant and off-topic, I have snipped it this time, next time I will just delete the post.
  22. Gilles: "Can't you really read a figure ?" I can read the part where the first graph had both proxy and actual temperatures while the second includes only the proxies. [snip] >plonk<
    0 0
    Moderator Response: [Dikran Marsupial] Please no accusations of duplicity. It is best to apply Hanlon's razor, in such circumstances. I have edited rather than deleted as the scientific point is a good one (unless Gilles can provide a reason why we should trust a proxy reconstructions over direct observations).
  23. RE the melting of sea ice, and claims that it melts from below. It can melt from above and below, and melt ponds are a mechanism by which the surface albedo is lowered, leading to a positive feedback process for melting. From NSIDC: "Sea ice melts during the summer when solar radiation heats the ice surface.....After the snow starts to melt, melt ponds form, and because water has a lower albedo than snow, the surface albedo of sea ice with snow and melt ponds drops to about 0.75 (75% solar radiation reflected). As the melt ponds grow and deepen, the albedo continues to decrease, leading to higher absorption of solar radiation and an increased rate of melting. Energy to melt ice can come from sources besides direct solar energy. Water that is under the ice and that has a temperature above the freezing point causes the bottom surface of the ice to melt. Warm surface waters cause the edges of the ice to melt, particularly in leads and polynyas." [Satellite-derived surface temperature trends for 1981-2003 Source Earth Observatory] [from Earth Observatory] From EO link: "The maps also show that, in most areas, the date of freeze onset is changing more than the date of melt onset. The scientists say this pattern is consistent with a climate process known as the ice-albedo feedback. Dark ocean water absorbs more sunlight than bright, reflective ice. Even a small change in the start of the melt season exposes the ocean to more incoming sunlight, which warms the water, which melts more ice, and so on. The more solar energy the ocean absorbs during the summer, the longer it takes in the fall for the water to cool down enough to freeze." Arctic SST anomalies: [Source NSIDC] From above NSIDC link: "The high sea surrface temperatures resulted largely from the loss of sea ice: dark open water areas absorb more solar radiation than reflective ice. The warmer water in turn helps to melt more sea ice. This positive feedback likely contributed to the ice loss through summer 2010, especially late in the season when surface melt had largely ceased."
    0 0
  24. 171, Gilles,
    could you please show me a post where I said there was no Global warming ?
    Please point to any one post of yours in the past year when you have demonstrated complete agreement with some aspect of current climate science.
    ...could you please show me a post where I said that "everything" was either random or cyclical ?
    Please point to any one post of yours in the past year when you've not taken that position on any issue.
    winter extent and summer extent are poorly correlated
    Irrelevant and a good example of your constant obfuscation. This is exactly my point, that there is no correlation between the two. Winter ice extent recovers close to 100%, but it is an illusion, because the ice is thin so the summer extent depends on winter volume as spring/summer temperatures, not winter extent or winter temperatures. Since the two are entirely separate, of course there's no correlation between the two. I think this is pretty obvious to everyone, so why do you bring it up?
    just try to correlate the variation of sea ice extent or area and the variation of average temperature of the Earth, and show me the correlation.
    Again, science isn't done only by correlation, but by hypothesis, experiment, and confirmation or refutation. The hypothesis is that warming temperatures will reduce summer ice extent through the mechanisms described. Observations show global temperatures increasing and summer ice extent retreating, completely in line with the hypothesis. Look at your own graph in post 158. See how the temperatures spike up? And the ice extent spikes down? That is called a correlation. To get more specific, however, while viewed from a distance global temperatures appear to have risen consistently over the past century, in fact the increase in the past 3 decades has been markedly higher. More importantly, the distribution is not even. Warming at the poles is much greater in the past three decades, particularly in spring. Consider: 1940-1950 spring warming by latitude (note the scale, not the curve alone): 2000-2010 spring warming by latitude (more than double 1940-1950): 1940-1950 summer warming by latitude (note that the north pole actually demonstrated cooling!): 2000-2010 summer warming by latitude (note that while warming is less, exactly as expected by GHG theory, it is still positive rather than negative): I think that pretty decisively explains why we're seeing retreating extent now and not earlier in the century, despite apparent global warming (but not necessarily significant polar warming) over the entire period.
    0 0
  25. Moderator on #172. Right, allow me to rephrase: I made statements about actual Arctic temperature anomalies shown in the Kaufman graph (which showed both actual and proxy values) attached to post #158. In #169 Gilles suggested that this indicated I 'can't really read a figure' and used a new Kaufman graph, showing only proxy values, to 'refute' my numbers. I do not find this argument compelling.
    0 0
    Moderator Response: [Dikran Marsupial] Once pointed out, neither did I. However this thread seems in need of more moderation than most [which is why I have had to withdraw from active discussion], and removing some of the heat from the discussion will encourage a more rapid return to scientific issues. So please can we all stick ultra-strictly to the comments policy.
  26. Sphaerica at 01:03 AM on 8 April, 2011 OT: It looks like the imageshack pics can only be seen when you log in to their website (at least to me). Apparently, this problem is only solved when John makes a duplicate of the pic in his website and redirects the link, which is not feasible in blog posts. Only so that you know.
    0 0
    Moderator Response: [DB] If others cannot see Sphaerica's graphics, let me know & I will fix it.
  27. Once again, I am grateful for all comments. The ongoing debate here has helped me to realize that I need to compile a list of all known or suspected sea-ice melt feedbacks, positive and negative. Let me correct some misunderstandings. We have maps and reports going back to the Elizabethan era which, together with many proxy studies, help us to determine the extent of ice prior to the 1950s. It is clear that ice extent began to decline around the 1850s. Prior to the 1850s the eastern coast of Greenland was virtually unapproachable due to the many miles of landfast ice extending from Nord to Kap Farvel and beyond. Baffin Bay had perennial ice which blocked access to the entrance to Nares Strait and the NWP except for 2 to 4 weeks in the year. North Baffin Bay was discovered by William Baffin in 1616 but his discovery was not believed for 2 centuries because the ice prevented any access until then. The history of discovery in the Arctic is a history of reduced total ice mass. Prior to about 1850 the Marginal Ice Zone - MIZ - would melt in summer and return in winter. Since about 1850, more ice has melted in summer on average than has reformed in winter. The discrepancy has been increasing, with a notable acceleration post 1950 and another post 1990. Contrary to popular belief the MIZ does not consist only of new ice. As new ice was advected into the main pack, to circulate and age there, older ice would advect out into the MIZ. Along the coasts of Greenland the MIZ also contains a very substantial number of icebergs. MIZ compressed into coasts continues to age. MIZ advected through Fram Strait leads to a loss of old ice. What has been changing is the total area covered by sea ice and the circulation patterns. As the main pack has shrunk and the MIZ has followed it, a point has - in my opinion - long been reached where the MIZ and the main pack were equal in extent. Judging by the 2010 and current fragmentation patterns, and the loss of multi-year ice, the main pack now has the consistency of the former MIZ. In plainer language: I fear that the Arctic's sea-ice cap is almost all MIZ - hence subject to substantial seasonal loss. Fragmented ice presents substantial open water to be heated by the sun. The warm water is advected under the ice promoting bottom melt. That bottom-melt feedback is in addition to the feedback due to the loss of albedo. I'll halt there for now, for fear that this comment might grow into an entire article. :)
    0 0
  28. concerning proxy : I didn't refer to the instrumental curve, but to the proxy reconstruction. Please read again my post "another related question : do you have a physical explanation of why the arctic sea ice extent doesn't show any significative variation in the 1900-1940 period, when the average global temperature shows a variation similar , although slightly smaller, to the current one ? and when, noticeably , proxies data show the maximal variation ? are boreal trees much more sensitive to some kind of temperatures that sea ice doesn't feel, and reciprocally? " so I think having clearly stated that 1) instrumental temperatures increased in both periods, a little bit more in the second than in the first (but not by orders of magnitudes) 2) proxies increased mostly in the first period 3) Arctic ice decreased mostly in the second one. Do you agree, or not? is there an obvious explanation for these weird correlations, showing that the temperature increase was mostly correlated with proxies but not with ice in the first period, but the opposite in the second one ? I could suggest one actually : there is a "good warming" , which is natural and can't do any harm to nature, in the first part of the century. The good warming likes trees because trees are natural, and likes polar bears too. So it doesn't make sea ice melt , but it helps trees growing. And there is a "bad warming", human-made, which does the opposite because it doesn't like Nature : makes sea ice melt and does not help tree growth Sphericae : " Please point to any one post of yours in the past year when you have demonstrated complete agreement with some aspect of current climate science." It was not the point, and I didn't claim that either. I don't see the interest to post if I have no question to solve about science. I don't ask things about relativity either. "Please point to any one post of yours in the past year when you've not taken that position on any issue." All posts : I didn't say everything was cyclical. I said that the significance of a variation must be estimated by the comparison with natural variability in a previous period. "Winter ice extent recovers close to 100%, but it is an illusion, because the ice is thin so the summer extent depends on winter volume as spring/summer temperatures, not winter extent or winter temperatures. Since the two are entirely separate, of course there's no correlation between the two. I think this is pretty obvious to everyone, so why do you bring it up?" It is not obvious at all for me , sorry. Do you have a correlation between summer extent as a function of winter volume ? "I think that pretty decisively explains why we're seeing retreating extent now and not earlier in the century," I don't see what you have explained - just drawing two curves and saying "oh they have both risen" is very far from an explanation. Again the first decade of the XXIth century when ice most retreated is far from being the decade when temperatures most increased.
    0 0
    Moderator Response: Fixed broken bold tags [Dikran Marsupial] The "good warming" "bad warming" appears to be blatant trolling, I suggest this post is ignored. Also nobody here is suggesting a correlation bewteen two graphs is an explanation, it is a correllation that corroborates an explanation.
  29. sorry for unclosed boldface tag
    0 0
  30. 178, Gilles,
    It is not obvious at all for me , sorry. Do you have a correlation between summer extent as a function of winter volume ?
    I have told you repeatedly that looking for simplistic correlations and focusing on correlations without understanding physical mechanisms is a waste of time. But you know that, don't you?
    I don't see what you have explained...
    Of course you don't, because admitting to any aspect of global warming is contrary to your belief system.
    Again the first decade of the XXIth century when ice most retreated is far from being the decade when temperatures most increased.
    This is patently and demonstrably false and misleading. First, what matters here are Arctic, not global, temperatures, as I demonstrated in the graphs that you are conveniently ignoring. Second, the pace of continued warming from 2000-2010 is not nearly as important as the temperature which as been reached by that point, as well as what logicman keeps referencing, which is basically that a "tipping point" has now been reached which is freeing methods for old ice to pass out of the Arctic circle. It's basically a different paradigm than past centuries presented. Before, all that mattered was temperatures, melting the ice inward from the edges. Now, wind and water circulation patterns are becoming important, because the ice further inward has thinned and melted enough to free up. Of course, if one can't think beyond a pair of centuries long graphs, taking into account physical mechanisms and varying observations, instead of the most childishly simplistic views of things... well, you're just never going to get it.
    0 0
  31. " It is clear that ice extent began to decline around the 1850s. Prior to the 1850s the eastern coast of Greenland was virtually unapproachable due to the many miles of landfast ice extending from Nord to Kap Farvel and beyond." Very interesting, but frankly, I'm lost : didn't you say that the ice melting didn't occur before ? if there is long term (secular) variability and short term (annual) variability, what about the medium term (decadal) variability ?
    0 0
    Moderator Response: [Dikran Marsupial] If you think someone has contradicted themselves, give a link to the previous comment so that it can be verified. Without it, this looks very much like trolling, the ice has waxed and waned for millenia, so it is very unlikely that any such comment was made.
  32. RE long term variability in the Arctic temperatures and sea ice, please read the links(e.g., Polyak et al.) posted in my post @38. The long term downward trend and acceleration of Arctic ice volume loss that is being witnessed in the Arctic is clearly highly unusual and not explained by natural variability alone.
    0 0
  33. Gilles#169: "It's a pity that we loose so much time on so simple things" For the first time, we agree! A quick count shows at least 12 prior threads about Arctic ice loss (including Greenland, but excluding Antarctica). And yet there are still those who claim to disagree on the most basic points: Arctic summer ice extent is decreasing at an increasing rate and Arctic temperatures are increasing. I suggest that anyone who claims to have 'scientific' objections must first review the mountain of data presented in these many threads; if they still have something to say other than 'I can't see the correlation' or 'No, its not,' then we can talk.
    0 0
  34. Readers, Global warming refers to the increase in the globe's mean temperature; warming, will not be uniform across the planet, nor will it be monotonic. For example, the theory of AGW suggested for a very long time now that the northern high latitudes will warm faster than elsewhere with increasing GHG concentrations. And that is exactly what we are seeing, and not surprisingly, the ice volume is decreasing fastest in the northern high latitudes. This is all quite elementary and simple, and very well documented in the scientific literature, as are previous natural mechanisms responsible for the advance and retreat of the ice caps, yet some choose to ignore the science (and history) and choose instead to talk through their hats and troll. The trolling has now lost its entertainment value and is now boring and tiresome. This thread really needs to be cleaned up.
    0 0
  35. This discussion has been interesting and educational, so thanks to all who participated. At his point though I am having difficulty following what Gilles is arguing for/against. Perhaps a restatement of your position is in order? It might clear some things up and get this discussion back on track. At the moment it seems to be all over the place and getting a bit personal.
    0 0
    Moderator Response: [DB] Gilles' modus operandi, after having watched his orbit over at RC and here for over a year, is to draw as many possible people into as many conversations as they will endure for as long they can stand; in doing so, he will say less with more words than can be believed for the sole purpose of wasting your time.
  36. Mucounter :"A quick count shows at least 12 prior threads about Arctic ice loss (including Greenland, but excluding Antarctica). And yet there are still those who claim to disagree on the most basic points: Arctic summer ice extent is decreasing at an increasing rate and Arctic temperatures are increasing. " Mucounter : when I said that a variation must be estimated with respect to the noise, I'm not saying the variation does not exist. You're just stating that the variation exists, and I don't disagree on that. It was not my point. My point is : what is the variability at this frequency (i.e. : at a 30 years scale). Do we have an accurate measurement of it, yes or no ? ( - Snip - )
    0 0
    Moderator Response: [DB] Off-topic portion snipped.
  37. GIlles#186: "what is the variability at this frequency (i.e. : at a 30 years scale)" Based on the graph you posted in #158 and others (myself included) have also posted, the 'variability' is thus: Within 30 years, summer Arctic sea ice extent may be perilously close to zero. The JAXA monthly extent data show this 'variability': summer minimum has dropped by one third, from ~6 million to ~4 million sqkm, in less than a decade. It is remarkable that one who claims such powerful scientific credentials either cannot or will not see this. What can be said of a decade hence? < 2 million sq km? < 1 million? Yet you persist with nonsensical questions. 'And Nero fiddled whilst Rome burned' will be rewritten to say 'And Gilles prevaricated whilst the summer Arctic became ice free.'
    0 0
  38. DB: I think the number of words and topics I'm adressing is much less than yours - so how to qualify your own modus operandi ? muoncounter : it may be that the Arctic will be icefree in 2030. I don't know. What I'm discussing here is the significance of a trend - and so the possibility of extrapolating it. I know that any decreasing trend can be extrapolated to zero. What does it prove ?
    0 0
    Moderator Response: [Dikran Marsupial] It doesn't prove anything, but it suggests that based on the information we have, unless something changes, we are likely to see an ice free Arctic. That interpretation is so obvious, I am surprised it needs explaining to you. You do know that you can never prove an hypothesis empirically, only disprove, don't you? Also the difference between your posts and DBs is that his goal here evidently is to discuss the science, unlike you, which explains why his posts generally have useful content. Enough sniping.
  39. Gilles: I can clearly discern the trend of your comments and they extrapolate to an infinity of 'yes buts' and a miniscularity of useful content. Our planet doesn't care what we believe. It just keeps on swinging around that jolly old sun whether or not the human race has wiped itself out. Once the Arctic is perennially ice free the unstable northern climate will do something which we cannot yet predict with any certainty. At the extremes of that range of uncertainty are two highly plausible scenarios: 1 - methane clathrates dump their cargo into the atmosphere , triggering massive global temperature rises. 2 - a warmer Arctic causes greater precipitation of snow which no longer melts entirely in summer. Within a decade or two it becomes obvious that a new ice age has started. This is not science fiction and it is not a computer game. I write about climate change because I wish the human race to continue long after I am gone. I shall pass this way but once. If I can leave behind me even the tiniest amount of scientific knowledge that is of value to future generations then I shall not have lived in vain.
    0 0
  40. 188, Gilles,
    I know that any decreasing trend can be extrapolated to zero. What does it prove ?
    The statement itself proves nothing. Your death grip on the statement and refusal to look beyond it proves that if all that you do is to look at numbers and trends and correlations, you will be frozen into inaction because you actually understand nothing. For those of us who apply science, and mechanics, and insight into what is going on behind the numbers and the trends and the correlations, it gives us a chance to alter events and so control our future. A wise man lives with a future, a fool lives with a destiny.
    0 0
  41. Gilles#188: "I know that any decreasing trend can be extrapolated to zero. What does it prove ?" In this case, it is the value of your continued comments that is clearly decreasing. In the case at hand, it proves that if we continue knowingly doing the same stupid thing, we have no one to blame for the result but ourselves. More importantly, it should suggest, to someone of an open mind, that things must change before we get to zero. It should also stimulate us to work harder to rise above the incessant noise: 'no, its not,' 'I can't see the trend,' 'what is the variability on an arbitrary timescale?', 'what does it prove?' are just noise.
    0 0
  42. Mucounter : "It should also stimulate us to work harder to rise above the incessant noise: 'no, its not,' 'I can't see the trend,' 'what is the variability on an arbitrary timescale?', 'what does it prove?' are just noise." So : are you claiming that, contrary to what I said, measuring a trend over T years allows us to extrapolate this trend with a good confidence (in the above sense : reducing significantly our uncertainty on the future), without knowing anything about the normal variability at this time scale ? is that your claim ?
    0 0
    Moderator Response: [Dikran Marsupial] It is not correct that we know nothing about the normal variability on that timescale, so your question is a non-starter. The historical data shown here strongly suggests there is no (quasi-)periodic variability at this timescale. As I said earlier, correllation is not causation, and the reliability of any extrapolation depends on the explanation for the trend, not its statistical significance. In this case, there is good reason to expect the fossil fuel emissions to cause substantial warming in the Arctic and for that warming to cause melting of the ice (and for albedo feedback to tend to hasten that melting). Unless you have some physical explanation for the existence of multi-decadal oscillations in sea ice extent, then it is a less plausible explanation. That is the way science works, reduction to the most plausible explanations, and in this case "multi-decadal" oscillation is not very plausible as there is no mechanism (unlike for example ENSO) explaining why/how it ocurrs, and it doesn't seem to even exist in the pre-satelite data.
  43. logicman: "a warmer Arctic causes greater precipitation of snow which no longer melts entirely in summer. Within a decade or two it becomes obvious that a new ice age has started." I've wondered about this theory for quite a while. One aspect of it which I've read about is a possible 'shutdown' of some of the major ocean currents (due to changing salinity) causing less warm water to be transferred towards the Arctic. However, wouldn't that be a self-regulating effect? That is, loss of heat transfer from the tropics would cause the Arctic to start cooling again... which would cause more ice formation... which would again change ocean currents... which would allow the ongoing greenhouse warming to again become dominant... et cetera. Likewise the heavy snow bit you reference. As I recall that was a theory that the change in albedo from all that snow would be enough to prevent the snow from melting and trigger a re-freeze of the Arctic. But wouldn't that then cause the increased snowfall to stop be melted out by the ongoing greenhouse warming? Obviously loss of the Arctic ice will have a significant impact on weather patterns throughout the northern hemisphere (if not the globe), but I have a hard time seeing how it could result in a swing back to an ice covered Arctic without that then cancelling out the factors which were causing it. The only ongoing long term change we are seeing right now is the rise in atmospheric greenhouse gas concentrations. Doesn't that mean everything else will be feedbacks around that trend? Or are there really potential negative feedbacks strong enough to completely cancel out and indeed reverse the warm forcing which caused them?
    0 0
  44. "The historical data shown here strongly suggests there is no (quasi-)periodic variability at this timescale" First even the legend said they're not really reliable because of the lack of data. I asked for the error bars : where are they? are error bars also pointless and a "non-starter question" ? And even if you believe in these historical data, as I said, they show that the ice was pretty much insensitive to the change of temperature at the beginning of century. So the very same historical data contradict your model that " warming ... cause melting of the ice (and for albedo feedback to tend to hasten that melting)." At least you should address this issue. CBDunkerson : it seems that you're slowly discovering the existence of spontaneous limit- cycles ...
    0 0
    Moderator Response: [Dikran Marsupial] O.K., so the historical data are "unreliable", however it does at least exist, and it gives no support whatsoever to the existence of multi-decadal oscillations. That means it is still more credible than your hypothesis of multi-decadal oscillations, for which you have presented precisely zero evidence, and for which you have not even been able to propose a causal mechanism.

    Secondly, the historical data do not necessarily say that the ice is insensitive to the change in temperature as temperature is not the only thing that controls ice loss, and those factors need to be considered. It is also possible that the earlier warming did cause reductions in sea ice volume, but not extent.

    Now it is time to "put up or shut up", what evidence do you have that multi-decadal oscillations exist in sea ice extent or suggested causal meachanism. If you can't come up with something, then you objection is no more reasonable than "melting is caused by the orbit of Pluto", or "it is being stolen by little green men from uranus", or astrology.

  45. ""multi-decadal" oscillation is not very plausible as there is no mechanism (unlike for example ENSO) explaining why/how it ocurrs, and it doesn't seem to even exist in the pre-satelite data." really? we have no explanation for multidecadal oscillations so they don't exist? you should write that to NOAA... http://www.arctic.noaa.gov/detect/climate-ao.shtml
    0 0
    Moderator Response: [Dikran Marsupial] O.K, so the next step, what is the AO and oscillation in, excatly? One wonders of course why you didn't mention this earlier ;o) BTW, if you are wondering what I am doing, I am just trying to getyou to state your position on this clearly and unambiguous, with sufficient detail to determine whether it has merit. That is the way scientific discussions work.
  46. DM : if you discuss about significance, you don't have to prove there is something else. You don't have to prove it is *not* real. It is just a matter of confidence. For instance, you say : "Secondly, the historical data do not necessarily say that the ice is insensitive to the change in temperature as temperature is not the only thing that controls ice loss, and those factors need to be considered." you admit that other things than temperature can influence ice melting - but this also means that current melting can be due to these "other things". Concerning AO , I'm not saying this is the cause of ice melting - I just present an example of obvious multidecadal oscillations, and there are others. i'm not trying to design my own theory - and when talking with astrologists, I don't try to "prove" any other explanation of why we have our personality either. The burden of the proof is for the one who claims he has a theory - and extrapolating a linear trend can hardly be called a "theory" in my sense. It is well possible that part of the melting is due to global warming and another part belongs to long period cycles - thus extrapolating would grossly exaggerate the rate. It is possible that on the opposite it's entirely due to GW and will even accelerate due to non linear feedback - I'm just saying that I don't see strong evidence for that. The more uncertain are the data, the easier you can predict catastrophes ...
    0 0
    Moderator Response: [Dikran Marsupial] "The burden of proof is for the one who claims he has a theory" says it all. You can't prove a theory by observation; that is well known in the philosophy of science (Popper). Tom Curtis has already pointed out to you that this is the well-known "problem of induction", and both he and I have pointed out the solutions to this problem that have been adopted in the world of science. If your point is only (essentially) that there maybe be stuff we don't know about that might be causing the ice to melt other than warming, then yes, you are technically correct, but science has developed means to deal with this epistemological doubt that have proven highly effective for a couple of centuries. If they hadn't, we would have no means of inferring a general principle from observations, and science would have made little progress. You have made your point, it is irellevant and displays a lack of understanding of scientific method, and any further repetition is now "off-topic".

    It is interesting Gilles mentions astrology as it was used to exemplify the difference between science and non-science by Popper. Gilles could usefully occupy his time reading up on Poppers work (e.g. here). He might even realise that what he is doing is rather akin to astrology (looking for correlations that "explain" the observations without worrying about a physical mechanism that might imply the correlation is due to a causal relationship. If you look hard enough you can always find a correllation with something - even if it is the motion of Pluto - not that anyone would make that argument ;o).

  47. concerning AO http://www.jisao.washington.edu/wallace/ncar_notes/ "An important challenge facing us now is to incorporate these AO-related changes into our thinking about human influences on climate." As I understand it : it is not yet done.
    0 0
  48. That quote @197 was made 11 years ago. The AO has been reproduced in models for some time, and the impacts of natural variability and various forcings (e.g., volcanoes, anthro GHGs) has also been investigated (e.g., Gillett et al. (2002), and very recent work has focussed on the impacts of Arctic sea ice loss on the AO and NAO. Also read AR4.
    0 0
  49. Gilles#196 "I'm not saying this is the cause of ice melting - I just present an example of obvious multidecadal oscillations, and there are others." Excellent. I'm not saying ice is melted by the exhaust from snowmobiles; I'm just presenting an obvious example. No one takes this sort of statement seriously. If you are proposing that 'oscillations' are the cause of an effect that has a long-term trend, do so in a scientific manner. Review the evidence (not just the vague pronouncements) and take it to a thread that discusses such oscillations. That is what an actual scientist would do.
    0 0
  50. DM, Thanks for your efforts here. Perhaps also please try and and steer/guide contrarian back to the subject of this thread-- the current melt season, the subject of this thread.
    0 0
    Moderator Response: [Dikran Marsupial] No problem, good point, please pay attention to it everybody! ;o)

Prev  1  2  3  4  5  6  Next

You need to be logged in to post a comment. Login via the left margin or if you're new, register here.


The Consensus Project Website

THE ESCALATOR

(free to republish)


© Copyright 2024 John Cook
Home | Translations | About Us | Privacy | Contact Us