


 Arguments
Software
Resources
Comments
The Consensus Project
Translations
About
Support
Arguments
Software
Resources
Comments
The Consensus Project
Translations
About
Support
![]()
![]()
![]()
![]()
![]()
![]()
![]()
![]()
![]()
![]()


![]()


Latest Posts
- Why India is key to heading off climate catastrophe
- 2024 SkS Weekly Climate Change & Global Warming News Roundup #18
- Skeptical Science New Research for Week #18 2024
- At a glance - Clearing up misconceptions regarding 'hide the decline'
- Pinning down climate change's role in extreme weather
- 2024 SkS Weekly Climate Change & Global Warming News Roundup #17
- Fact Brief - Is Antarctica gaining land ice?
- Simon Clark: The climate lies you'll hear this year
- Skeptical Science New Research for Week #17 2024
- Water is at the heart of farmers’ struggle to survive in Benin
- At a glance - The difference between weather and climate
- India makes a big bet on electric buses
- 2024 SkS Weekly Climate Change & Global Warming News Roundup #16
- EGU2024 - An intense week of joining sessions virtually
- Skeptical Science New Research for Week #16 2024
- How extreme was the Earth's temperature in 2023
- At a glance - Is the science settled?
- What is Mexico doing about climate change?
- 2024 SkS Weekly Climate Change & Global Warming News Roundup #15
- Fact Brief - Did global warming stop in 1998?
- Skeptical Science New Research for Week #15 2024
- EGU2024 - Picking and chosing sessions to attend virtually
- At a glance - The Pacific Decadal Oscillation (PDO) is not causing global warming
- Climate Adam: Is Global Warming Speeding Up?
- 2024 SkS Weekly Climate Change & Global Warming News Roundup #14
- Gigafact and Skeptical Science collaborate to create fact briefs
- Skeptical Science New Research for Week #14 2024
- How can I make my retirement plan climate-friendly?
- At a glance - Global warming and the El Niño Southern Oscillation
- A data scientist’s case for ‘cautious optimism’ about climate change
Comment Search Results
Search for wattsupwiththat.com
Comments matching the search wattsupwiththat.com:
- Climate Science Denial Explained
MA Rodger at 18:20 PM on 14 March, 2023Foster @11,
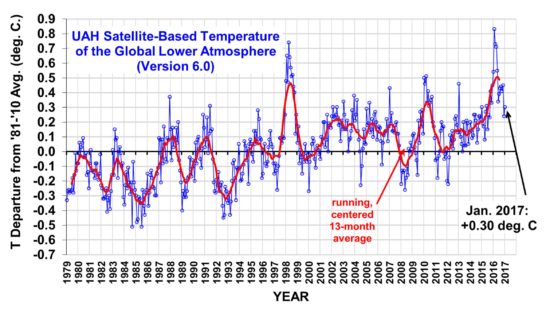
The crux of this latest nonsense from our chum Anthony Willard Watts is to plot out global average temperature using a very long Y-axis so it appears as a flat line.

This is rather reminiscent of the 'thin red line' of aging climate-change-denying climatologist Dickie Lindzen who would plot the size of AGW-to-date onto a graph of annual max-min temperatures in Boston (where he worked) using the width of a red line.
Lindzen would then make some nonsense statement about the planet's average temperature always wobbling by several tenths of a degree at virtually all timescales (which isn't correct). At a presentation in the UK Houses of Parliament back in 2012, he candidly put it thus:-
Changes in the order of several tenths of a degree are always present at virtually all time scales. And obsessing on the details of this record is more akin to a spectator sport for tea-leaf reading than a serious contributor to scientific efforts.
Say, at least so far: if some day I should see some changes of twenty-times what I've seen so far, that would be certainly remarkable but nothing so far looks that way.
So this so-called climatologist suggests a global temperature change of twenty-times 'what he's seen so far' is when climate change becomes "remarkable". Call that 20 x 1.5ºF=+30ºF=+16ºC. I think the word "uninhabitable" would have been a more appropriate adjective.
- Climate Science Denial Explained
Foster at 00:36 AM on 14 March, 2023Hi All! First post here but I came across a blog (anti climate change blog) called What's Up With That by Anthony Watts who made a recent post trying to disprove NASA GISS chart.
Here is a blog post: https://wattsupwiththat.com/2023/03/12/new-wuwt-global-temperature-feature-anomaly-vs-real-world-temperature/
What do you all make of it? Curious to hear your thoughts. Thanks! :)
- Record snowfall disproves global warming
MA Rodger at 08:07 AM on 23 December, 2022JoeT @8,
Most internet references to the Viner comment appear to cite an article in the Independent of 20/3/00 but the links to this article yield "page not found". But for the curious, a PDF of the article has been preserved by the denialists on the rogue planetoid Wattsupia. Note the later Viner quotes in the artiucle.
"Heavy snow will return occasionally, says Dr Viner, but when it does we will be unprepared. "We're really going to get caught out. Snow will probably cause chaos in 20 years time," he said."
- SkS Analogy 1 - Speed Kills: How fast can we slow down?
nigelj at 07:48 AM on 20 February, 2022For information. "Review of Seim and Olsen paper: “The influence of IR Absorption and Backscatter Radiation from CO2…”
wattsupwiththat.com/2021/04/18/review-of-seim-and-olsen-paper/
Comprehensively debunked on WUWT. If those guys are debunking the paper it must be incredibly bad! Not sure why Santilves couldn't find this review because it only took me a few seconds. I wonder if he will argue with the review, or move on and just go onto dumping more junk science onto this website?
I think hes a hard core denialist like I originally stated. He mostly doesnt address specific points people raise. He uses all the usual denialist arguments one after the other. Perhaps he could tell us in unequivocal language what aspects of the AGW issue he accepts? What would change his mind? But no, we will probably just get another flood of denialism.
Time to disengage with him. He has all the factual information he needs. People here have done their bit. If he wont accept it that is his problem.
- CO2 effect is saturated
aoeu at 00:46 AM on 28 October, 2020To whom may be interested,
I've recently come across this physics study after running into it from this article.
The study's demonstrating the saturation argument with respect to thermal radiative flux from the earth to outer space when compared to varying CO2 and water vapor concentration, effectively countering the Greenhouse Effect argument being proposed in this page.
- Is Nuclear Energy the Answer?
Preston Urka at 14:02 PM on 4 September, 2020@217 - here are examples of plant costs vs system costs
Feb 2016 - re-dispatch-costs-german-power-grid
Some researchers argue that new north-south connections would never have enough capacity to absorb the growing wind power generation in the north and the decreasing conventional capacity in the south – where many nuclear power plants will go offline in the next seven years.
Question: Why are these costs not allocated to the cost of Wind? Nuclear, as above, does not need these transmission lines. Wind (as a plant) costs less. Wind (as a system) costs more.
Feb 2019 - German grid firms see extra costs to meet renewable power target
Total spending of 70 billion to 79 billion euros over 12 years would be shouldered by consumers via higher grid fees, which account for about a quarter of their electricity bills.
Between a quarter and half of power demand in southern Germany will have to be met by renewable generation in the north, where plants now generate double the north’s needs.
Observation: If Germany were using nuclear in the south, the transmission would not be built (saving the 70-79 billion Euro); and excess wind would not need to be built in the north (i.e. a higher return on assets).
July 2019 - just 35 wind turbines were build with an output of 231 megawatts in 6 months
Hardly any new wind turbines were built in Germany in the first half of the year. Turbine makers call it a “punch in the gut of the green energy transition” and blame environmentalists.
Just 35 wind turbines were build with an output of 231 megawatts. ... "a decline of 82 percent"
But when in 2021 thousands of wind turbines come to the end of the 20-year subsidy period of the Renewable Energy Act, more wind turbines will be demolished on balance than new ones will be added, the wind industry fears.
Observation: Environmentalists don't like wind now and the wind industry needs enormous subsidies or they will take their marbles home (my sparring partners on SkS firmly disapprove of subsidies).
michael sweet/MA Rodger, did not one of you mention how fast, fast, fast the wind industry is and how it is only growing? - I take the decline of 82% wind, not as the fault of wind, and not due to the success of nuclear, but as proof of the value of the incentives governments set up. If the market favors wind, wind will be built. If the market favors nuclear, nuclear will be built. The difference is, at the system level, nuclear has been empirically been shown to reduce carbon emissions. Wind has only been shown to do so at the plant level, and Jacobson and his fellow travellers extrapolate that to the system level.
August 2019 - Grid expansion in is gaining, but not enough for intermittent RE
... the integration of renewable energy is improving. [However, _coal_ (note Preston addition)] power stations in southern Germany, which remain unused during the summer months, are recommissioned in the winter.
The commissioning of the Thüringer Strombrücke ... has helped significantly relieve the pressure ... 190-kilometer-long .... 5 gigawatts (GW) ........ However, this has not done much to reduce the overall costs of the grid interventions.
[TSO] estimate that by 2030, the price tag on grid expansion will clock in at 62.5 billion euros.
But when the last nuclear power plants are taken off the grid in late 2022, the north-south divide in generation capacity and electricity consumption will become even more pronounced than before. The Federal Network Agency estimates that demand for reserve capacity will then reach a record high of 10,647 MW.
... authorities have ... prohibited ... decommissioning of 27 power stations. The operators [want to retire] 110 plants ,,, capacity of 22,000 MW ... because ... operation is no longer financially viable.
Question:
- Why are these costs not allocated to the cost of Wind? Wind drives it (or lack of wind) and
- Do you begin to see the scale of support for Wind?
- 110 assets are useless, but authorities want at least 27 dud assets kept - it is not because Wind is so great!
- Do you see that the operators can't support costs when politicians confuse marginal and average costs?
- Even a 5 GW transmission line (yes, that is a truly big one!) does not reduce costs much.
- Do you see the Germans could avoid a) the cost, and b) the coal if they just kept the nuclear plants open?
- YouTube's Climate Denial Problem
MA Rodger at 18:17 PM on 12 April, 2020Duncan61 @34,
You ask about "Sea level due to ice melting and warming expansion" adding "some claim it is happening and provide data, some claim there is more ice and provide data."
The increase in sea level due to melting ice and warming oceans is easy to demonstrate.
So I would suggest that the "claim there is more ice" is the point needing examination. You say these "some ... provide data." While I could find some contrarian website with articles attempting to set out such claims (eg here), these may not be what you are looking at. So could you provide a link or two containing the claims you're talking about?
- Ice age predicted in the 70s
MA Rodger at 23:56 PM on 26 December, 2019Dave Evans @84,
The Wattsupian nonsense from Nov 2018 you ask about doesn't appear to have been de-bunked but the major slight-of-hand employed by the denialist-&-nonsense-author Angus MacFarlane has been de-bunked by SkS.
The Nov 2018 nonsense purports to itself de-bunk Peterson et al (2008) which is the main evidence base for the OP above. [The co-authors seem to have been overlooked by the OP above who call it Peterson 2008.] In directly challenging Peterson et al, the Wattsupian denier reclasifies 20% of the surveyed papers cited by Peterson et al (14 of the 66 re-assessed with 5 Peterson et al citations not assessed) and thus attempts to convert the result from 7 'cooling', 20 'neutral' and 44 'warming' into 16 'cooling', 19 'neutral' and 36 'warming'. This is not greating different and certainly does not support the contention that there was a scientific global cooling concensus during the 1970s.
To provide more fire-power, the Wattsupian denilaist adds extra citations to the survey - two which he found for himself (again not a level of evidence that would change the Peterson et al result) and an additional 117 papers gleaned from an earlier denialist attempt to debunk Peterson et al. It is only with this extra denialist fire-power from 2016 that anything like the number of citations can be obtained to overcome the Peterson et al result. This 2016 nonsense has been debunked in a two-park SkS post here & here.
The general nonsense in this 2016 denialist blather is possible best summed up by the denialistical use of the 1974 CIA document which considers the global food supply and within this considers climate as potentially a major factor. Global cooling is presented as a potential increase in risk to an adequate global food supply. There is no 'consensus' being waved that global cooling is expected. Instead they cite HH Lamb but ignore Lamb's view at that time in the mid-1970s that "On balance, the effects of increased carbon dioxide on climate is almost certainly in the direction of warming but is probably much smaller than the estimates which have commonly been accepted." As this may sound itself a little 'denialist' to modern ears, I should all that the 1977 book containing this quote had added into its 1984 preface:-
"It is to be noted here that there is no necessary contradiction between forecast expectations of (a) some renewed (or continuation of) slight cooling of world climate for some years to come, e.g. from volcanic or solar activity variations; (b) an abrupt warming due to the effect of increasing carbon dioxide, lasting some centuries until fossil fuels are exhausted and a while thereafter; and this followed in turn by (c) a glaciation lasting (like the previous ones) for many thousands of years.” [my bold]
The evidence-base for the CIA document is set out in its Annex II is based on the work of one scientist, Reid Bryson who did continue to find it beyond his abilities to accept the idea of AGW as a problem that needed tackling. So even though the 1974 CIA document runs with global cooling, a worst-case scenario, there is no scientific consensus backing it up.
The other study cited by the 2016 nonsense is Stewart & Glantz (1985) which talks of an emerging AGW-warming consensus but itself analyses the conclusions of a 1978 study on climate projection to the year 2000. This 1978 study would presumably have been advised by any 'cooling' concensus had such a thing existed in the mid-1970s. So their conclusions will be of interest:-
"The derived climate scenarios manifest a broad range of perceptions about possible temperature trends to the end of this century, but suggest as most likely a climate resembling the average for the past 30 years.- Collectively, the respondents tended to anticipate a slight global warming rather than a cooling. More specifically, their assessments pointed toward only one chance in five that, changes in average global temperatures will fall outside the range of -0.3°C to +0.6°C, although any temperature change was generally perceived as-being amplified in the higher latitudes of both hemiipheres."
So here the 1970s view was more towards 'warming' than 'cooling' although I note the 'warming' opinion prevailed as warming 1975-2000 was +0.5°C.
And today we see nothing but blather in that Nov 2018 Wattsupian whittering. It is ever thus there on the remote planetoid Wattsupia.
- Skeptical Science New Research for Week #40, 2019
nigelj at 06:53 AM on 10 October, 2019markpittsusa @3, thank's for the comment. Now you mentioned the market sets the discount rate, yet a simple search on this issue shows economists 'choosing' a discount rate related to the climate issue, so I'm not sure what to make of your statement, other than to say it sounds like you are wrong. The following is most interesting. Its from WUWT which is not my preferred source of information, but is worth listening to in this instance. In summary its clear the discount rate can be chosen, and Nordhaus discount rate is too high according to numerous economists.. Make sure you read all the excerpt I have copied and pasted.
wattsupwiththat.com/2019/01/04/is-nordhaus-discount-rate-really-too-low/
(excerpt) "In reference to the co-winner of the 2018 Sveriges Riksbank Prize in Economic Sciences in Memory of Alfred Nobel, the earlier WUWT article states that “Dr. Nordhaus’ model suggests a ridiculously low discount rate of about 2.5%”. This critique is motivated by comparison with the rates of return offered by fixed income securities (“The minimum discount rate is currently usually 3%, about what you can get in US 30-yr Treasuries”) and other corporate rates (“In the oil & gas industry, we use a 10% discount rate when valuing proved reserves”). Using a higher discount rate would lead to a lower Social Cost of Carbon, meaning that fewer mitigation initiatives would receive policy support.
"My co-authors and I have recently published (Drupp et al., 2018) the results of a survey of almost 200 economists who have expertise in intergenerational social discount rates (discount rates to be used by governments when, for example, determining climate change policy). From this we can conclude that, as far as most economists in the field are concerned, Nordhaus’ rate is too high and not too low."
"First, it is important to note that the 2.5% rate that is attributed to Nordhaus in the earlier WUWT article is a growth-corrected discount rate, which “equals the discount rate on goods minus the growth rate of consumption” as given in the caption to the figure in that article. For a non-growth-corrected rate, Nordhaus recommends a much higher value. In a related article he states that “I assume that the rate of return relevant for discounting the costs and benefits of climate-sensitive investments and damages is 5% per year in the near term and 4.5% per year over the period to 2100” (Nordhaus 2014, p.280). Yet in our survey, the median response from our participants for the appropriate very long-term social discount rate is just 2%."
The following are also higly relevant and discuss problems with Nordhaus's approach in general, and rather high discount rate. The third article is by Thomas Picketty:
liu.se/en/news-item/liu-forskare-riktar-skarp-kritik-mot-ekonomipristagare
www.nytimes.com/2006/12/14/business/14scene.html
theconversation.com/thomas-piketty-climate-change-and-discounting-our-future-30157
Clearly Nordhaus is but one economist and it would be unwise to rely on the views of but one economist regardless of what prizes he has won.
- Millions of times later, 97 percent climate consensus still faces denial
MA Rodger at 20:27 PM on 18 August, 2019Postkey @14,
While Monckton continually lays on the bunkum, his grand work Monckton, Soon, Legates, Briggs, Limburg, Jeschke, Whitfield, Henney & Morrison (2018-unpublished) 'On an error in applying feedback theory to climate' surely demonstrates the apex of his incompetence. (I should mention that some of the many co-authors may be unaware of their co-authorship.) According to the write-up on the planet Wattsupia, Monckton's grand work was supposed to set out how:-
1. It can be proven that an elementary error of physics is the sole cause of alarm about global warming – elementary because otherwise non-climatologists might not grasp it.
2. It can be proven that, owing to that elementary error, current official mid-range estimates of equilibrium sensitivity to anthropogenic activity are at least twice what they should be.
Monckton's bunkum certainly goes beyond incompetence, but Monckton's grand work takes it to a new mind-numbingly high level.
- Increasing CO2 has little to no effect
youjaes at 21:57 PM on 16 August, 2019I'm looking at the comments and wondering about what I think are obvious things.
1. The 800 year CO2 lag should indicate that CO2 isn't driving temperature.
2. If increased CO2 raises temperature, what is causing the subsequent temperature crashes since CO2 is still elevated?
3. If you can't measure greenhouse gas effects with 'back yard' science experiments, what makes anyone think there is an effect in the first place? Yes, CO2 is a 'greenhouse gas' where people add over 1000 ppm of CO2 to help the plants grow. Apparently that much additional CO2 isn't noticably changing the inside temperature, so why would a 100 ppm change in the atmosphere have any measurable change in planetary surface temperatures?
4. There is another reason why surface temperatures can increase, specifically, reductions in surface wind speeds, which is occuring. Here is a report complaining about it.
https://wattsupwiththat.com/2018/12/05/study-global-wind-speed-dropping-wind-farms-victim-of-atmospheric-stilling/
- Climate's changed before
MA Rodger at 19:35 PM on 23 July, 2019TVC15 @760/761,
It is a smorgasbord of denialist assertions you present.
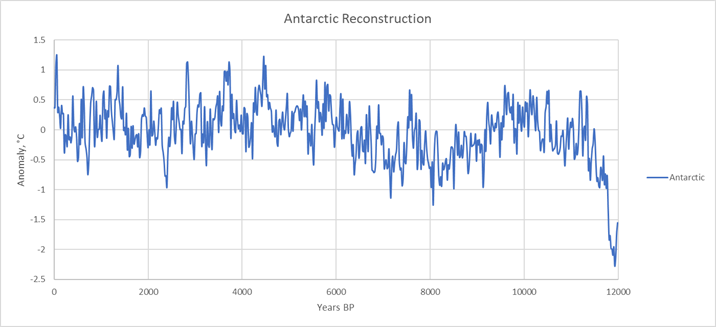
☻ The "Antarctic was warmer 1,000 years ago" assertion looks a little difficult to uphold in any way. There are reconstructions from ice core data (for instance Ciais et al (1994) fig 7) which shows Antarctic temperatures over the last 10,000 years waggling about by a maximum of about a degree centigrade. (Note the Ciais et al graphic is sensibly using an 'average-over-the-last-5,000-years' as a datum.) The thermometer record (eg Berkeley Earth) shows recent warming of a similar amount (although there is a lot of variability in the warming depending where you are in Antarctica) so this evidence suggests it was colder in Antarctica 1,000 years ago. The image below is gleened from a posting on the planet Wattsupia and appears to be based on data from Marcott et al (2013). The 1,000 years ago temperature again is shown as being colder.
☻ The interglacial sea level has been discussed before, introduced up-thread @715. It was shown that only two of the last 8 interglacials had higher SLR than today, not all eight. The SLR will mainly depend on how much of Greenland & Antarctica melts out, a process that stopped in this present interglacial 8,000 yers ago, and AGW is the process that is doing that melting today.
☻ The "Earth is always warmer and wetter, never warmer and drier" assertion isn't correct. The missing word word is 'atmosphere' which will be, as scaddenp @765 points out, wetter under the CC relationship. So if we have more wet in the atmosphere, will that translate firstly into more rain always falling on the earth beneath. Globally apparently not. This NOAA graphic shows global temperature and global rainfall are not well aligned. (The graph is from here and is for precipitation over global land)
And secondly, as scaddenp @766 describes, even if rain and temperature were inexorably linked, that warmer atmosphere is demanding to be always wetter than it was when cooler and will thus be sucking more moisture right out of that very same land to re-charge its wetness.
- Arctic sea ice has recovered
gsmakin at 03:57 AM on 30 March, 2019MA Rodger: Yeah, the first bit you quote is a summary of the locations from which the data across all three of the referenced papers was derived (Stein, Yamamoto and Moffa-Sanchez). Maybe I was overly broad.
As to the "opposing arguments" section I'm not here referring to the studies themselves but rather to the blogger's presentation and the manner in which he intends his audience to imbibe it. To quote from said blog:
"Further to NOAA’s claim that Arctic sea ice extent is at its lowest for at least 1500 years, Kenneth Richard highlighted three studies last year that show the claim to be bunkum."
The clear intention is to erode confidence in the NOAA findings by presenting a series of graphs which depict a "present" with much more arctic sea ice than at multiple points in the past (not just the Holocene Thermal Maximum). Presented in that way the author clearly seeks to reverse the alarm that the NOAA graph must surely cause by depicting its cliff face as a little kink in otherwise wildly undulating trend lines.
At least that's the way I saw it.
- Arctic sea ice has recovered
gsmakin at 20:05 PM on 29 March, 2019Philippe Chantreau: The graph in the blogpost Lowisss13 linked to:
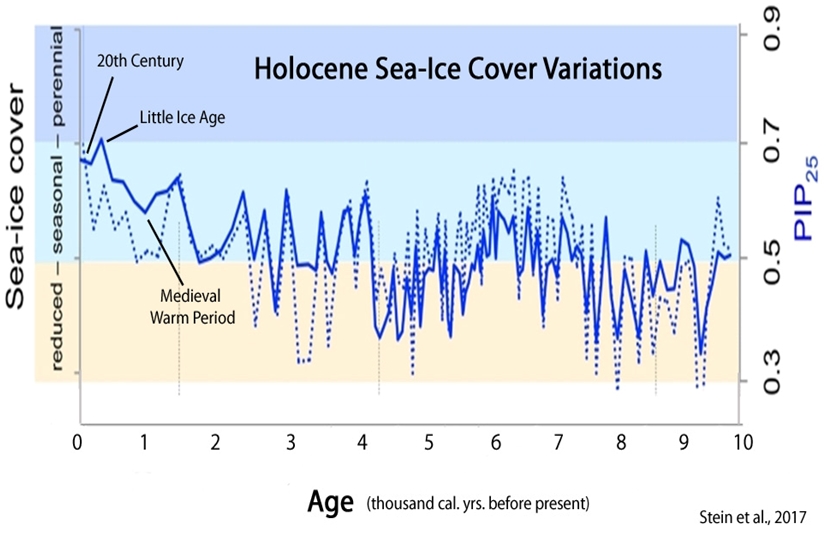
seems to be derived from this graph from the Stein study (figure 6, rightmost):
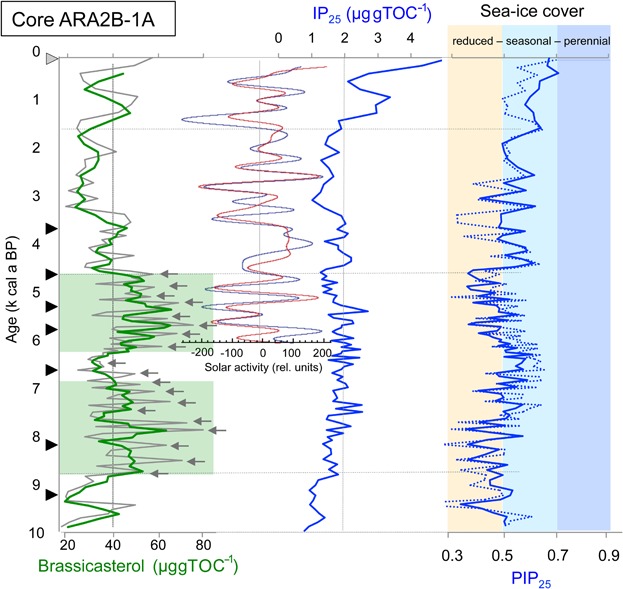
https://onlinelibrary.wiley.com/doi/full/10.1002/jqs.2929
That blog also references two other studies which it claims contradict the NOAA finding: Yamamoto et al (2017) and Moffa-Sanchez & Hall(2017). The graphs the blogger uses are derived from Yamamoto (figure 8, pg 1121) and Moffa-Sanchez (figure 2) respectively.
In total these findings appear to cover the Chukchi Sea, East Siberian Sea and Eastern Labrador Sea and to be fair do seem to detail periods of the last 10k years when these areas had far less ice than today.
My question is rather simple: do these studies contradict the NOAA findings or are they easily explainable as regional variations consumed by a much greater overall trend?
I ask not as a skeptic but as someone who lacks the necessary expertise to interpret such studies with any degree of confidence.
- Global warming theory isn't falsifiable
scaddenp at 07:20 AM on 25 March, 2019The myth has been stated in various forms by deniers. Usually when something they thought would be inconsistant with theory (like more snow) turns out to be a prediction or understanding that model skill is not a test for underlying theory. Some examples from the usual suspects:
https://www.cato.org/publications/commentary/chimera-global-warming - Venus doesn't have a runaway greenhouse effect
MA Rodger at 18:59 PM on 5 October, 2018JC @230.
"The giec" is usually known by its English acronym 'IPCC' and indeed the IPCC AR5 Technical Summary does include Box TS.3 'Climate Models and the Hiatus in Global Mean Surface Warming of the Past 15 Years.' This analysis dates to 2013 and thus predates Karl et al (2015) which rattled a number of 'artifacts' from the global surface temperature record and with it became an undeniable 'pause-buster' in the eyes of AGW-denying contrarians. And Box TS.3 will obviously not have been able to include in its analysis the last five years of global surface temperature (2014-18) which will soon become shown to comprise each of the warmest five years on record. Thus, if there were (as asserted by JC @222) some "stagnation of steam from 2000 to presently," it would not provide a "correlation" with global surface temperature which has been far from stagnant since 2000.
- Explainer: The polar vortex, climate change and the ‘Beast from the East’
MA Rodger at 21:36 PM on 16 March, 2018Jonbo69 @3,
I would suggest there is a vast level of complexity in what you ask but it can be knocked into shape.
The complexities of Polar Vortex-Solar Minimum linkage has been utilised by some denialists to create anti-AGW messages. So, for instance, this post at denialist site TheHockeySchtick rests on three published papers which are not entirely relevant or conclusive or credible.
Such denialist posts are often response to messages linking intense cold snaps of winter to our planet's atmospheric circulations that are evidently being impacted by AGW. Thus the likes of this report of an AAAS meeting results in the deniosphere responding with the likes of this nonsense at the planet Wattsupia.The complex variability of the Polar Vortex is in no way solely associated with solar output. Indeed, it is a relatively minor player. Thus Kim et al (2014) add the helpful concluding comment with solar activity the tail-end-Charlie of the list of possible factors:-
"(N)ote that Arctic sea-ice loss represents only one of the possible factors that can affect the stratospheric polar vortex. Other factors reported in previous works include Eurasian snow cover, the Quasi Biannual Oscillation, the El-Nino and Southern Oscillation and solar activity. Systematic consideration of these factors would extend our understanding of climate variability, possibly leading to the improved seasonal forecast Nonetheless, the relative contributions of each factor have not been systematically examined. As these factors may be interrelated, they may not control the stratospheric polar vortex independently. These issues must be examined further in future works.
Linkage between Polar Vortex and Solar Minimum is more a subject of research (eg Maycock et al (2015), Chiodo et al 2016) because the regional impact of Grand Solar Minimums is missing from the standard climatological assessment. Yet these papers make no startling claims and are setting the solar-minimum-effects within future AGW which is probably why denialists wouldn't dream of touching them with a barge-pole.
- Polar bear numbers are increasing
bruce at 17:32 PM on 20 December, 2017Michael Sweet says about Dr Crockford "No sign of expertise in polar bears"
From Dr Crockfors's letter to the AIBS.
"I am a professional zoologist with a Ph.D. and over forty years of experience and dozens of peer-reviewed papers on various topics, and also fails to mention that I have recently published a detailed academic critique on the issue of polar bear conservation status."
"...my Ph.D. dissertation on speciation included polar bears"
"In addition to my dissertation that features polar bears, I have an article on evolution in a peer-reviewed journal in which polar bears are prominently featured (Crockford 2003), and two official comments, with references, on polar bear hybridization (which is how official responses to published papers are handled in these two journals). I also have a paper in a peer-reviewed book chapter on ringed seals, the primary prey of polar bears (Crockford and Frederick 2011), and a peer-reviewed journal article on the paleohistory of Bering Sea ice, the habitat of Chukchi Sea polar bears (Crockford and Frederick 2007)."
According to http://wwf.panda.org/what_we_do/where_we_work/arctic/wildlife/polar_bear/population/
polar bear numbers are 22-31,000.
From the literature I've read no-one seriously disputes they are currently in decline but computer models say they are threatened by future climate change.
Michael Sweet said
"She is paid a monthly retainer from the Heartland Institute."
But she says...
I am not “linked with” nor do I “receive support” from The Heartland Institute or any other corporate-funded think tank.
either Michael Sweet or Dr Crockford is lying.
- California's hellish fires: a visit from the Ghost of Christmas Future
michellem8082 at 09:13 AM on 13 December, 2017It's way too easy to make either sweeping AND/OR anecdotal judgments. "All states were impacted"? How about "directly impacted"? Colorado has had wonderful weather this year and we chose to enjoy it. Our drought went through its' cycle a couple of years ago. It's anectodal, but the game you've chosen to play here.
It's a bit strange that California is getting picked on with the fires. Anectodal. I would look at El Nino, permaculture, and regulatory policies. Unless you take these steps, you are chasing after the wrong problems, therefore not solving anything and likely making matters worse by missing the best courses of action; perhaps on a case-by-case basis even.
There truly is significant and legitimate other-side science out there with undisturbed data and findings that CO2 is not the problem, extreme weather events are on the decline, polar bear population is now up, ice mass at one of the poles is up, the planet is 14% greener overall, etc. The claimed ocean levels rise was reported just today as having corrupt data. There are also at least 2 email chain discoveries over the past couple of years that point to corruption on a very large scale. As long as people continue to ignore these, you remain part of the problem.
There has been an almost laughable number of reports come out about too much rain, not enough rain, less but more frequent rain, etc. in just the past few months.
There are numerous reports and studies from CA ecologists that their land management advice is being ignored by state policy.
Scientists have been coming out of the woodwork since Trump got in less afraid of getting fired for daring to uphold their own integrity in science. But widespread policies like the LA Times not accepting any more dissenting views (as if this were a vote situation) and you remain uninformed of all the over 400 new reports that have come out just this year refuting the AGW claim.
Climate Change, yes. CO2/AGW, no.
This is Amerca and I sincerely invite all to engage in civil, open conversation. That's the ground that has been laid out in this country once upon a time. Think of the pearl that gets more beautiful (and valuable) from the "rub".
There's a spiritual tenant that evoking change via force, shame, guilt, and tyranny rarely secures enduring change. Also, to make generalizations over an entire group is the very definition of bigotry, btw. We keep repeating the same mistakes over and over with this kind of thinking.
The most succint case for "the other side science" is below by a climate physicist with credentials up the wazoo: http://edberry.com/blog/ed-berry/human-co2-not-change-climate/
On this site you'll get a taste for the numerous other scientists, their credentials and findings.
Here is a site where you can keep up with the latest updates from both sides: https://wattsupwiththat.com/2017/12/11/population-growth-and-the-food-supply/
Onward and upward...
- The Mail's censure shows which media outlets are biased on climate change
MA Rodger at 01:17 AM on 29 September, 2017Eclectic @34,
You say you have examined the history of Judy's little asteroid Climateetc but that was not the start of her journey to the dark side. A lot of stuff preceded the creation of Climateetc in Sept 2010 but, as with much else, Judy has her own take on the journey she took. Her version of it is set out at the start of her 2015 Senate testimony:- (PDFp39)"Prior to 2009, I felt that supporting the IPCC consensus on climate change was a responsible thing to do. I bought into the argument don’t trust what one scientist says, trust what an international team of 1,000 scientists have said after years of careful deliberation.
"That all changed for me in November 2009, following the leaked ‘‘Climategate’’ e-mails that illustrated the sausage-making and even bullying that went into building the consensus. I started speaking out, saying that scientists needed to do better at making the data and supporting information publicly available, being more transparent about how they reach conclusions, doing a better job of assessing uncertainties, and actively engaging with scientists having minority perspectives.
"The response of my colleagues to this is summed up by the title of a 2010 article in the Scientific American, ‘Climate Heretic: Judith Curry Turns on Her Colleagues.' I came to the growing realization that I had fallen into the trap of group think. I had accepted the consensus based on second-order evidence, the assertion that a consensus existed."This seems to suggest that in the two days following Climategate, Judy went from happy-bunny climatologist to happily posting on denialist websites like Wattsupia (a re-post from ThinkProgress but Wattsupia is the version she links to here) and denialist Climate Audit, the place she tells us "became my blog of choice, because I found the discussions very interesting and I thought, ‘Well, these are the people I want to reach rather than preaching to the converted over at [the mainstream climate science blog] RealClimate.’” That's a big big shift in just two days, Judy! Almost as abrupt as the next leap to full denialist in the following year, assuming you go along with Judy's timeline.
The story actually begins in 2005 with Webster et al (2005) 'Changes in Tropical Cyclone Number, Duration, and Intensity in a Warming Environment' which was published just as the 2005 hurricane season was making hurricane studies highly political. So the paper drew a lot of denialist flack from contrarians to which Judy found herself responding (being a co-author) and was still providing expert hurricane testimony in July 2006. She was also the lead-author on a paper addressing the scientific argumentation of hurricane studies (although note that while the article is described here as "unapologetic in advancing their particular point of view", the article is actually setting out its scientific position as being no more than "the central hypothesis."
But there are then the first signs in 2006 of Judy falling out with her scientific colleagues but over the narrow issue of how to treat with denialists. We find Judy commenting at what would become her "blog of choise" ( eg. about halfway down this 2006 thread where she would soon earn her posting rights). Also in 2006, she was talking on the need for engaging with denialism which heavily hints at her future path. This 2006 talk was tellingly titled "Falling Out of the Ivory Tower" and bullet points included ♠ inadequate assessment and communication of uncertainty ♠ turf battles and appeal to authority ♠muddy relationship between climate research and policy. It can thus be seen that Judy was already engaging with her "group think" monster by 2006, years before 'climategate'.
Her immediate response to 'climategate' (in web-pages linked above) was to advocate openness so denialists can spot any errors allowing (apparently) corrections to be made with minimum fuss. "Doing this would keep molehills from growing into mountains that involve congressional hearings, lawyers, etc." while she says she isn't implying "climate researchers need to keep defending against the same arguments over and over again." (I would agree with this last point as they would instead have to 'keep defending against the same arguments over and over & over & over & over & over again, ad nauseam.')
And by mid-2010 our Judy had become one of her own "scientists having minority perspectives" becoming an uncritical conduit for denialst argument and thus unable to connect with her peers (as her input into this July 2010 RealClimate comment-thread well demonstrates).
Two months afterwards she had her little un-worldly asteroid Climateetc to retreat to, where she could cultivate her persona as The Daily Mail climate scientist of choice.
Tapping this out, I was surprised to read in that article critical of Judy which she cited in her testimony that:-"Curry asserts that scientists haven’t adequately dealt with the uncertainty in their calculations and don’t even know with precision what’s arguably the most basic number in the field: the climate forcing from CO2 —that is, the amount of warming a doubling of CO2 alone would cause without any amplifying or mitigating effects from melting ice, increased water vapor or any of a dozen other factors."
Question- Is that right? Has she fallen that far into the denialistic pit to consider this a substantive issue. Answer - She certainly had back in Dec 2010.
- Temp record is unreliable
Mike Evershed at 02:14 AM on 1 August, 2017Thanks to moderator TD, Scaddenp, and Michael Sweet for replies. I have looked up moderator TD's references. But the problem I have is not whether individual adjustments, or homogenisation techniques are reasonable. Nor do I worry that there has been fraud on the part of climate scientists (though I suppose that is possible - scientists being human). Nor do i think that reverting to raw data would be better. My point as someone who is scientifically trained is that the more adjustments we make and the more data transformations we perform the greater the risk we run of making errors. Also, and more seriously, the more choices we make about which adjustments to apply, and how to apply them, we increase the risk of something called "confirmation bias". (The basic idea of confirmation bias is well known and adequately described in wikipedia - so I hope I may be excused providing a reference). So for me the most important point made in the replies is Michael Sweet's: i.e. that the adjustments of the old records have resulted in "a substantial lowering of the amount of warming." Does anyone reading this know where I can find the published scientific data on this - particularly in the surface air temperature? I have seen claims made both ways: leaving Humlim aside I have also seen this: https://wattsupwiththat.com/2016/04/24/updated-do-the-adjustments-to-land-surface-temperature-data-increase-the-reported-global-warming-rate/
- Surrendering to fear brought us climate change denial and President Trump
MA Rodger at 06:42 AM on 20 July, 2017thoughts @46.
Your response to me seems to be saying that you consider the work of Larry Bell who wrote a book (apparently no spoof) entitled "Climate of Corruption: Politics and Power Behind the Global Warming Hoax" as being in your view entirely credible. Do note I do not here "engage in a discussion of these issues" set out by Larry, but they are entirely ludicrous. That you consider such nonsense credible strongly suggests that in SkS you have come to the wrong place. You do tell us that you "understand how to exercise critical thinking" but for myself, a bit like your reluctance to accept AGW, I am reluctant to accept your claim as see no evidence of your "critical thinking."As for my enquiry @45, that 5-year-old Wattsupian web page may contradict "the information given on this site" (and I'm sure that is very important to you) but that doesn't make it any less nonsensical than the work of Larry. Note that if it were a useful analysis, where is it now? Oh yes! It's still buried in a 5-year-old Wattsupian web page.
- Surrendering to fear brought us climate change denial and President Trump
thoughts at 00:43 AM on 20 July, 2017To possibly explain why "deniers" are still puzzled about the truth of AGW, here is another link:
https://wattsupwiththat.com/2012/12/07/a-brief-history-of-atmospheric-carbon-dioxide-record-breaking/
- Models are unreliable
SemiChemE at 15:00 PM on 13 March, 2017I'm new here, but here's a quick intro, I'm a chemical engineer with approximately 20 years experience in the semiconductor industry. A significant portion of that time involved computational fluid dynamics (CFD) modeling of reacting flows. Thus, I'm quite familiar with the capabilities and limitations of CFD models. All GCMs are at heart, large-scale CFD models.
@1003 - The video gives a nice overview of the climate models for the layman, but I can't help but think the scientists are downplaying many of the model limitations.
Yes, for most of the phenomena of interest the basic physics are pretty well understood, but to model them on a planetary scale, gross simplifying assumptions must be made due to computational limitations. The skill of the model is intimately tied to the accuracy of these assumptions and that is where the model can easily go astray.
Dr. Judith Curry gives a pretty good summary for the layman of some of the most salient model limitations in an article linked here:
https://wattsupwiththat.com/2017/02/21/curry-computer-predictions-of-climate-alarm-are-flawed/
The bottom line is that while some of the approximations are extremely accurate, by necessity the models for some processes are quite crude. This latter set, varies from model to model depending on the specific model purpose and is one reason for the spread in reported model results. It is these crude approximations that ultimately must be tuned to fit the available data, but with such tuning comes the ever present risk of getting the right answer for the wrong reason, in which case there is no guarantee that the model will be useful for future predictions.
If we had several earths to experiment on, we could run multiple experiments with different forcing conditions and sort out the various contributions of different effects, but since we have only one earth, we don't have any way to completely distinguish the impact of the various forcings (eg. CO2 levels, solar radiation, cloud formation, SO2 and aerosols, Natural variability, etc...) from each other. This means we have to make educated guesses about the various sensitivities. Over time, these guesses will get better, as we get more data to compare them to and we better understand the various sources of natural variaton (eg El Nino/La Nina).
However, at the moment, we really only have about 40 years of reliable, high-density data (the satellite era) and we're trying to decouple the impact of increasing CO2 from a natural variability signal that also seems to have a 30-60 year period. Dr. Curry contends that the due to such factors, the IPCC has over-estimated the sensitivity of the climate to CO2, possibly by as much as a factor of two.
If true, this means that climate change will happen much more slowly and to a lesser degree than originally predicted.
- Correcting Warren Meyer on Forbes
Tom Curtis at 02:37 AM on 12 March, 2017Eclectic @31, Steven Mosher, as much as anyone, has a right to define the term, "luke warmer". And he has done so at WUWT:
"Over the years a few of us have worked to define what we mean by Lukewarmer and what defines the position.
1. Acceptance of radiative physics.
2. Acceptance of a lower bound to sensitivity. basically the no feedback estimate is 1.2C per
doubling. We think that the true sensitivity will be above 1.
3. over/under line. The over under line is 3C. That is, if offered a bet that the climate sensitivity
is either ‘between 1 and 3 or over 3, we take the under bet.ballpark:
less than 1.2 5%
1.2 to 3. 50%
3 to 4.5 45%
4.5+ 5%So if you believe that GHG can warm the planet and not cool it, and you think that the mean estimate of the IPCC of 3.2 is more likely high than low, then you are a lukewarmer. But you have to drop the crazy refusals over radiative physics."
In contrast, Meyer wrote:
"Not only may the feedback number not be high, but it might be negative, as implied by some recent research, which would actually reduce the warming we would see from a doubling of CO2 to less than one degree Celsius. After all, most long-term stable natural systems (and that would certainly describe climate) are dominated by negative rather than positive feedbacks."
The suggestion that ECS might be less than one removes Meyer from the Luke Warmer camp. (I have discussed his misrepresentation of the nature of climate feedbacks above.)
- Just who are these 300 'scientists' telling Trump to burn the climate?
ubrew12 at 06:43 AM on 28 February, 2017WUWT has the letter and the list. WUWT says 'The petition contains the names of around 300 eminent scientists and other qualified individuals, including physicists, engineers, former Astronauts, meteorologists ... computer modelling specialists, and many more. It is a long list.'
I got a kick out of the emphatic: 'It is a long list'. But I also appreciated that among the 19 professions identified, none was 'climate scientist'. I guess they didn't want to get sued.
Also, as an American, we get a little rowdy over here when experts from Australia, New Zealand, Europe and Latin America tell our President what to do. We like to think we have enough experts right here to handle our own affairs. It's says a lot that Dr Lindzen couldn't locate more of them to pad his list.
- Correcting Warren Meyer on Forbes
Tom Curtis at 12:13 PM on 21 February, 2017"One more error is, he claims Al Gore states that, "...we will see a tipping point where temperatures will run away, [Gore] is positing that feedbacks will be nearly infinite (a phenomenon we can hear with loud feedback screeches from a microphone)." Nope. Sorry. That is Mr. Meyer's misunderstanding and is nothing that Al Gore has ever stated."
I did a bit of research and managed to find the source for Al Gore's claims about "tipping-points". It turns out to be a conflation of a comment Gore made to CBS news in 2006, and a review of An Inconvenient Truth, by James Hansen.
CBS reported on January 26th, 2006 that:
"And politicians and corporations have been ignoring the issue for decades, to the point that unless drastic measures to reduce greenhouse gases are taken within the next 10 years, the world will reach a point of no return, Gore said.
He sees the situation as "a true planetary emergency.""
You will notice that while the sentiment is Gore's, the initial sentence contains no quotations, and hence no indication that the term "point of no return" was Gore's.
Meanwhile, in his review of "An Inconvenient Truth", Hansen expressed similar views when he wrote:
"Any responsible assessment of environmental impact must conclude that further global warming exceeding two degrees Fahrenheit will be dangerous. Yet because of the global warming already bound to take place as a result of the continuing long-term effects of greenhouse gases and the energy systems now in use, the two-degree Fahrenheit limit will be exceeded unless a change in direction can begin during the current decade. Unless this fact is widely communicated, and decision-makers are responsive, it will soon be impossible to avoid climate change with far-ranging undesirable consequences. We have reached a critical tipping point."
In January, 2016, Anthony Watts published an article by Jaclyn Schiff, which quoted the NBC article, before saying:
"Well, the 10 years are about up, by now, warming should have reached “planetary emergency levels” Let’s look at the data:
...
As you can see, little has changed since 2006. Note the spike in 1998, in the 18 years since the great El Niño of 97/98, that hasn’t been matched, and the current one we are in isn’t stronger, and looks to be on the way to decaying. So much for the “monster” El Niño."
In the space covered by the ellipsis, Schiff published a graph of the UAH TLT temperature through to Nov 2015. Why November, given that the Dec 2016 data was published by Roy Spencer on January 5th, 2016. Perhaps it had something to do with the December values being higher than those of October, hence giving the lie to the claim that the temperatures "looks to be on the way to decaying". Regardless, hindsight shows her claims to be utterly baseless:
Indeed, so also did foresight for anybody aware of the relative delays of surface and mid troposphere temperature responses to ENSO fluctuations.
More important than any shenanigans with out of date temperature data is the complete misunderstanding of what Gore is reputed to have said.
Going back to the original NBC metaphore, a point of no return is that point in a flight, or expedition, were turning around will not leave you with sufficient fuel (or supplies) to return to base. It could also be used of a scenario where you are driving rapidly towards the lip of the Grand Canyon, in which case the point of no return is that point at which no amount of braking, or rapidity of turning will prevent you from going over the lip. In neither case is there any sudden change in your conditions. The point of no return on a flight is not a point of sudden turbulence; and the point of no return as you follow Thelma and Louis to a premature death is as smooth as any other point you had traversed on the trip thus far.
Applying this to Gore's thought, clearly he was saying (whether using that phrase or not) that if radical action was not taken by (approximately) 2016, then we would have reached a point where no economically achievable measures could prevent CO2 concentrations rising sufficiently to cause temperatures to pass the threshold beyond which their impacts are considered dangerous. No sudden jump in temperature is predicted, and nor is it predicted that the temperature increase by 2016 will itself have passed a dangerous threshold.
In any event, Schiff's misunderstanding was then picked up by the deniasphere, with Hansen's term frequently substituted. From there, it was apparently further misinterpreted by Warren Myer.
Ignoring the gross misrepresentations without which deniers have no argument, the question is whether or not we have in fact passed Gore's 'point of no return', or Hansen's "tipping point". The answer is that we do not know. We may have, and if we have not we certainly will do so soon. My feeling is that we have for a 1.5oC increase above the preindustrial, but not quite yet for a 2oC threshold. Unfortunately, whether we have or have not passed it, the actions of Trump in the US, and Turnbull in Australia seem geared to ensure we pass it very soon, if we have not already.
- Temp record is unreliable
pink at 22:40 PM on 11 October, 2016and the point of using old articles and charts is to demonstrate that over time the 'warming' keeps getting adjusted up in latter years and down in earlier years.
This just came out, that animated gif is very disturbing.. it shows that even the satelite graphss are being 'adjusted'
https://wattsupwiththat.com/2016/10/10/remote-sensing-systems-apparently-slips-in-a-stealth-adjustment-to-warm-global-temperature-data/
- There's no correlation between CO2 and temperature
MA Rodger at 19:08 PM on 24 August, 2016Concerning the bogus nature of the Danley Wolfe graphic introduced into this discussion by Victor Gauer (but on the wrong thread).
May I introduce my own graphic of three panels that illustrates the bogus nature of Wolfe's analysis, my graphic linked here (usualy 2 clicks to 'download your attachment')
The top panel reproduces Wolfe's data plot, LOTI (I actually use LOTI as published in May 2014 - what should have been the Wolfe data - it is very close to Wolfe's data and indestinguishable for the data most recent to May 2014) plotted against MLO CO2. Note Wolfe repeatedly says he uses GISTEMP Met Station data but he is obviously wrong. He uses LOTI but adds 14ºC to the values. He calls this "absolute" rather than an anomaly although it is simply the anomaly shifted by 14ºC so not the monthly "absolute" values.
Added to the Wolfe data is the LOTI data for June 2014-to-date as published today. The annual CO2 cycle (unlike the annual LOTI cycle) remains as per Wolfe's plot. Its inclusion has no physical justification, just as retaining the annual LOTI cycle would have no physical justifictaion. Its inclusion is patently wrong.
The central panel plots the same data but adds a trace using 12-month averages for MLO CO2 and a red trace that additionally uses the 12-month averages for temperature. As the rate of increase in CO2 has been rising over the decades, the red trace is effectively the LOTI time series but with the early years squished up and the later years stretched out. The ratio of most-squished:most-stretched is about 1:3. So conpared with the more normal time series plot of LOTI, this CO2-series plot will markedly eccentuate any slowdown in the LOTI record during the later years.
The third panel introduces the trend lines drawn on by Wolfe (the black trace). The flat part of the trend for the later years is not calculated as Wolfe describes. Wolfe's "1998-2014" result can be reproduced (down to the "158 observations") using May 2014 published data and the period 4/2001-5/2014. The other flat trend for the earlier years is undescribed by Wolfe. Importantly, the sloping trend Wolfe shows joining the flat eary section to the flat later section cannot be the result of any analysis. It is probably drawn fancifully simply to connect the top and bottom flat trends. It is entirely bogus.
The yellow trend is the OLS trend for Wolfe's data through the middle part of the data with the narrower yellow lines extending that trend to the ends of the data. The OLS trend for the entirety of Wolfe's data is represented by the white plot and is very little different from the full-length yellow trend plot. It is thus evidently bogus to attempt to argue that there are any periods either at the start or at the end of this data with significantly lower trends. Yet Wolfe does just that!!!
- IPCC admits global warming has paused
victorag@verizon.net at 02:10 AM on 24 August, 2016(My apologies again: the links I provided got lost when I re-pasted this post. Please delete post #4. Thank you.)
For reasons already stated, I will be brief, so as not to waste my time with long explanations that might get edited or deleted. Maybe it's better that way anyhow.
Regarding the difference between "eyeballing" and statistical analysis: there are many ways to manipulate results using statistics, whereas one's eye sees the data directly. Sorry, but where the picture is clearly there for all to see, I'll trust my eye, thank you.
Regarding statistical smoothing:
Smoothing creates artificially high correlations between any two smoothed series. Take two randomly generated sets of numbers, pretend they are time series, and then calculate the correlation between the two. Should be close to 0 because, obviously, there is no relation between the two sets. After all, we made them up.
But start smoothing those series and then calculate the correlation between the two smoothed series. You will always find that the correlation between the two smoothed series is larger than between the non-smoothed series. Further, the more smoothing, the higher the correlation. (From the blog of Dr. William M. Briggs (PhD in Mathematical Statistics))
Tom Curtis at #119: Regarding scattergrams: the scattergram offered by Tom lacks sufficient detail to be very useful. Here's another that does, compiled by Danley Wolfe from raw data available to all at:
Mauna Loa: ftp://aftp.cmdl.noaa.gov/products/trends/co2/co2_mm_mlo.txt
NASA GISS: http://data.giss.nasa.gov/gistemp/tabledata_v3/GLB.Ts.txt
Wolfe does nothing to "massage" his data, it's directly transcribed from the two sites referenced above.
- Most of the last 10,000 years were warmer
Tom Curtis at 09:20 AM on 4 June, 2016Mike Hillis @63, point by point:
1) The quote by Monckton at the head of the article is simply an example of the myth being propogated. It is not, as you suggest, part of an evidentiary chain other than to the point that the myth exists, and is propogated by at least some climate change deniers. What is more, by claiming that it is a fabrication that "the "myth" ... is based on a comment made by Monkton", you imply that Monckton has been misquoted. Following the link for the quote and scrolling down to the second box on page three proves that to not be the case. Monckton was not misquoted. He has used the myth. But the article made no claim that Monckton is the only denier to use the myth, or that he was the primary person to propogate the myth, contrary to your suggestion.
Monckton also explicitly ties his opinion to the GISP 2 record in another document (PDF) where he produces this graph:

He captions it, "Warmer than today: most of the period since the end of the last Ice Age has been
warmer than the present by several degrees Celsius" and writes:
"Seen in the geological perspective of the last 17,000 years, the 300 years of recent warming, nearly all of which must have been natural, for we could not have had any significant influence except in the past 25 years, are manifestly insignificant."
The comment about the 300 years shows clearly that he is treating the terminal period of the graph, which actually ends in 1855, as ending in approximately 1995.
As a side note, he (not unusually) mislabels the source of the data, which is Cuffey and Clow (1997).
2) You also dispute that Monckton got the idea from Easterbrook, but Easterbrook propogated the idea in 2008 (PDF), where he produced this graph the below graph, saying:
"The global warming experienced during the past century pales into insignificance when compared to the magnitude of at least ten sudden, profound climate reversals over the past 15,000 years (Figure 5)"

Again, the graph is claimed to depict "global warming during the past century" even though the last data point on the graph in fact occurs in 1855.
Easterbrook even predates Monckton on the "some 9,100 of the past 10,500 years were warmer" meme, with an article on WUWT in December, 2010 claiming that:
"So where do the 1934/1998/2010 warm years rank in the long-term list of warm years? Of the past 10,500 years, 9,100 were warmer than 1934/1998/2010. Thus, regardless of which year ( 1934, 1998, or 2010) turns out to be the warmest of the past century, that year will rank number 9,099 in the long-term list."
As a side note, I am puzzled as to how he determines that ranking. Using the GISP 2 temperature data cached by Alley, from 8,905 to 8,915 of the 10,500 years BP in that record are warmer than the terminal data point. For Easterbrook to gain his ranking, he must conclude that 2010 was significantly cooler than the year he considered to be 1905.
As a further side note, the 2010 article by Easterbrook is the one discusses by Gareth Renowden above.
3) No claim is made in the OP that Easterbrook came to his conclusion as the result of just one study. The claim that he did so is false, but the only fabrication involved is your attribution of that claim to the OP.
4) You claim it is absurd that Easterbrook, as a geologist, did not know that Before Present refers to before 1950 unless otherwise specified, but in the 2010 article, his reproduction of the Alley data clearly labels the x axis "Years before present (2000 AD)", thereby indicating that he took "present" in this data to refer to 2000, not 1950. So far as I am aware, he still does so.
5) Regardless of his reasons, the paper trail clearly shows Easterbrook labeling the data that terminated in 1855 as "present global warming" thereby indicating the tail of that graph to be the warming during the 20th century (see graph above). Later he clearly labelled that data on an axis for years BP, glossed as being 2000 with a final data point at 95 years BP, ie, 1905 according to his axis.
To summarize, the purported fabrications are easilly proved to be true from the paper trail, except for two cases where the "fabrication" consists entirely in your misrepresenting the OP.
Your record on "the facts" is equally poor. It is true that, but entirely irrelevant, that the Holocene was labelled long before Easterbrook was born. The studies of Holocene temperatures that lead to the "spaghetti graphs", however, are all recent (last thirty years or so), and the spaghetti graph you used does not come from a peer reviewed paper, and was originally produced in 2005. Easterbrook has in fact used that graph, as you would know if you followed the links to the original version of the article, and back to prior history. However, he first used the current version of the graph (produced on the 19th of July, 2010, less than a week before he used it, but only after considerable editing to make it look like this:

Compared to the original, you will note that he has removed the "spaghetti". More importantly, he has also removed the indication of the 2004 temperature, the inset showing recent proxies, together with the rapidly rising instrumental record. That is, he has removed any indication that modern temperatures are in fact higher than those shown. He does not note that the zero point on the axis is "mid 20th century average temperature", but instead inserts a line approximately 0.3 C below the mid 20th century average which he deceptively labels "Present day temperature". In all, his treatment of this graph is much worse than his treatment of the Alley 2000 data, and cannot be construed as anything other than a deliberate attempt to deceive his audience.
It is, however, extraordinarily unlikely that Easterbrook, who obtained his graduate degree in 1958, saw any spaghetti graph of Holocene temperatures in highschool (none having existed back then).
Finally, the graph you cite clearly shows even mid 20th century temperatures to have been warmer than the bulk of the Holocene, while late 20th century temperatures were warmer than the multidecadal average over the entire Holocene.
In short, your "facts" are fictions. In some cases ridiculous fictions you invented without basis. In others, fictions you invented in direct contradiction to known evidence - indeed, evidence presented in the OP in one case. Skeptical Science is not a form where you are permited to just spin tissues of fabrication. You are expected to support your claims with facts, something you have signally failed to do at any point in this discussion. It is also hoped (though not required) that you change your views if fae moderators take a dim view of any further unsupported claims, or gish gallops by you.
- Scientists' open letter to the Wall Street Journal re: Ridley and Peiser
Tom Curtis at 21:18 PM on 5 December, 2015ryland @7, the CFACT article posted at WUWT is critiquing the science of the IPCC. Therefore the correct comparison as to references is between that article (with its one, often misrepresented reference per point) to the IPCC reports with their literally hundreds of references. Given that, the curious thing is that you are not outraged by CFACT and WUWT for cherry picking outliers from the scientific literature and treating them as overriding the vast majority of the scientific literature, while keeping that contrary literature carefully out of sight and refusing to discuss the relevant issues.
Your view appears to be that public discourse is intellectually primary to scientific research, no matter how transparently that public discourse misrepresents the actual research.
As one example of the sort of misrepresentation indulged in in the CFACT article, consider the quotation:
'“Global sea level is less sensitive to high atmospheric carbon dioxide concentrations than previously thought.”
– Stanford, Geology, August, 2015'
Here is the full quote from the Stanford article:
"To understand the isotopic composition of Pliocene ice, Winnick and Caves began in the present day using well-established relationships between temperature and the geochemical fingerprint. By combining this modern relationship with estimates of ancient Pliocene surface temperatures, they were able to better refine the fingerprint of the Antarctic ice millions of years ago. In re-thinking this critical assumption, and by extending their analysis to incorporate ice sheet models, Winnick and Caves recalculated the global sea level of the Pliocene and found that it was 30 to 44 feet (9 to 13.5 meters) higher, significantly lower than the previous estimate.
“Our results are tentatively good news,” Winnick said. “They suggest that global sea level is less sensitive to high atmospheric carbon dioxide concentrations than previously thought. In particular, we argue that this is due to the stability of the East Antarctic Ice Sheet, which might be more resilient than previous studies have suggested.” However, a rise in global sea level by up to 44 feet (13.5 meters) is still enough to inundate Miami, New Orleans and New York City, and threaten large portions of San Francisco, Winnick cautioned."
(My emphasis)
A long term sea level rise of 9-13.5 meters is not good news. Nor is it consistent with the message the CFACT article tries to sell with regard to sea level. Further, as the Stanford article goes on to indicate, the finding has no bearing on sea level rises over the next few centuries, the timescale of interest to the CFACT claims. There is no question, therefore, that the article is quoted out of context.
Like the creationists before them, AGW deniers never have a shortage of "references". They need only take articles out of context, misreport their significance, shepherd a few articles through the peer review process with the aid of unscrupulous friendly editors, and establish "speciality journals" where 'peer' review is entirely restricted to other deniers. Given this, merely counting the number of references in a popular piece is irrelevant unless are prepared to commit yourself to verifying that the references are from genuine peer reviewed sources (not specialty denier magazines), that they are quote in context and not misrepresented, and that they fairly represent the literature rather than being cherry picked outliers.
Unless, of course, your only point is that we should stand in awe of the unscrupulous propoganda by CFACT and WUWT.
- Scientists' open letter to the Wall Street Journal re: Ridley and Peiser
ryland at 14:25 PM on 5 December, 2015Coincidentally there is a discussion in WUWT disagrees with several of the points raised here. (See here). The specific items discussed in WUWT are that:
1 Global temperatures are lower than models predict
2 Sea level is rising only 1-3mm per year
3 The polar bear population is now about 5x that in the 1960s
4 Extreme weather is historically normal
The discussions of each appear to be appropriately referenced.
I am aware that WUWT is anathema to most who comment here but it is one of the most, if not the most, widely read climate blog site. Consequently a lot more readers get their information from WUWT than from other such sites and in this instance will get an entirely different perception on global warming than will readers here. Although overall there are, probably, more readers of the WSJ in total than readers of WUWT but the percentage of these WSJ readers interested in climate matters is unknown.
Which report is the more credible is, of course debatable, but the WUWT piece is supported by references to published literature and IPCC reports whereas the refutations in the WSJ are not.
- Examining Hansen's prediction about the West Side Highway
Tom Dayton at 09:25 AM on 4 October, 2015Willis Eschenbach on WTF just repeated this myth about James Hansen's "prediction" of the West Side Highway being covered by now.
- The Skeptical Science temperature trend calculator
Philip Shehan at 13:26 PM on 2 July, 2015cunudian:
I partly covered the problem with chopping up temperature trends into short pieces to fit skeptic argument was covered in one of my earlier long (apologies to mods) posts above.
Then there is the astonishing manner in whech people like Singer and David Whitehouse include and exclude the extreme el nino event of 1998 to suit their argument.
According to Fred Singer (my Bold):
“Not only that, but the same satellite data show no warming trend from 1979 to 2000 – ignoring, of course, the exceptional super-El-Nino year of 1998.”
Never mind that “skeptics” have been starting with the exceptional super-El-Nino year of 1998 in order to claim a “pause”.
Presumably, Singer accepts that the green line here shows a statistically warming trend.You must not include the period after December 31 1997 in a shorter period because …well, it would spoil his argument .
Singer can declare that that the purple line shows that there is no warming from 1979 to 2000, as long as you leave out the troublesome data after 1997. (The light blue line shows the inclusion of the forbidden data.)
Furthermore, according to Singer, the data from January 1 1998 onward, (the dark blue line) shows a “pause”. No problem including the el nino event at the beginning of a trend, just not at the end, because…well, it would spoil his argument.
And David Whitehouse says you must not start a trend from 2000, (brown line) because… well, it would spoil his argument too.
But back to Singer. Notice that according to his argument there more of a “pause” before the el nino event than after.
The real absurdity is his claim that there is no warming from 1979 to December 31 1997 and there is no warming from January 1 1998 to the present
But there is warming from 1979 to the present.
Singer’s argument is Alice in Wonderland stuff, achieved by chopping a statistically significant warming trend into two short periods where the noise dominates the signal.
- What you need to know about the NOAA global warming faux pause paper
mwsmith12 at 22:29 PM on 18 June, 2015michael sweet,
The authors of the WUWT post claim that adding .12 to the buoy data it must put a warming trend in the data:
"Adjusting good data upward to match bad data seems questionable, and the fact that the buoy network becomes increasingly dense in the last two decades means that this adjustment must put a warming trend in the data."
http://wattsupwiththat.com/2015/06/04/noaas-new-paper-is-there-no-global-warming-hiatus-after-all/
That's right, isn't it? As more buoys are added, more artificially high readings are added.
- What you need to know about the NOAA global warming faux pause paper
mwsmith12 at 20:37 PM on 18 June, 2015This is important because it illustrates how contrarians leverage these details into doubt and suspicion.
This is a quote from post by Patrick Michaels, Richard Lindzen, and Paul Knappenberger over at WUWT. I don't read that site, but posts from there get used everywhere, so I had to deal with this one:
"In addition, the authors’ treatment of buoy sea-surface temperature (SST) data was guaranteed to create a warming trend. The data were adjusted upward by 0.12°C to make them “homogeneous” with the longer-running temperature records taken from engine intake channels in marine vessels.
"As has been acknowledged by numerous scientists, the engine intake data are clearly contaminated by heat conduction from the structure, and as such, never intended for scientific use. On the other hand, environmental monitoring is the specific purpose of the buoys. Adjusting good data upward to match bad data seems questionable, and the fact that the buoy network becomes increasingly dense in the last two decades means that this adjustment must put a warming trend in the data."
http://wattsupwiththat.com/2015/06/04/noaas-new-paper-is-there-no-global-warming-hiatus-after-all/
The authors are trying to convince me that homogonization is cheating. They put it in quotes. Well, I already know why homogenization is important and how it improves data qaulity, but even so, why add 0.12C to all the buoys when the buoys were designed for this and should be more accurate than measurements from ships that are just trying to get from A to B as fast as possible?
And despite my being a career software engineer who at least reads a lot of climate science reportage and the occassional paper, and who understands the scientific method and the concepts of statistics etc, I was still left with some doubt because it isn't clear to me why data that seem to me to be more accurate are adjusted up to be compatible with data that seem to me to be less accurate.
Having now understood the explanation, I can't believe the three authors of the WUWT post don't know it already. And if so, their objection is disingenuous at best. But it would be very useful to the general public if each scientific paper could have an accompanying link to a page on which these explanations are provided, together with the perhaps bogus objections that require them.
Maybe a section here at Skeptical Science, where these papers are catalogued toghether with all the contributed explanations for questions like: Why did we add 0.12C to the buoy data, and why is that the right thing to do?
- What you need to know about the NOAA global warming faux pause paper
BC at 13:19 PM on 9 June, 2015As part of the Denial 101 MOOC course I had to select a myth to write an article about. I picked a Christopher Monckton article on WUWT about the pause.
wattsupwiththat.com/2015/06/03/el-nino-strengthens-the-pause-lengthens/
It wasn't a problem debunking the myth - I mainly used info from the Kevin Cowtan video shown on SKS in Dana's post of 3 June. However I was surprised at one aspect of the RSS satellite data shown by Monckton. While 2014 is recognised as the warmest year so far an eyeball of the RSS data shows it quite low, much lower than 1998 and 2010 and probably down to about number 5 or 6. I looked on an RSS site but couldn't find much of use. Can anyone explain this please? Maybe he's using the TMT data too.
BTW the MOOC course was great!
- Real-world measurements contradict paper claiming little global warming
Tom Curtis at 00:40 AM on 8 June, 2015Tristran @5&6, HK @7, Monckton determines the trends from Fig 11.25 of AR5 in the published edition, and the corresponding Fig 11.33 in the 2nd Order Draft.
In Fig 11.25, the mean temperature for 2016-2035 is given as 0.3 - 0.7 C above the 1986-2005 mean. That represents a 0.5 C median increase over three decades, giving a trend of 0.167 C per decade. In Fig 11.33 of the 2nd order draft, the mean temperature for 2016-2035 is given as 0.4 - 1 C, giving a trend increase of 0.233 C per decade. Monckton states that these graphs are the source of his estimates in a blog post that preceded his paper on WUWT (dated Jan 1, 2014). On the blog post he produces the following graph, which is an obvious precursor of Fig 6 in his paper (the third figure in the OP).

I do not know why he switched from the marginally justifiable 0.17 to the totally unjustifiable 0.13 C shown in the paper.
As a side note, the final version of AR5 shows a lower trend solely because they start the predicted trend from 2012 rather than from the mean of 1986-2005. As such, the difference does not represent a disagreement about the trend which is the same in both cases. Rather it represents a preference for using the most recent historical value (at time of publication) as the start point of the trend prediction rather than the mean over a 20 year period. Monckton is wrong, therefore, to represent it as a different predicted trend. In fact, of the two factors that determine the mean predicted temperature for 2016-2015 (ie, stard point and trend) he ascribes it to exactly the wrong cause.
That point speaks to rkrolph's question (@4). Specifically, there is no difference between the predicted trend between the 2nd order draft and the final version of AR5. Rather, there is a difference in start point in predicting a mean value that Monckton misrepresents as a difference in trend. From past performance, it is likely that Monckton also misrepresents the trends on earlier IPCC reports (and Hansen scenario A), but he does not detail how he determined the values, and he is not worth the leg work to try and work out how he did it.
- There is no consensus
TruthDetector at 02:03 AM on 4 June, 2015The consensus that was never there
http://www.mysanantonio.com/opinion/commentary/article/Consensus-on-climate-change-causes-a-myth-6295631.php
97% never did agree, just a myth, http://wattsupwiththat.com/2013/11/20/the-97-consensus-myth-busted-by-a-real-survey/
http://patriotpost.us/articles/28035
http://hockeyschtick.blogspot.com/2010/08/97-consensus-is-only-76-self-selected.html
- It's the sun
Witkh13 at 06:10 AM on 16 March, 2015I find it ironic how this group is only skeptical towards proof that violates in what they believe. Climate Change/Global Warming believers are eager to believe others are cherry picking data because their follow acolytes have been proven to cherry pick data and promote biased readings since the beginning.
http://wattsupwiththat.com/2015/03/10/study-climate-change-is-nothing-new-in-fact-it-was-happening-the-same-way-1-4-billion-years-ago/
http://www.livetradingnews.com/orbital-variations-key-cause-earths-climate-change-98741.htm
http://www.aip.org/history/climate/solar.htm
http://science.nasa.gov/science-news/science-at-nasa/2003/17jan_solcon/
http://www.newsmax.com/Newsfront/scientists-Milankovitch-cycles-orbit-variations/2015/03/11/id/629605/
https://www.heartland.org/sites/all/modules/custom/heartland_migration/files/pdfs/24807.pdf
All the Climate Change/Global Warming acolytes have to answer to this is to cherry pick one major study and then imploy impropriety based on who funded the research. They use degrading, false, slanderous insults instead of actual proof that any impropriety actually occured.
As I said, the acolytes are merely reflecting their own lack of morals or ethics on everyone else. Apparently it is inconcievable to them that someone may actually have a backbone and tell a sponsor to go pound sand.
However, please continue with this elementary sandbox mentality. Those who are without the mental illness of statism are the opposite of impressed.
- Don Easterbrook's Heartland Distortion of Reality
Tom Curtis at 11:04 AM on 4 January, 2015Interesting to note that Easterbrook was still using the graph shown at Fig 5 to present his predictions as recently as Jan 21st last year (2014) (WUWT link). One feature of that graph not discussed above is the supposed "observational data". Looking at it today, I was wondering what temperature data set was usd for the graph, as it does not look like any I know (and I am very familiar with most). It turns out that Bob Tisdale has the answer:
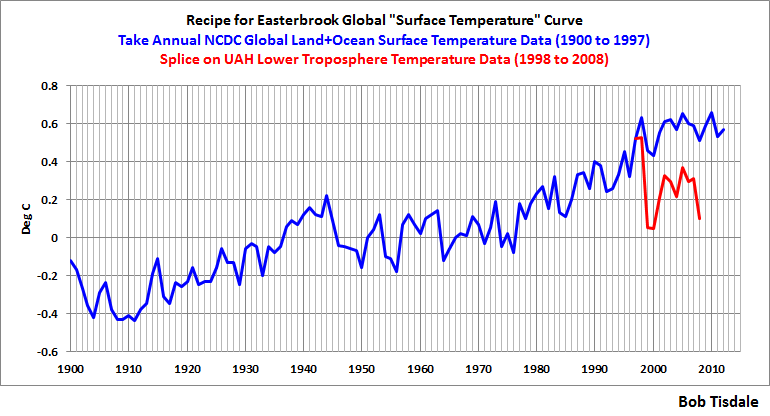
(WUWT)
Easterbrook merely appended the UAH temperature record to very early 2009 from the peak of the 2008 El Nino. As satellite temperature records show much larger fluctuations due to ENSO events, that has the effect in his graph of shifting the post 2000 temperatures below those of the 1990s. By also appending the "IPCC predictions" at the same peak he at the same time off set the IPCC predictions upwards. That is because individual model runs will show El Nino events, but will not show them in the same years.
He also got a lower "predicted" temperature by appending them to the bottom of the 2008 La Nina fluctuation. That represents a triple offset to exagerate the predicted cooling as it incorporates the offset introduced by using UAH data instead of the simply using the NCDC data over the whole period, adds an additional offset by using the bottom of a La Nina event as a start year, and exagerates that La Nina event by using a satellite temperature record to show it while using instrumental record data for the predictions.
Easterbrook has not, to my knowledge, either confirmed or denied Tisdale's conclusion as to how he constructed his graph. The evidence that Tisdale correctly determined the method is, however, fairly undeniable as can easilly be seen at Woof for Trees (using HadCRUT3 non-adjusted in lieu of NCDC).
Each of these acts must be considered mendacious in anybody trained in the sciences (as Easterbrook is). Bob Tisdale to his credit indicates as much.
Finally, I dislike linking to WUWT or to Tisdale as both are woefully wrong as a general rule. As when I investigated the issue, I found he had uncovered the deception, I am compelled to give him due credit. That should in no way be taken as an endorsement of any of his other views.
- Examining Hansen's prediction about the West Side Highway
Roger Knights at 18:29 PM on 22 December, 2014As promised, here's the <a href="http://wattsupwiththat.com/2014/12/19/friday-funny-mann-overboard-at-agu14/">link</a> to the comment on WUWT that triggered my replies.
- Examining Hansen's prediction about the West Side Highway
Roger Knights at 21:31 PM on 20 December, 2014In March 2011, perhaps in reaction to this March 10 SkS thread, Watts updated his original 2009 story to correct the record and concede that 40 years was the correct number. He wrote, “So I’m happy to make the correction for Dr. Hansen in my original article, since Mr. Reiss reports on his original error in conflating 40 years with 20 years.”
See the updated first pages at: http://wattsupwiththat.com/2009/10/22/a-little-known-but-failed-20-year-old-climate-change-prediction-by-dr-james-hansen/
SkS should update its head post by mentioning Watts’s update. As-is, it can be read as implying that Watts is continuing to make a debunked claim. (It says, “One climate myth found on the internet, propagated by Anthony Watts, is that James Hansen erroneously predicted . . . .”) In addition, “previously” should be inserted before “propagated.”
- CO2 effect is saturated
Tom Curtis at 09:35 AM on 17 November, 2014Satoh @347, 348, 349, 350, and 354 criticized my understanding of path length as used as a measure of pressure-length (pL) in Hottel diagrams. This is despite the fact that he responded to my post @340 in which I describe my understanding by saying "excellent work" with no expressed quibble about my understanding of pL or emissivity, both of which he now disputes. In particular, he wrote @349:
"You randomly picked the top line and said "it's 4 foot atmospheres which is .0004 X 10,000 feet" so it would point to the 0.2 mark. That's pretty arbitrary. The mean free path length of 15 micron photons at sea level is definitely not 10,000 feet so you can't use that line.
This paper has been floating around the web which says the mean path length for photons in CO2 at sea level is 32 meters. I don't buy it. They first measured it many years ago and it was in millimeters. I'd like to know what the latest calculations are for that.
Mean path length applies to absorption, and it also applies to emission. They are inverse of the same process."
The first and most crucial point is that L is not defined as "mean free path length", and that "mean free path length" is not the same thing as "mean path length". Indeed, Mehrota et al (1995) (download PDF), define L in pL as "mean Beam width". Further, in a worked example, they calculate estimates of emissivity for a Claus plant (described in Nasato et al, 1994), saying, "A mean beam length of L = 0.9 x diameter = 0.04 m can be used." (The inside diameter of the tube in question was 43.99 mm.)
Further, that is consistent with the lecture slides by Dr Prabal Talukdar on Gas Radiation in which he defines "Mean Beam Length":
"• The simple expression for the hemisphere of gas is not
applicable for other geometries
• A concept of mean beam length is introduced for
engineering calculations- This is an equivalent path length L which represents the
average contributions of different beam lengths from the
gas body to the striking surface- In the absence of information available, mean beam
length is approximately calculated as
L =~= 3.5*V/A
Where A=total surface area of the enclosure
and V = total volume of the gas"He then shows a slide of a table of formula for different shapes including a "Circular cylinder of semi-infinite height" radiating to "an element at the center of the base" for which the formula is 0.9 *D. As these formula are not restricted as to the actual volumes enclosed, and as the worked example by Mehrota et al has a Beam Length significantly greater than your estimated Mean Free Path Length, I take this to show how experts in the field interpret L for the pL contours in Hottel diagrams (as opposed to the interpretation of biologists working outside of their field that even Anthony Watts considers to be a pseudo-scientist).
Worse, however, the mean free path length is given by the general formula l=1/(nσ), where l is the mean free path length, n is the number of particles involved, and σ is the effective cross sectional area of collision. (In Nahle's varian he uses "l=m/(nσ)" where m is the mass of the gas, and n is the number of molecules per unit mass which is equivalent.) However, by the ideal gas law,
P=nRT/V, where n is the number of molecules in moles, P is pressure, T is temperature, V volume and R a constant. Ergo, for constant temperature and volume, P is proportional to n. But n is inversely proportional to l (free path length), so that if L in pL is mean free path length, pL is constant for a constant temperature and volume. Ergo, if L were mean free path length, contours of constant pL in Hottel diagrams (which assume constant volume) would by necessity be vertical, ie, have a constant value in the x-axis (Temperature). Therefore it is mathematically impossible that L from pL = mean free path length. (Put another way that may be less obscure, because p is the inverse of l, of L=l then Hottel diagrams should revert to a mapping of Temperature directly onto emissivity, and shoud require no pL contours for that mapping.)
Turning to emissivity, we have the statement of Byun and Chen (2013) that Hottel diagrams model total emissivity, not spectral emissivity. The latter is the emission at a given wavelength or frequency relative to that predicted by the appropriate form of Planck's law for a black body at that wavelength or frequency. The former is the integral of the spectral emissivions as a ratio to the emission predicted by the Steffan-Boltzmann law for the total emission of a black body. Both, or course, are relative to a particular temperature.
Because the emissivity plotted in Hottel diagrams is total emissivity, it is irrelevant that the emission at 15 microns is absorbed within a very short distance. Emissions just above or just below 15 microns may not be absorbed for meter, or even kilometers and hence make a substantial contribution to mean Beam Length (L). Therefore, in determining the total emissivity of the atmosphere, you cannot assume very short mean beam lengths. (Nor should you assume mean beam lengths equivalent to the total height of the atmosphere because of decreasing pressure with altitude.) But looking horizontally, mean beam lengths of multiple kilometers are possible with near constant pressure. Hence my example of 10 horizontal kilometers, which with CO2 and amtospheric concentrations gives a total emissivity of approximately 0.2 (which I know independently to be the approximate total emissivity of CO2 looking vertically in clear sky conditions).
- Sea level rise is exaggerated
Holdean at 04:28 AM on 9 November, 2014I think that a lot of you are missing the point, including the contributing author. Are sea levels rising? It would seem so. Is mankind in some way causing this phenomenon? Doubtful. The current period of climate change with accompanying measuements of atmospheric temperature and CO2 levels started approximately 18,000 years ago. There have been four periods where atmospheric temperatures and CO2 levels have been as high or higher than presently in the last 400,000 years (Source: http://www.grida.no/publications/vg/climate/page/3057.aspx) Mankind was obviously not the cause of any of these occurrences. The graph showing the rise in sea levels in the article posted here shows steadily rising sea levels since the 1870s. That should be expected when you consider that the "mini ice age" lasted from the 1300s to about 1850 and that is when the glaciers and sea ice reached their peaks. As that water becomes available again, sea levels rise. A way to look at it would be to look at Pevensey Castle, which was on England's South coast in 1066. Pevensey Castle is now a mile inland! (Source:http://wattsupwiththat.com/2013/12/02/history-falsifies-climate-alarmist-sea-level-claims/)
- 2014 SkS Weekly News Roundup #43B
Tom Curtis at 20:50 PM on 27 October, 2014nigelj @31, I think you have misunderstood what I was trying to say about ECS, although the fault lies in my poor expression. Consider the following Probability Density Function for ECS:

It is a log normal distribution with characteristics matched to fit the IPCC AR5 information for the probabilities of different values. That is, there is a less than 5% chance of an ECS less than or equal to 1 (actually, 3.71%), an at least 66% chance of an ECS between 1.5 and 4.5 (66.64%), and a less than 10% chance of an ECS greater than or equal to 6 (7.87%). It is very close to a best fit PDF for the IPCC values and may reasonably be taken as representing the IPCC AR5 PDF for ECS. Out of interest, it has a mode of 1.99 C per doubling, a median of 2.72 C per doubling, and a mean of 3.18 C per doubling. Its 95% range is 0.91-8.15, and its 90% range is from 1.08 to 6.83.
My point is that substantial evidence and carefull consideration of that evidence has gone into that PDF. A theory that proposes a PDF very greatly different from it, therefore, is likely to be in conflict with much of that evidence and hence not emperically supported. This does not rule out alternative estimates. Lewis and Curry (2014), for example, estimates a mode of 1.64 C per doubling, and a 90% range of 1.05-4.05 C per doubling. So while there are a number of indentifiable flaws in that paper, all (as it happens) lowering the estimated ECS, we cannot look at that estimate and say it is absurd because it differs too much from the IPCC estimate and "the science is settled".
In contrast, however, if we see estimates of 0.2 C per doubling (Eschenbach, WUWT), 0.67 C per doubling (Bjornbom 2013), or 0.39 C (Hockey Schtick misinterpretation of Levitus 2012), we can reasonably dismiss them on the grounds that the science of climate sensitivity is sufficiently settled to exclude such radical outliers. A specialist discussing the issues could not be so dismissive, needing to actually identify errors in the estimates (which is in general trivially easy to do). But for those estimates to be right, too many other reasonable estimates have to be too radically wrong. Ergo we would require something more than a blog post from somebody known to not understand the science (Eschenbach) or a misinterpretation of TOA net radiative flux with radiative forcing (Hockey Schtick) to reject that other evidence.
I note a similar issue applies with respect to Relativity, and Quantum Mechanics (a point you failed to note). Underlying theories can be radically revised, but the predictions of the new theory must almost exactly match the predictions of the old theory under the range of normal (for middle size organic being) conditions. If they did not, the new theory would be refuted by the very observations that were previously thought to support the old theory. Thus, while theories are always in flux, and may always be supplanted, they will always provide good approximations to the results of the supplanting theories accross the range of normal conditions. It is for that reason when NASA designed the grand tour of the solar system with Voyagers 1 and 2, they used Newtonian dynamics rather than General Relativity. In essence, for any well developed theory, the theory itself may be in flux, but its predictions, ie, its actual scientific content, to a close approximation and across the range of conditions under which it was first successfully tested, are settled. Ergo, if radiative physics were overturned tomorrow, we know that the new theory that supplanted it would still predict an atmospheric greenhouse effect.
- Global warming: a battle for evangelical Christian hearts and minds
paul at 03:18 AM on 4 October, 2014@DSL,
Since Im not a scientist heres a couple of links about the polar ice caps melting.
http://wattsupwiththat.com/2013/12/16/nature-proves-al-gore-wrong-again/http://stevengoddard.wordpress.com/ice-free-arctic-forecasts/
DSL, some models have been proven faulty. Some models are tweaked by omitting some of the numbers. For example, I could show you a warming or cooling trend by cherry picking the years the planet warms or cools and Im not even a scientist.
no global warming for 18 years 1 month
The Great Pause is the longest continuous period without any warming in the global instrumental temperature record since the satellites first watched in 1979. It has endured for a little over half the satellite temperature record. Yet the Pause coincides with a continuing, rapid increase in atmospheric CO2 concentration.
http://wattsupwiththat.com/2014/10/02/its-official-no-global-warming-for-18-years-1-month/
Blogs like this one would establish credibility to openly disavow politicians like Al Gore. Politics using scare tactics to openly advance agendas that have everything to do with money and nothing to do with saving the planet have effectively ruined any and all good faith in the sciences. Many people like me simply do not believe the climate change agenda.
It really irritates me to see blogs like this wanting to win the hearts and minds of Christians by telling them their religion is make believe.
When your minds are already made up about Christians how can you present yourself in good faith?
As for believing the "greenhouse effect" theory I cant really say I do or don't. What I know for sure is that the polar bears are doing just fine, the polar ice caps are doing just fine and last years winter was one of the coldest on record.
I think you guys need to rethink your approach to climate change. Theres been to many glitches along the way and blogs, such as Skeptical Science, never seem to root out the riff raff, such as Al Gore, among the rank and file. It is jaw dropping that he showed his face at the climate change march.
So, spare me the Psalm references and stick to science.
- Skeptical Science Study Finds 97% Consensus on Human-Caused Global Warming in the Peer-Reviewed Literature
Tom Curtis at 07:58 AM on 18 September, 2014Russ R is now running the misinterpretation of the classifications scam vs Cook et al 2013 (ie, claiming that the criteria for endorsement in Cook et al is only that some warming since 1950 be anthropogenic). I say it is a (rhetorical) scam because it was not the first or intuitive response of AGW "skeptics" to that paper. The first response was that authored by Poptech, in which Nicolas Scaffeta wrote:
"Cook et al. (2013) is based on a strawman argument because it does not correctly define the IPCC AGW theory, which is NOT that human emissions have contributed 50%+ of the global warming since 1900 but that almost 90-100% of the observed global warming was induced by human emission."
You will notice that correctly identifies the Cook et al criteria for endorsement, ie, that it indicates that 50% plus of recent warming was anthropogenic, and tries to call it a strawman because it does not match his blatant misrepresentation of the IPCC position.
Indeed, if a paper that endorses only that some recent warming is anthropogenic belongs to the Cook et al 97%, then both Sceffeta's and Shaviv's papers (discussed by Poptech) should have been classified as endorsing the consensus. Likewise, if a paper that endorses only that some recent warming is anthropogenic belongs to the Cook et al 97%, then all four of Richard Tol's papers which he claims to not have endorsed the consensus, should have been classified as endorsing the concensus.
A number of major AGW "skeptics" and Richard Tol have endorsed these claims of misclassification, including Watts (who reposted the claims), Tol who reposts it and a number who have commented either at WUWT or on Tol's tweet without demuring that Shaviv's description of the Cook et al classification was wrong. In fact, I have been unable to find one objection to Scaffeta's claims, or the claims that these papers were misrated based on the supposed fact that the Cook et al 97% endorsed only some anthropogenic warming rather than 50% +.
That, of course, merely demonstrates that the AGW "skeptics" are inconsistent in their criticism of Cook et al. It does not demonstrate that Scaffeta (and Tol's) 50%+ interpretation is correct. So, let us examine the possibility that "level of endorsement of AGW" in Cook et al means just endorsement of the claim that at least some of recent warming has been anthropogenic (ie, that anthropogenic factors have not had either no effect, or tended to cool recent temperatures).
So, consider the classification scheme used in Cook et al:
"Table 2. Definitions of each level of endorsement of AGW.
Level of endorsement Description Example
(1) Explicit endorsement with quantification Explicitly states that humans are the primary cause of recent global warming 'The global warming during the 20th century is caused mainly by increasing greenhouse gas concentration especially since the late 1980s'
(2) Explicit endorsement without quantification Explicitly states humans are causing global warming or refers to anthropogenic global warming/climate change as a known fact 'Emissions of a broad range of greenhouse gases of varying lifetimes contribute to global climate change'
(3) Implicit endorsement Implies humans are causing global warming. E.g., research assumes greenhouse gas emissions cause warming without explicitly stating humans are the cause '...carbon sequestration in soil is important for mitigating global climate change'
(4a) No position Does not address or mention the cause of global warming
(4b) Uncertain Expresses position that human's role on recent global warming is uncertain/undefined 'While the extent of human-induced global warming is inconclusive...'
(5) Implicit rejection Implies humans have had a minimal impact on global warming without saying so explicitly E.g., proposing a natural mechanism is the main cause of global warming '...anywhere from a major portion to all of the warming of the 20th century could plausibly result from natural causes according to these results'
(6) Explicit rejection without quantification Explicitly minimizes or rejects that humans are causing global warming '...the global temperature record provides little support for the catastrophic view of the greenhouse effect'
(7) Explicit rejection with quantification Explicitly states that humans are causing less than half of global warming 'The human contribution to the CO2 content in the atmosphere and the increase in temperature is negligible in comparison with other sources of carbon dioxide emission'"For this categorization to be consistent it must satisfy two criteria:
1) No paper must fall under more than one classification;
and
2) If different levels of concensus represent different minimum percentages of anthropogenic contribution, they must change monotonically with classification level.
Now clearly if "endorse AGW" means "endorse that "at least some of recent warming has been anthropogenic", then the categorization fails criteria (1). That is because any paper endorsing >0% but <50% anthropogenic warming must be categorized either 2 or 3, but also 7. Further, it also fails condition (2) for category 1 clearly applies only to papers which endorse 50% or more anthropogenic contribution to recent warming, while category 7 applies only to papers that endorse less than 50% anthropogenic contribution. The only monotonic ordering of endorsement levels possible, therefore, is on in which for all categories endorsement of AGW means endorsing 50% or more of recent warming as anthropogenic, and disendorsing means endorsing less than 50%.
If there are two ways to interpret a paper, one of which is consistent, and one of which is inconsistent, then clearly we must give preference to the consistent interpretation. Doing otherwise merely raises a strawman. Therefore, there is no rational way to interpret endorsement in Cook et al as anything other than "endorsement that 50% or more of recent warming was anthropogenic".
Ironically, despite this several AGW "skeptics" have criticized Cook et al both for using a definition of endorsement that allowed even hardcore deniers to belong to the 97% and also for being inconsistent. They prove thereby that there intent is only to criticize, not to actually rationally critique the paper.
- 2014 SkS Weekly Digest #36
Philip Shehan at 16:41 PM on 11 September, 2014In the last week the “skeptic" blogs have been agog with Ross Mc Itrick’s statistical analysis that the haiatus goes back 16, 19 or 26 years depending on the data set.
file:///C:/Documents%20and%20Settings/user/My%20Documents/Downloads/OJS_2014082814175187.pdf
Reliably, Watts puts up a graph of the Hadcrut4 data set (1995 to April 2014) from WFT but decides not to put in the WFT trend line which like the data in Mcitrick’s paper indicates a warming trend of 0.0925 °C/decade (the skeptical science trend calculator gives Trend: 0.093 ±0.100 °C/decade (2σ)) but substitutes a cooling slope.
http://wattsupwiththat.com/2014/09/01/new-paper-on-the-pause-says-it-is-19-years-at-surface-and-16-26-years-at-the-lower-troposphere/
My problem with McItrick’s paper is that he appears to be claiming that unlike the skeptical science trend calculator, his data shows that the hiatus is statistically significant. The stats is a bit beyond me , Does anyone have any ideas?
- 97 hours of consensus: caricatures and quotes from 97 scientists
Donny at 00:30 AM on 9 September, 2014Can someone please tell me if this Greenland ice core graph is real or crap? Not sure who to believe.
wattsupwiththat.com/2014/09/08/monday-mirthiness-97-hours-97-opinions-97-consensus/
- 2014 SkS Weekly Digest #34
GSR at 13:25 PM on 30 August, 2014[snip]
- What I learned from debating science with trolls
Alexandre at 09:54 AM on 30 August, 2014There's a serious problem of psychological projection in the way 'skeptics' discuss climate science. Things like "vested interests of alrmists" or "CAGW is driven by emotion, whereas skeptics are driven by science" make me think this is a vast unexplored ground for psychological research.
One day it will be dismissed as an absurd that today people point to research grants as an economic power big enough to overthrow the multi-trillion dollar fossil fuel industry.
- Global warming conspiracy theorist zombies devour Telegraph and Fox News brains
KR at 04:37 AM on 26 June, 2014As I once commented on a contrarian site, in a blog post decrying temperature corrections:
It could be argued that it’s better to look at raw temperature data than data with these various adjustments for known biases. It could also be argued that it’s worth not cleaning the dust and oil off the lenses of your telescope when looking at the stars. I consider these statements roughly equivalent, and (IMO) would have to disagree.
The blog authors were, predictably, displeased by that comment. When the corrections are removing errors, and increasing the accuracy of your data, the contrarian preference for raw data is a choice for inaccuracy. And decrying those corrections says "conspiracy theorist" in large type.
- 2014 SkS Weekly News Roundup #22B
knaugle at 05:30 AM on 3 June, 2014I noticed on the wattsupwiththat.com blog that Meteorologist Joe Bastardi (on 5-23-2014) claims that NOAA predicts above average sea ice extent for August. Yet I cannot find this directly, except for cryptic links to plotted data, and NSIDC seems to be showing below average trends. Given the skeptical/denier nature of WUWT I am not surprised, but was curious if anyone knows more about where JB got his data?
- 2014 SkS Weekly News Roundup #22A
Timothy Chase at 02:43 AM on 3 June, 2014MThompson wrote:
I for one find it abhorrent that posters to this blog refer to a group of humans as "sheeple." I infer from this that the writers use the term to indicate disdain for the relatively uneducated and impoverished peoples of the earth.
I performed two searches. One was for sheeple in Skeptical Science, the other for sheeple in WattsUpWithThat, both using Google.
site:skepticalscience.com sheeple returned 9 webpages
site:wattsupwiththat.com sheeple returned 501 webpages
Now before you think I am responding with a "they do it too" or "they do it more often" I should also let you know that I looked at the 9 instances at Skeptical Science.
There was the reference to the cartoon the response to the reference to the cartoon, neither of which was in a context specific to the acceptance or dismissal of climate science, one reference to the "uneducated masses" who don't get climate science. In this case the comment was posted by someone calling himself "actually thoughtful" who isn't a regular, just passing through. The 6 other webpages contained references by those who are pro-science refering to those who are pro-science — mocking the use of the term itself.
I will let you discover for yourself how the term gets used at Watts Up With That.
- The Quantum Theory of Climate Denial
Warren Hindmarsh at 12:44 PM on 1 May, 2014‘He who exercises no forethought but makes light of his opponents is sure to be captured by them.’ Sun Tzu
To try to win the AGW debate by dismissing opponents as intelectually incompetant is a sure way to lose.
The best way to win the debate is to provide evidence. Evidence ls the answer to how people make their decision.
- Climate Change: Years of Living Dangerously
JIm Steele at 15:05 PM on 26 April, 2014‘Years of Living Dangerously’ shouts climate fire! But, data says their shouting is simply noise. The documentary uses talented celebrities who are totally ignorant of the entire climate issues. Read my debunking of the first 2 episodes.
http://wattsupwiththat.com/2014/04/25/years-of-living-dangerously-shouts-climate-fire-but-data-says-their-shouting-is-simply-noise/
and
http://wattsupwiththat.com/2014/04/14/exploiting-human-misery-and-distorting-the-science-an-environmentalists-critique-of-years-of-living-dangerously/
- Skeptical Science consensus paper voted ERL's best article of 2013
jsam at 23:43 PM on 22 April, 2014Better than a bloggie, I guess. :-)
Well done all. - Tropical Thermostats and Global Warming
Tom Curtis at 11:42 AM on 19 March, 2014Michael Sweet @21, Eschenbach also showed a map of the locations in which SST excedes 30 C (Fig 5, AOTM):

The contrast between the West and East Pacific makes it very clear that ocean currents and prevailing winds are a major factor in determining the upper reach of SST. The mixing of cold waters with surface waters of Peru makes temperatures greater than 30 C effectively impossible under current conditions, for example.
Further, and as you can see, in general 30 C SST occurs at higher latitudes in the NH than in the SH, and is more likely to occur in enclosed waters (Sea of Japan, Mozambique Channel) than in open waters. The two phenomena are related, of course. There are more enclosed waters in the NH than in the SH.
The importance of enclosed waters is not that they are shallow. (The Persian Gulf is shallow, but the other enclosed waters with high SST are not.) Rather, it is that they limit mixing with nearby cold water. That is made particularly clear in the Arabian Sea and the Bay of Bengal, which are both wide enough to present no significant restriction on mixing. Despite that they also experience very warm temperatures because the only significant body of water they can mix with are equatorial waters to the south, which are warm year round rather than just seasonally.
As noted, the impact of limited mixing explains why there are higher SST in the NH than occur in the SH, despite the fact that the SH recieves more insolation. So, as you would expect, insolation does not explain everything.
Finally, the peak daily TOA insolation is found outside the tropics, as can be seen from the wikipedia chart above. That does not result in peak SST outside the tropics (ignoring the Persian Gulf). That may be in part because outside the sub-tropics, the surface has a net energy deficit:

As a result, prolonged sunlight may not lift temperatures above levels in which they are close to energy balance. Further, at higher latitude, the rate of warming will be slower, so that temperatures will not rise to very high levels until many hours after noon, by which time insolation is falling again. These two factors complicate the issue, so that I would not like to predict the latitude of maximum SST even in a pure waterworld with no lateral mixing. It will not be confined to the equator, however, and probably shifts seasonally across the equator.
So, the situation is not a simple as my exposition above may suggest. Never-the-less, it is ironic that Eschenbach picked as his two primary pieces of evidence facts that are explicable in terms of insolation alone (ie, the shapes and relative positioning of the gaussians and the relative peakiness of summer vs winter periods.
- Tropical Thermostats and Global Warming
Tom Curtis at 11:52 AM on 18 March, 2014Following on from a discussion elsewhere, I would like to discuss Willis Eschenbach's hypothesis, in that he at least presents what at first glance looks like evidence for his hypothesis. The evidence is scattered through three posts at WUWT, and shows that SST above 30 C are uncommon. Eschenbach argues that because those temperatures are uncommon, there is a "hard limit" on ocean temperatures, slightly above 30 C.
Eschenbach's hypothesis faces an immediate hurdle in that his own data refutes it. Here is his plot of "all" NH Argo surface temperatures (Fig 2, AOTM):

The "all" is dubious in that there are far to few data points for "all" ARGO NH surface temperature records, and it is likely that Eschenbach has used a random sample of the data to make distributions clearer. Regardless of that point, however, it is very clear from the graph that there is not a hard limit at 30-32 C. Several temperatures are recorded above those values, and some very far above those values. This is most clear in 2012 which shows a cluster of data points above 35 C. Further, the period of peak temperature does not show a well defined limit. Indeed, the upper limit on temperatures is less well defined in the warm months than in the cool months, the opposite of what we would expect if there were indeed a "hard limit".
What we would expect with a genuine "hard limit" can be seen by comparing the NH warm temperatures with the lower range of the SH cool temperatures (Fig 2, Notes 2):

You can clearly see a hard limit in low temperatures slightly below 0 C, representing the freezing point of sea water. The key feature is that the lower limit of temperatures is far more sharp ly defined in the cool months than in the warm months. That is in strong contrast to the upper temperature limit, which is more sharply defined in cool months than in warm months, a feature which by itself refutes Eschenbach's hypothesis.
At this point I will make a short logical excursion. As everyone knows, there is a "hard limit" on liquid water temperatures at 0 C, ie, the freezing point. Despite that, the hard limit in sea water is obviously less than 0 C. The reason is that increased salinity reduces the freezing point. Therefore, the "hard limit" is only a hard limit under a certain set of condition. If you change those conditions, you also change the "hard limit". It follows that even had Eschenbach been able to demonstrate a hard limit, he would not have demonstrated that Sea Surface Temperatures would not rise above that limit in the future, under different conditions. Of course, that is a point purely of logical interest in that Eschenbach has not demonstrated a "hard limit" to begin with.
Returning to Eschenbach's evidence, he presents more evidence that he supposes supports a hard limit. Specifically, he shows that the closer to the equator, the smaller the annual variation in temperatures (Fig 3, AOTM):

He says of this graph,
"As you can see, the warm parts of the yearly cycle have their high points cropped off flat, with the amount cropped increasing with increasing average temperatures."
That, however, is not what you see at all. Rather, at the warmest times of the year, the upper limit of temperatures are least well defined. If anything, at that time you have a spike in temperatures.
I suspect the misdescription is because Eschenbach reffers to the guassians rather than the data. He expects the Gaussians to show a series of sine waves, with those closer to the equator being warmer than those further away. He thus interprets the actual series of successively smaller amplitude sine waves with the upper cycle nearly coinciding in values as the top of the cycles having been truncated.
Unfortunately for his hypothesis, there is a well known phenomenon in nature that shows a similar pattern to his Gausians, ie, the daily TOA insolation relative to latitude:
(Source)
You will notice the near constancy of insolation at the equator, and also that insolation at 20 degrees North is higher in the summer than it is at any time on the equator. The reason for that is that, at 20 degrees North, when the sun is directly overhead, the days are longer than they are when the sun is directly overhead on the equator. And with a longer day, and the same peak forcing we expect higher SST, which is what we see. Curiously Eschenbach draws attention to the fact that the peak temperatures are found not at the equator, but between 15 and 30 degrees North, in the Summer. But given the insolation data, that is just what we would predict. So also, given the insolation data, would we predict that peak summer temperatures through out the tropics and near tropics would match or exceed peak equatorial temperatures, and that the closer the equator, the less variation in SST.
Eschenbach also draws attention to the shape of the Gaussians (shown in Fig 6), noting in particular that "...summer high temperature comes to a point, while the winter low is rounded". But again, however, he needs search no further for an explanation than the insolation pattern:

I mentioned in my introduction that Eschenback presents data that "...at first glance looks like evidence for his hypothesis". It should not be plain, however, that it is onlyh at a first, and superficial glance that that is true. His most convincing evidence turns out to be a direct consequene of the patterns of insolation at, or near the equator. The more direct evidence is seen to contradict his claim of a hard limit, showing as it does a less defined limit to temperatures in the warmest months - the exact opposite of what is required by his hypothesis. It is only by maintaining a superficial glance, and by not paying attention to actual forcings that his hypothesis appears to have any support at all.
- Global warming not slowing - it's speeding up
barry at 15:37 PM on 15 March, 2014Re OHC, I remembered that 5 or 6 years ago (or more) RP Snr was consistently saying that ocean heat content is a much better metric to measure global warming than surface temps (I agree). Around that time he was pointing out that OHC for 2003 - 2006 had not risen, and prior warming was not homogenous across the oceans. A few years later with more data, and we see OHC has continued to increase, so I wondered how RP Snr had interpreted that. I found a post citing him at WUWT, where he advises that the problematic OHC data is not robust enough to rely on.
I haven't followed RPS as much as I used, but I long respected him for being a qualified alternative voice on climate science, whether or not I agreed with him. Do I have the narrative right, here? Did he really promote OHC as the best metric, then use it to emphasise little or no warming (or cooling), and then when warming continued called the data into question?
Good post, BTW. Thanks.
- IPCC overestimate temperature rise
Cedders at 22:23 PM on 12 March, 2014BTW a later article by Monckton (2012) does another odd thing with IPCC projections, based purely on arithmetic. The final comment there is mine and intended to be read side-by-side with the article. It took some time to work out what Monckton was doing, which was back-projecting the same figures from the projections to obtain estimates for warming in 1960-2008, first assuming the CO₂-temp relationship was logarithmic, secondly that it was linear. Unsurprisingly he finds a discrepancy between those two results, but he assumes that is a flaw in the models (!).
I didn't start from an ad hominem premise, but can't help trying to understand what was driving Monckton in that article. In the Meet the Sceptics (2011) documentary, he claims to have cured himself of Graves' disease. As I understand it, mental confusion is an occasional symptom of hyperthyroidism. I don't mean that gives additional reason to dismiss his varied claims, but it might invite a more sympathetic response.
- Nazis, shoddy science, and the climate contrarian credibility gap
Tom Curtis at 05:40 AM on 24 February, 2014Andrew Mclaren @7, very interesting. I fact checked this to the limits I was able without going down to a good university library, and can confirm that while the term does not appear in Johnson's original dictionary of 1755 (at least as searchable on the internet), it does appear in the version of 1785 (page 567 on the 127 MB PDF).
We also have from the online version of Mirriam-Webster:
"1 de·ni·er noun \di-ˈnī(-ə)r, dē-\
Definition of DENIER
: one who denies <deniers of the truth>
First Known Use of DENIER15th century"
I can also confirm that the term appears in the 1992 edition of the Shorter Oxford English Dictionary:
Denier: One who denies.
They also give a as a different term:
Denier: The act of denying or refusing
with an earliest noted precedent in 1532; and which is the meaning used by King Charles in the passage quoted by Johnson.
The term "denier" has a more ancient history than that, being a moderately common title of the Apostle Peter. I that use it appears as the title of a poem by William Preston Johnston.
It is offensive that AGW deniers are trying to blacken the name of people who describe them with a very standard word of the English language that has been in common use for over 500 years. It is even more offensive that while doing that, they use the term themselves of more extreme deniers, thereby showing that their puffing and blowing about the term is sheerest hypocrissy. But more offensive even than that is Spencer's latest where, in essence he claims that because he has been compared to people who downplay the Nazi's greatest crime, it is OK for him to compare his opponents to the Nazis themselves. In doing so, he treats inaccurate history of the holocaust as morally equivalent to the holocaust itself. And, of course, he does so on the on false grounds. Calling him a denier is not a direct comparison to holocaust deniers, and is only an indirect comparison in that they are alike in denying facts well established as true. No moral equivalence is asserted by the term.
- MP Graham Stringer and CNN Crossfire are wrong about the 97% consensus on human-caused global warming
KR at 16:25 PM on 16 February, 2014Russ R - Regarding the list you presented above, I will accept the correction that not every part of the science has a 97% consensus, and that the Cook et al paper did not go into details on every aspect of the science - simply on whether we are responsible for recent warming. My apologies if I conflated that particular paper with the (generally understood) science as present in the literature.
That said, the basics of the greenhouse effect have been understood for roughly 150 years, the IPCC report is a reasonable summary of the state of the science, and significant disagreement with 1-4, and even 5, of your list puts anyone holding said disagreement in a distinctly minority position. The rest of your post is economics (reasonable debate possible on underlying assumptions such as discount rates and carbon costs, although still quite significant agreement) and political policies, which are not the subject of the Cook et al paper (or this thread).
After some thought, I went back to previous discussions - you have in fact made quite the same arguments with me over a year ago, on WUWT, and I continue to disagree with you on the same grounds as then.
The 'consensus gap' evident in the political landscape, the difference between expert opinion on AGW and the public perception thereof, is an ongoing impediment to reasoned action. Public policy should be informed by the best information available, and the many denials of consensus in the public sphere are an impediment to a well informed public response. If you disagree with the consensus measured by Cook et al, support your argument on the appropriate threads. If you object to a public understanding of that scientific consensus, I would ask why you feel that policy decisions should be made under perceptual errors on expert opinion.
- MP Graham Stringer and CNN Crossfire are wrong about the 97% consensus on human-caused global warming
Russ R. at 05:43 AM on 16 February, 2014Tom Curtis,
"You are correct that you can both oppose mitigation of AGW and accept the concensus that greater than 50% of recent global warming has been caused by anthropogenic factors."
For the record, I don't categorically oppose all mitigation policies. Some are sensible, some may or may not be effective, and some are very likely to do more harm than good.
"However, that in no way obviates Dana's claim about the actual strategies of AGW deniers. They need not have taken that strategy, but as a matter of historical record, they did. Consequently, I am not sure what point you are trying to make. Perhaps it was that when given a choice of an honest strategy, they chose a dishonest one? "
I agree, people make disingenous arguments all the time... some do so habitually. I see this on both sides. I'm not defending them. The point(s) I am trying to make, and I apologize for not having been sufficiently clear, are as follows:
- Not everyone who opposes a given climate policy is "a denier". One can fully accept the "97% Consensus" (or a more general form of scientific agreement), yet not be convinced that various policy actions are warranted or will be effective. There are plenty of good-faith reasons that people may differ in their beliefs.
- The much touted "97% Consensus" is much narrower than it is frequently portrayed. It is often misrepresented (for example by Barack Obama and KR above) as supporting positions that weren't tested in the paper. Also, it is not, by itself, sufficent justification for any policy action, let alone grounds for being "100 percent certain that Congress needs to pass serious climate legislation..." as Dana wrote in the Sacramento Bee.
That's all.
"Russ, I am glad to see that you have in fact criticized those on your own side"...
I try not to take sides in this. I don't believe there is a right side or a wrong side here. There are good and bad arguments on both sides. I try to correct the bad arguments, but only where I think the person making the argument would actually be receptive and my efforts aren't going to be wated. I have better things to do my time.
"Given that the person criticized was Willis Eschenbach, I would point out that he has deserved such criticism far more than just once."
To Willis' credit, he is meticulous with his analysis, he shows all his work, he debates in good faith, and he admits when he's wrong. Also, he is very quick to point out errors from "his own side". One very recent example...
- MP Graham Stringer and CNN Crossfire are wrong about the 97% consensus on human-caused global warming
Russ R. at 00:45 AM on 16 February, 2014Tom Curtis,
Good to see you again, and thank you for continuing to be as fact-based and scrupulously analytical as I remember.
First, I wrote my comment here to Dana because I believe that he is being sloppy. He quite rightly points out that individuals who accept only "minimal" impact from human activities are not part of the "97% Consensus" (he should know, he was a co-author").
However, he goes on to attack "those who support the status quo and oppose efforts to reduce greenhouse gas emissions" saying they "have long engaged in a disinformation campaign to misinform the public about the expert consensus." I'm making the point that one can be completely reasonable in opposing "climate policies", while still completely agreeing with the "97% consensus", because the two "consensus" positions are not sufficient on their own to necessitate action.
Second, you wrote: "Of course, it is possible that Russ is different. If so, he can undoubtedly link us to his criticisms of errors in the science by Senator Inhofe (for example)." While you know this line of argument is clearly ad hominem, I'd be happy to indulge your request. Since I'm not an American, I don't pay much attention to Senator Inhofe, so I haven't felt the need to find and correct his errors. But if you want an example of me being impartial and objective, back last summer while I was giving you and others here a lesson on the economics of gasoline taxes in British Columbia, demand elasticity and exchange rate differentials, I was also arguing with a regular over at WUWT over his opposition to the BC gas tax based on a flawed economic argument. http://wattsupwiththat.com/2013/07/15/why-revenue-neutral-isnt-and-other-costs-of-the-bc-tax/ (As a financial analyst by profession, economics is one of the few things I know a bit about, and I like to limit my arguments to things that I know something about.)
In this case... I know what Cook et al (2013) said, I know what it didn't say, and I know that the way it's being applied and presented is not entirely in keeping with what it actually said.
- We're coming out of the Little Ice Age
TD47 at 01:05 AM on 7 February, 2014There seems to be some very comprehensive collation of historical records here:
climate-and-human-civilization-over-the-last-18000-years
The large graphic image does expand to be very readable and informative. Hopefully the very interesting references will not be taken to be too off-topic (as they go back 18000 years).
- Tree-rings diverge from temperature after 1960
tkman0 at 08:48 AM on 27 January, 2014Me again, my opponent sent me this message and was wondering if I could recieve a proper answer to it. I know tree rings dont ONLY respond to cold temperatures, but I dont have everything I need to make a compelling case.
What he said:
"if you look at the tree ring proxies, they are only effective during "cold periods. They chose to exclude MWP because the data model breaks down."
http://wattsupwiththat.com/2013/08/16/oh-mann-paper-demonstrates-that-tree-ring-proxy-temperature-data-is-seriously-compromised/
- Medieval Warm Period was warmer
aristotelian at 12:03 PM on 4 January, 2014What about these studies using senentments ect indicating the MWP was global?
http://wattsupwiththat.com/2013/10/31/new-paper-shows-medieval-warm-period-was-global-in-scope/ Shows a NYT reporter intervieweing 2 scientist who measured sentiment samples around Indonesia. Look at 11:15
http://www.sciencemag.org/content/342/6158/617
MWP in China http://www.co2science.org/subject/m/summaries/mwpchina.php
http://scienceandpublicpolicy.org/images/stories/papers/originals/mwp_asian_countries.pdf
- How we discovered the 97% scientific consensus on man-made global warming
barry at 16:25 PM on 23 November, 2013Question:
Of the scientists that were surveyed to rate their own papers, did you include Alan Carlin, Craig D. Idso, Nicola Scafetta, Nils-Axel Morner, Nir J. Shaviv, Richard S.J. Tol, and Wei-Hock "Willie" Soon?
I ask because Anthony Watts, referring to a PopTech article regarding those scientists' comments on the paper, says that they were not contacted. But the scientists themselves say nothing about that.
Do you have a list of the scientists you attempted to contact, perhaps in supplementary material?
Any leads appreciated.
Barry.
- 2013 SkS News Bulletin #17: Cowtan and Way (2013)
KR at 14:53 PM on 22 November, 2013The total change in temperature is very small - the Cowtan and Way data remains within the 95% uncertainty range of HadCRUT4. Changes in yearly variations, though, do affect extremely short term trends.
All of the 'skeptic' noise about the "hiatus", discussions of "16 years", and in fact any trends derived from start points in the 1998 El Nino, deliberate selections of periods just short of statistical significance - are simply noise about noise. Trends over that time, as the authors of this paper point out, are just not statistically significant and don't have enough data to separate between short term variations and any change in climate trends.
That said, the Cowtan and Way paper makes the various skeptic/denier claims about slowdowns even less sensible. Which is why the 'skeptics' are up in arms (WUWT has something like 8-9 posts on the subject) - the paper removes one of their favorite misleading rhetorical points.
- 2013 SkS Weekly Digest #43
Philippe Chantreau at 03:18 AM on 30 October, 2013Since he is a chemical engineer, perhaps DSL should ask him if he is aware that, besides making an invalid argument, the same Steven Goddard he's referring to was the proponent of atmospheric carbon removal by deposition of carbonic snow in Antarctica (coz it's really cold down there you know). Last time I looked, WUWT had somewhat cleaned up that thread to make it look less ridiculous, something they have done on many occasions with their more laughable stuff (of which SG was a major contributor).
http://wattsupwiththat.com/2009/06/09/co2-condensation-in-antarctica-at-113f/
The comment thread is still a class act of ignorance, stupidity and arrogance. The peanut gallery bought the thing hook, line and sinker, despite the occasional voice of reason pointing to vapor pressure and the phase diagram.
They eventually let Steven go and be ridiculous by himself, something he did notably in 2012 on YouTube, when he said that the big storm was going to halt the Arctic sea ice melt. He later removed that clip from YouTube. I can attest of that because I responded on the comment thread. The clip no longer figures on his channel's list.
You'd think such a heavily credentialed engineer would know better...
- Does the global warming 'pause' mean what you think it means?
KR at 00:38 AM on 19 October, 2013Tisdale also dismisses peer-review, claiming his data is from peer-reviewed sources (although certainly not his statistically unsupportable conclusions), and that the post here isn't peer-reviewed.
The SkS post isn't peer-reviewed, of course - but it's reporting peer-reviewed conclusions (IPCC AR5, not to mention a more direct reference to Nuccitelli et al 2012). And that's the major difference - the conclusions regarding OHC described in the IPCC are supported by science and good practice, while Tisdale's conclusions are based on cherry-picking, misunderstandings of statistics, and confirmation bias towards his personal "it's all ENSO and climate shifts" framework.
garethman - Over on WUWT you wrote "I suppose Dana’s essay and Bob’s both seem pretty plausible...". I would have to disagree.
- Does the global warming 'pause' mean what you think it means?
garethman at 23:44 PM on 18 October, 2013Bob Tisdale has written an interesting response to this as published in the Guardian. http://wattsupwiththat.com/2013/10/18/dana-nuccitelli-cant-come-to-terms-with-the-death-of-the-agw-hypothesis/#comment-1452081 I would be really interested to see how Dana views this response and whether he feels it is valid.
- Why Curry, McIntyre, and Co. are Still Wrong about IPCC Climate Model Accuracy
Bob at 03:16 AM on 5 October, 2013Dana, Bob Tisdale comments on your post:
http://wattsupwiththat.com/2013/10/04/no-matter-how-the-cmip5-ipcc-ar5-models-are-presented-they-still-look-bad/
- What scientists SHOULD talk about: their personal stories
scaddenp at 07:39 AM on 25 September, 2013Lei, according to the fake skeptics, US has spent $79B on climate since 1979. You have to add in every satellite with a climate related instrument to get that but still, that's a lot of tax payer money. However, credible estimates of US subsides on fossil fuel range from $14B to $52B annually. If you thought taxes were such a big deal then surely killing these subsidies would be your priority?
I have simple no-tax solution to climate change - kill the subsidies and ban building of any more FF-powered powerstations unless all CO2 emissions are captured. This still leaves steel production (comparitively minor) and gives coal and thermal asset owners a much longer twilight than say asbestos asset owners got when science made that industry untenable. If you have other alternative plans that would mitigate CO2 without taxes, please post them here.
As to your personal climate position, then have you looked at what AGW regional predictions for you actually are? (in general, the wet get wetter and the dry get drier). However, I seriously wonder whether your personal circumstance is valid basis for voting for policy (and is absolutely irrelevant to whether a theory is true). You would vote on the basis that something was good for you even if you knew it was bad for the majority?? How do feel about the fact that those likely worst hit by climate change have contributed very little emissions to the problem? Is that right?
By that logic, I should be a denier as I get no climate funding but instead get petroleum funding. Come on people, kill my funding stream.
- Arctic sea-ice 'growth', a manufactured IPCC 'crisis' and more: David Rose is at it again
Alexandre at 02:17 AM on 11 September, 2013over and over again... Boring!
Watts in 2009: Arctic Sea Ice Increases at a Record Rate
Arctic Sea ice never shrinks, but recovers all the time.
- It's El Niño
dvaytw at 18:46 PM on 31 August, 2013Hey guys: Bob Tisdale’s crowing about the recent studies attributing slowed surface warming to La Nina:
“Anyone with a little common sense who’s reading the abstract and the hype around the blogosphere and the Meehl et al papers will logically now be asking: if La Niña events can stop global warming, then how much do El Niño events contribute? 50%? The climate science community is actually hurting itself when they fail to answer the obvious questions.
And what about the Atlantic Multidecadal Oscillation (AMO)? What happens to global surface temperatures when the AMO also peaks and no longer contributes to the warming?
The climate science community skirts the common-sense questions, so no one takes them seriously."
http://wattsupwiththat.com/2013/08/28/another-paper-blames-enso-for-the-warming-hiatus/#more-92630
How’s this for a summary argument against the Tisdalian hypothesis (if it constitutes one):
Tisdale and his crowd at WUWT seem to think temperature is just a number that just moves up and down somewhat arbitrarily, like a stock price. They don't conceptualize things properly in terms of heat energy, which can't be created or destroyed.
ENSO doesn’t generate, absorb or destroy heat. So when Tisdale says La Nina “stops” global warming and El Nino “contributes”, he’s got it totally wrong. Nothing is being stopped – the heat energy is simply being moved around. That's why we use the term "oscillation".And the proper question to ask Tisdale is simply, Where is the heat coming from?
I'm probably getting it all mucked up, as I have little science background, but I'm trying to put it in easy terms for non-sciencish people like myself.
Also, what do you think of this graphic from Hotwhopper:
ENSO without AGW:

ENSO without AGW:

- Watts' New Paper - Analysis and Critique
KR at 04:00 AM on 31 August, 2013Continuing from an unfinished page here:
As I pointed out on a WUWT thread that claimed adjustments were distorting the data,
It could be argued that it’s better to look at raw temperature data than data with these various adjustments for known biases. It could also be argued that it’s worth not cleaning the dust and oil off the lenses of your telescope when looking at the stars. I consider these statements roughly equivalent, and (IMO) would have to disagree.
Various replies (arguments from authority, etc) followed, mostly ignoring the rather copious literature on time of observation bias.
- Fasullo (2013) Seeks Some Levelheadedness Regarding Sea Level Variability
Matt Fitzpatrick at 07:50 AM on 24 August, 2013Ah yes, 2011. The year sea level drop was supposed to be the "final nail in the coffin" for global warming.
So many blogs claiming that the sea level dipping back to 2007-ish levels was somehow a lasting reversal of a decades long trend. Excoriating the climate models. Ridiculing NASA for—accurately, as it turns out—calling it a "pothole". Even halfway out of the "pothole" in 2012, some were still cherry picking those last few months to claim "no upward trend".
- An accurately informed public is necessary for climate policy
Barry Woods at 07:24 AM on 31 July, 2013Richard Betts's, a scientist was a strong opinion about this paper, he expressed it to Obama, and I stil haven't heard of the authors response?
But I think this will get lost now. I hope people are nice to Warren, despite this:
http://wattsupwiththat.com/2013/07/30/im-gobsmacked/
- An accurately informed public is necessary for climate policy
Barry Woods at 08:18 AM on 30 July, 2013As I'm in the UK and John Cook is in Australia (Dana the USA) - I'll have to wait (hopefully) to a reply to my question (comment 1) from the authors of the paper.
I'm a little surprised that Dana did not focuss on the first part Prof Mike Hulme's (founding director of Tyndall Centre for Climate Change) comment, as this has recieved the most attention around the blogs (in particular Prof Judith Curry and Prof Dan Kahan), it talks mainly about his view that the climate communications environment with the politicians, media and the public has changed post Copenhagen Conference (or climategate - 2009):
"Ben Pile is spot on. The “97% consensus” article is poorly conceived, poorly designed and poorly executed. It obscures the complexities of the climate issue and it is a sign of the desperately poor level of public and policy debate in this country that the energy minister should cite it. It offers a similar depiction of the world into categories of ‘right’ and ‘wrong’ to that adopted in Anderegg et al.’s 2010 equally poor study in PNAS: dividing publishing climate scientists into ‘believers’ and ‘non-believers’." - Prof Mike Hulme
http://blogs.nottingham.ac.uk/makingsciencepublic/2013/07/23/whats-behind-the-battle-of-received-wisdoms/#comment-182401
Prof Dan Kahan (Yale) made a similar observation of how succesful this consensus aproach communications would be likely to work, in a post when the paper was published:
"Annual "new study" finds 97% of climate scientists believe in man-made climate change; public consensus sure to follow once news gets out " - Prof Dan Kahan
http://www.culturalcognition.net/blog/2013/5/17/annual-new-study-finds-97-of-climate-scientists-believe-in-m.html
Prof Dan Kahan revisited this paper when Prof Mike Hulme's comment came to his attention, and seems to be agreeing with Hulme that the climate of communications has moved on:
"On the contrary, there’s good reason to believe that the self-righteous and contemptuous tone with which the “scientific consensus” point is typically advanced (“assault on reason,” “the debate is over” etc.) deepens polarization. That's because "scientific consensus," when used as a rhetorical bludgeon, predictably excites reciprocally contemptuous and recriminatory responses by those who are being beaten about the head and neck with it.
Such a mode of discourse doesn't help the public to figure out what scientists believe. But it makes it as clear as day to them that climate change is an "us-vs.-them" cultural conflict, in which those who stray from the position that dominates in their group will be stigmatized as traitors within their communities."
This is not a condition conducive to enlightened self-government." - Prof Dan Kahan
Is it not possible to change focus, and to attempt to discuss what we all agree on, going forward?
Evidence (if only ancedotal) that the comms climate has changed i the UK at least:
At the recent Oxford Union Interview with Prof Lindzen, with Mark Lynas (author Six Degreees, God Species and environmental writer/activist), Prof Lyles Allen - Oxford Uni - opposing, and David Rose - Mail on Sunday supporting, surprising the interviewer I think, they all agreed that current EU climate policies were pointless futile symbolic gestures, Myles Allen stated that he and Lindzen were in agreement about most of the science and Mark Lynas stated aterwards that they all agreed on 7 out of 10 things.
So is it time to work out what we all can agree on and move forward.
Mike Hulme suggests in this comment that the world has changed and despairs at the polarised and quality of the public debate.
Consider that Prof Mike Hulme (Tyndall Centre, UEA) was quoted in a climategate email of trying to keep sceptics like Prof Stott off the BBC airwaves, and Mark Lynas was writing 6 years ago that climates sceptics were the moral equivalent of Holocaust deniers, that surely is an indication of how things have changed?
I had lunch with Mark Lynas last year and he expressed surpise at the contents of the full Doran survey, an earlier 97% consensus paper (especially the appendices,) he is the unatributed environmental writer here in the WUWT article below, he had often quoted it, but had never read - The Consensus on the Consensus - M Zimmerman (the survey cited by Doran)
http://wattsupwiththat.com/2012/07/18/what-else-did-the-97-of-scientists-say/
Both Hulme and Kahan are saying that yet another 97% consensus paper is unlikely to change anything and perhaps a new approach is required, even psychologist Dr Adam Corner is trying to broaden the tent, to include conservatives (UK sort) who whilst many care about the environemnet, Dr Adam Corner (Cardiff Uni, Guardian, COIN, PIRC, formerly Green Party MP candidate, and Friends of the Earth) recognises that the issue has become symbolic and identified with the left, and needs a broader viewpoint to actually ever achieve anything with respect to policy.
http://www.guardian.co.uk/environment/2013/jun/13/sceptical-tory-voters-climate-change
If Mark Lynas (who put Lindzen into a who is who of Climate Change Deniers - (with Exxon fossil fuel links innuendo) in the New Statesmen a decade ago and equated sceptics with moral equivalent of Holocause deniers ( 6 years ago) can sit down with me ( a Watts Up With that very occasional Guest Author) civily and have lunch, discuss, agree to disagree or even agree to agree on many things (I even 'know where he lives' - ref Greenpeace, he had a bad back, so I gave him a lift), have things moved on?
Or after the Lindzen debate, when Mark Lynas was asked, do you think Prof Lindzen's scence is in anyway influenced by any fossil fuel infuence, he said highly highly unlikely, Prof Myles Allen was really offended that Lindzen had been asked this sort of question (repeatably, a lot was cut from the video edit) , Myles (frustrated with the interviewer) even saying Exxon paid for my ticket once, can we move on, and that consensus was not getting us anywhere , is that a not a sign that the climate of communications has moved on (in the UK at least)
So maybe it is time to accept Roy Spencer, Prof Lindzen, Anthony Watts and Andrew Montford, etc into the consensus? As they all agree that the Earth has warmed in the last 200 hundred years, that CO2 is a green house gas, and that man contributes to climate change.
We can then discuss what we all disagree about, which I think is mainly policy and the hot topics of climate science, senitsivity and the reason for the hiatus in temps in the last decade or so.?
And also perhaps it is time to drop Deniers Disinformation Databases (Desmogblog) or Deniers Halls of Shame (Rising Tide, Campaign Agansit Climate Change) as a tool in the communications debate (it is ever so counterproductve)
Thoughts?
(sorry the comment was a bit long)
links:
Prof Myles Alen comments about Prof Lindzen treatement by the interviewer (comment 23):
http://www.bishop-hill.net/blog/2013/3/9/lindzen-at-the-oxford-union.html
the Oxford Union Lindzen interview (Allen, Rose, Lynas)
http://www.aljazeera.com/programmes/headtohead/2013/06/201361311721241956.html
- Update on BC’s Effective and Popular Carbon Tax
Russ R. at 02:11 AM on 26 July, 2013Alexandre:
Do you have any data showing the significance of this side effect on the province's overall fossil fuel consuption?
That would require data on how many liters of vehicle fuel were "imported" back into BC from Washington, Alaska, Yukon, and Alberta border crossings. I'm pretty sure that no such data exist.
If you'd like a ballpark number, a good place to start would be with the Business Council of British Columbia who estimate that $2.0-2.6 billion in retail revenue is now being lost to cross border visits annually, of which a sizeable amount is gasoline (http://www.bcbc.com/content/879/PPv20n2.pdf). Obviously not peer reviewed, so take with a grain of salt.
From those figures, Willis Eschenbach estimates the imported gasoline volume at around 100 million gallons annually, or more than 50% of the reported reduction in total domestic fuel sales (http://wattsupwiththat.com/2013/07/12/fuel-on-the-highway-in-british-pre-columbia/ and http://wattsupwiththat.com/2013/07/13/the-real-canadian-hockeystick/). Again, grain of salt.
I personally think he overestimates the actual amount due to some aggressive assumptions, but even if he's off by a factor of two, it would still be a significant amount of leakage that should not be ignored, especially since people are burning extra gas (and emitting more GHGs) to realize those cost savings.
I'd guess it just applies to cases where you have very near towns on both sides of the border, quantitatively very marginal.
I assume you're not from BC, because the distance from the biggest city in the province (Vancouver) to the nearest US border crossing (Point Roberts), happens to be only 25 km (17 miles) from the Oak St. Bridge in Vancouver to the Shell Station in Point Roberts. Traffic is usually terrible, but if you're on passing through the Tsawassen Ferry Terminal (to get to or from Vancouver Island), then Point Roberts is just around the corner.
- Levitus et al. Find Global Warming Continues to Heat the Oceans
dvaytw at 02:07 AM on 25 July, 2013Wattsup has a blog post about this wherein he claims:
"The nice thing about the ocean is that the temperature and heat content are mathematically related by the fact that it takes about 4 megajoules to warm a tonne of water by 1°C. This lets us convert from heat content to temperature and back as needed.
Remember that the three layers have very different volumes. So a terajoule of energy added to the shallow 0-100 metre layer will warm it more than the same terajoule of energy added to the more voluminous 700-2000 metre layer. Fortunately, NOAA also provided the ocean depths on a 1° x 1° grid, so we can calculate the volume of each of the layers. Once we know the volumes, we can calculate the temperature changes. Figure 4 shows the same data as in Figure 3, except expressed as a temperature change rather than as a change in heat content."
http://wattsupwiththat.com/2013/05/10/the-layers-of-meaning-in-levitus/
Comments on that?
- Charles Krauthammer's flat-earther global warming folly
mandas at 14:13 PM on 11 July, 2013John
I know this is off topic, so I apologise for that. But I had to provide this link to this thread at WUWT. The conspiracy theorists are out in force today: http://wattsupwiththat.com/2013/07/10/macquarie-university-responds-to-murry-salby-termination-issue/#comment-1361244
- The Consensus Project self-rating data now available
Tom Curtis at 08:04 AM on 11 July, 2013dana @9, the claim that "skeptics" are "more likely to pretend to endorse it in the abstract while claiming they rejected it in the full paper" is not supported by Poptech' sample. One of Poptech's sample (Scaffeta) outrageously misrepresents the nature of the scientific consensus so that he can falsely claim an error in the abstract rating. Shaviv's abstract, however, concludes:
" Subject to the above caveats and those described in the text, the CRF/climate link therefore implies that the increased solar luminosity and reduced CRF over the previous century should have contributed a warming of 0.47 ± 0.19°K, while the rest should be mainly attributed to anthropogenic causes. Without any effect of cosmic rays, the increase in solar luminosity would correspond to an increased temperature of 0.16 ± 0.04°K."
The increase over the 20th century was 0.7 K, so the paper attributes greater than 50% of warming to natural causes under an assumption the authors are willing to entertain. That indicates the paper should be rated (IMO) as at most a 5 (implicitly rejects), and certainly not, as it was actually rated, at 2 (Explicitly endorses).
In like manner, Idsos' abstract describes the impact of enhanced growth on the seasonal cycle in CO2 and should probably (and at most) have been rated neutral, but was actually rated 3 (implicitly endorses).
These two examples represent genuine mistakes. Of course, Poptech has only found two genuine errors from among a very large number of abstracts rated as endorsing the consensus. As always, he avoids mentioning the denominator.
- It's cooling
scliu94 at 12:59 PM on 29 June, 2013What do you guys make of this? http://wattsupwiththat.com/2013/03/11/is-ocean-heat-content-data-all-its-stacked-up-to-be/
- CO2 effect is saturated
Tom Curtis at 11:08 AM on 20 June, 2013I have been looking more carefully at the PDF which is the detailed explanation of the WUWT story which is the basis of Stealth's comments. The inconsistency and, frankly, the dishonesty of the author, Ed Hoskins, is shown in the fifth chart of the PDF (page 3). It purports to show the expected temperature response to increases in CO2 according to a group of "skeptics" (Plimer, Carter, Ball, and Archibald), and three "IPCC assessments" by three authors. It also shows a "IPCC average", but that is not the average value from any IPCC assessment, but rather the average of the three "IPCC assessments" by the three authors.
The first thing to note about this chart is that it gets the values wrong. Below are selected values from the chart, with the values as calculated using the standard formula for CO2 forcing, and using their 100-200 value as a benchmark for the temperature response:
Concentration Skeptic Lindzen Krondratjew Charnock “IPCC” Mean IPCC
100-200______0.29____0.56____0.89________1.48______0.98_______3
200-300______0.14____0.42____0.44________1.34______0.73
Calc 200-300_0.17____0.33____0.52________0.87______0.57_______1.76
400-1000_____0.15____0.7_____1.19________1.78______1.22
Calc 400-1000_0.38___0.74____1.18________1.96______1.29_______3.97The "Calc" values are those calculated using the standard formula for radiative forcing, with a climate sensitivity factor determined by the claimed temperure response for a doubling of CO2 from 100-200 ppmv. The '"IPCC" Mean' column is the mean of the three prior columns.
Clearly the values in the table are not consistent with the standard formula, typically overestimating the response from 200-300 ppmv, and underestimating the response from 400-1000 ppmv. That pattern, however, is not entirely consistent, being reversed in the case of Kondratjew. Other than that odd inconsistency, this is just the same misrepresentation of temperature responses shown in my 211 above.
More bizarre is the representation of the IPCC by Lindzen, Kondratjew and Charnock. As can be seen, their values, and the mean of their values significantly underrepresent the best estimate of the IPCC AR4 of 3 C per doubling of CO2. That is a well known result, and the misrepresentation can have no justification. It especially cannot have any justification given that neither Kondratjew nor Charnock are authors (let alone lead authors) of any relevant chapter in the IPCC AR4. Nor are they cited in any relevant chapter of the IPCC AR4. Presenting their work as "IPCC assessments" is, therefore, grossly dishonest.
Moving on, Hoskins shows another chart on page 2, which helps explain at least one cause of his error. It is a reproduction of a chart produced by David Archibald, purportedly showing the temperature response for succesive 20 ppmv increases in CO2 concentration. Looking at Archibald's article, he claims it is a presentation, in bar graph form, of a chart posted by Willis Eschenbach on Climate Audit:

As a side note, the forcing shown is 2.94 log(CO2)+233.6, and hence the modtran settings used do not correspond to the global mean forcing. The method used by Eschenbach, therefore, cannot produce a correct value for the global mean forcing of CO2. As it happens, his values produce a forcing per doubling of CO2 of 2 W/m^2 per doubling of CO2, and hence underestimates the true forcing by 46%. Note, however, that it does rise linearly for each doubling of CO2, so Hoskins has not even mimmicked Eschenbach accurately.
Far more important is that it is a plot of the downward IR flux at ground level with all non-CO2 green house gases (including water vapour) present. The IPCC, however, defines 'radiative forcing' as "... the change in net (down minus up) irradiance (solar plus longwave; in W m–2) at the tropopause after allowing for stratospheric temperatures to readjust to radiative equilibrium, but with surface and tropospheric temperatures and state held fixed at the unperturbed values". (My emphasis.)
It does so for two reasons. First, the theory of radiative forcing is essentially a theory about the energy balance of the planet. Therefore it is not the downward radiation at the surface that is at issue, but the balance between incoming and outgoing radiation at the top of the atmosphere.
Second, the temperature at the tropopause and at the surface are bound together by the lapse rate. Therefore any temperature increase at the tropopause will be matched by a temperature increase at the surface. Given reduced outward radiation at the tropopause, the energy imbalance between incoming solar radiation and outgoing IR radiation will result in warming at the surface and intermediate levels of the atmosphere. Adjustments in the rate of convection driven by temperature differences will reestablish the lapse rate, maintaining the same linear relationship between tropopause and surface temperature (ignoring the lapse rate feedback). The net effect is that the same effective temperature increase will occure at all levels, resulting in a larger downard radiation at the surface than the initial change at either the tropopause or the surface.
So, Eschenbach (and Hoskins) derive their values incorrectly because they simply do not understand the theory they are criticizing, and which is accepted without dispute by knowledgeable "skeptics" such as Lindzen and Spencer. They are in the same boat of denying simple physics as are the "skydragon slayers" who Watts excoriates. Watts, however, publishes pseudo-scientific claptrap on the same level as the "skydragon slayers" on a daily basis, however, because he also is completely ignorant of the theory he so vehemently rejects.
- A Miss by Myles: Why Professor Allen is wrong to think carbon capture and storage will solve the climate crisis
Andy Skuce at 07:33 AM on 15 June, 2013Sudden_Disillusion @15 : I did read about the Savory talk in several places, but I also heard it harshly criticized. For example: James McWilliams in Slate and Chis Clarke at KCET.
I haven't looked at this issue in any detail myself, but a quick glance at those critiques leaves me skeptical of Savory's claims.
Unusually, Savory's talk was commented on favorably both at Climate Denial Crock of the Week and at Watt's Up With That. At WUWT, contrarian Tim Ball wrote a rebuttal.
My co-author, rustneversleeps, made a comment at Planet3.0 on the carbon sequestration potential of Savory's methods.
- 2013 SkS Weekly Digest #23
soo doh nim at 18:22 PM on 11 June, 2013What do you guys make of this:
http://wattsupwiththat.com/2013/06/06/climate-modeling-epic-fail-spencer-the-day-of-reckoning-has-arrived/
- CO2 effect is saturated
Tom Curtis at 22:15 PM on 10 June, 2013Elsewhere, SASM asked some questions that were snipped for being off topic. They are on topic here, so I will address them. He says:
"Is it true that CO2 is nearly fully saturated in the IR bands? I have read (http://www.skepticalscience.com/saturated-co2-effect.htm) and it clearly shows that CO2 is dimming some IR to space in the 700 to 760 wavenumber bands, which is mid-wave IR around 13-14 um. Brightness is reduced by about 1.5K, but what is this in watts/m^2 or how much warming does this blockage produce? My speculation is that this is not very much. WUWT has a post (http://wattsupwiththat.com/2013/06/08/by-the-numbers-having-the-courage-to-do-nothing/#more-87809) that states that 94.9% of the IR is absorbed by 400 ppm CO2. The increase from 300 ppm to 400 ppm (the amount from early 1900 until now) only blocks 2.3% more than what is naturally occurring (i.e., 92.6% absorption for 300 ppm CO2). Do you all agree with these numbers, and if not what numbers do you have? How much additional warming is directly caused by the increase from 280 ppm to 400 ppm today? Don’t include forcing, feedback, or anything like that – just effects of CO2"
Turning to the WUWT post, it is complete nonsense. It does not indicate how the values of any of its tables were determined, and makes absurd false statements such at that at least 200 ppmv is required in the atmosphere for plant life to grow (CO2 concentrations dropped to 182.2 ppmv at the Last Glacial Maximum, giving the lie to that common claim).
More importantly, the claim that the "...proportional values shown above present are universally accepted by skeptics and Global Warming alarmists alike..." (PDF) is complete bunk. They are not accepted universally by AGW "skeptics" and are accepted by no defenders of climate science. Specifically, the "universally accepted" formula for radiative forcing is RFt = 5.35* ln(ct/c0). That is, the radiative forcing due to CO2 at time, t, relative to time, 0, equals 5.35 times the natural log of the CO2 concentration at time t divided by the CO2 concentration at time 0. The equilibrium temperatue response to that radiative forcing is a linear function of the radiative forcing, so that it follows the same logarithmic relationship.
An immediate consequence of that logarithmic relationship is that the temperature response for a doubling of CO2 concentration is the same for any doubling of CO2 concentration across the range over which that formula is valid (it clearly does not apply for very low values of CO2). That is, if the temperature response for increasing CO2 from 100 to 200 ppmv is X, then the temperature response for increasing it from 200 to 400, or 300 to 600, or 400 to 800, or 500 to 1000 ppmv will also be x.
Contrary to that relationship, however, Hoskins shows the increase from 100 to 200 as being 10.1% of some unknown value; that from 200 to 400 as being 7.3% of the same value; that from 300 to 600 as being 5.2%; that from 400 to 800 as being 4.6%, and that from 500 to 1000 as being 2.1% (PDF). As such his tables contradict the best known, and most widely accepted formula in climate science. Even worse, he then goes on to say that "beyond 1000+ ppmv the effect of increasing levels of CO2 can only ever be
absolutely minimal even if CO2 concentrations were to increase indefinitely." (PDF) That claim is the basis of setting the temperature response to 1000 ppmv as 100%, but is complete bunk. As per the standard formula, the temperature response of an increase in CO2 level from 1000 to 2000 ppmv is the same as the the temperature response for an increase from 100 to 200 ppmv.Hoskins does not even apply his formula consistently. Based on his first table, the increase in temperature for a given increase in CO2 concentration expressed as a ratio of earlier increases should be constant regardless of whether you use IPCC values, or "skeptical" values. Yet in his second table (WUWT post) that condition is not met. In other words, his calculated temperature responses in his second table are inconsistent with those in his first table.
Anyway, with the standard IPCC climate sensitivity of 3 C per doubling of CO2, increasing CO2 from 400 to 1000 ppmv will increase temperature by 3.9 C. That will represent a 5.4 C increase over pre-industrial levels - an increase equivalent to the difference in temperature between the coldest period of the last glacial and the pre-industrial.
- Imbers et al. Test Human-Caused Global Warming Detection
StealthAircraftSoftwareModeler at 10:13 AM on 10 June, 2013DSL @43. It seems my comment may have been deleted and I am not sure why. I did ask some questions and you seemed to answer one of them, so it was posted for some time. Perhaps the moderator thought my post was an ad hominem or not on topic or inflammatory. If so, I apologize. I’m not looking to start any flame wars and I am honestly looking for a good discussion.
Let me just completely back up and ask some basic questions:
(-snip-). Thanks! Stealth
- The anthropogenic global warming rate: Is it steady for the last 100 years? Part 2.
Dikran Marsupial at 17:56 PM on 5 June, 2013KK Tung wrote "Of course when there is no AMO in your data you are not going to find an AMO using the method of multiple linear regression analysis (MLR)."
You clearly still do not understand the point of the thought experiment. In the thought experiment there is no AMO influence on observed temperatures, but your MLR procedure DOES find one, even though it doesn't exist. That is the problem.
- The 5 characteristics of global warming consensus denial
RomanM at 04:08 AM on 1 June, 2013I would normally not comment on this particular blog site, however, this post appears to reference some work that I did on the sole statistical "analyses" in the paper:
Some blogs advanced a related logical fallacy by claiming that this shows 'an increase in uncertainty.' However, if uncertainty over the cause of global warming were increasing, we would expect to see the percentage of papers rejecting or minimizing human-caused global warming increasing. On the contrary, rejection studies are becoming less common as well. That scientists feel the issue is settled science actually suggests there is more certainty about the causes of global warming.
Despite the shortage of expected tabular results of the various aspects of the data, it was possible to sufficiently reproduce the numeric data from Figure 2(b). You can plot the numbers yourself. I commented on this on the referenced Watts' thread in response to another comment:
The number of papers rejecting AGW is increasing with almost half of them coming in the last five years of the study period. The percentage of such papers annually has indeed been decreasing because of the increases in the numbers of papers in the other two categories.
I agree with some of the other comments that journal gatekeeping may have played some role in this process, but it seems much more obvious that the major reason for the proliferation of global warming and climate change papers is the many billions of dollars which have been allotted over the last 20 years to such research. (-snip-).
My original criticism of the paper was that the regressions calculated and reported in the paper were inappropriately done as they were ignoring the changing numbers of papers in the various years. Perhaps you or someone else could comment on why my critiques of the regressions are wrong and/or why this shortcoming should not be corrected in the publication itself.
- Distinguishing Between Short-Term Variability and Long-Term Trends
Djon at 02:32 AM on 8 May, 2013Dana - I suspect John had http://wattsupwiththat.com/2012/08/13/when-will-it-start-cooling/ in mind, though it's nowhere near as dramatic a drop as McLean was foolish enough to predict and it looks to me as though Archibald left himself a fair bit of wiggle room to claim, at least for a few more years, that the failure of cooling to start when he said it was likely to doesn't invalidate his longer term prediction of major cooling over the course of the next few solar cycles.
- Participate in a survey measuring consensus in climate research
keitho at 01:13 AM on 6 May, 2013I do hope that the same chicanery that happened with the last attempt at profiling doesn't happen again. Shub Niggurath has done some analysis on that paper and it doesn't look good . .
http://wattsupwiththat.com/2013/05/05/lewandowsky-et-al-2013-surveying-peter-to-report-on-paul/#comment-1297865
- Roy Spencer's Catholic Online Climate Myths
Carlton Benson III at 17:28 PM on 2 May, 2013Comments also appeared here: http://wattsupwiththat.com/2013/05/01/nuccitelli-gets-a-bruising-by-the-factual-hand-of-monckton/
- Nils-Axel Mörner is Wrong About Sea Level Rise
Tom Curtis at 11:24 AM on 2 May, 2013In a prior post, I reffered to a photoshopped picture used by Morner as "evidence" of the lack of sea level rise in the Maldives. I have been unable to find the scientific paper in which it was located, and so must withdraw the claim that it appeared in such. Never-the-less, Morner has frequently used this tree in his presentations about sea level rise, including at WUWT and in an interview for 21st Century Science and Technology (PDF).
The story Morner gives is that he knew of the tree from visits to the Maldives in the 50s, and that its continued survival in the tide zone is evidence that sea levels have not risen. That basic story has some embellishments I will discuss below. Two accompany the story, four different pictures (plus B&W variants) of Morner's Tree are used. There are two grainy "before pictures". One of those has a mark identifying it as a propriety photograh in the lower right corner, strongly suggesting it is a stock photo and has no relationship to Morner's tree (other than species and isolated location). There are also to "after photos", of which one, due to the distinct slope of the intertidal zone where it is located, is also obviously not the same tree as the other. It is not at all clear that either of these dubious photos was actually provided by Morner, although both have circulated among climate "skeptics" as illustrating Morner's tree.
The two "genuine" photos are produced below from WUWT. The "before" tree is in the lower left corner, the "after tree" in the upper right corner.
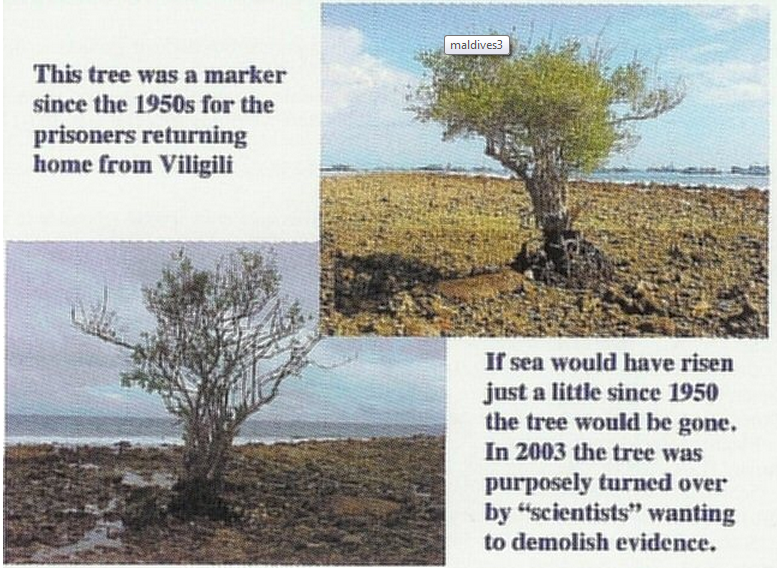
The first thing to notice is that they are not identifiable as the same tree. Indeed, if the large oval stone in the left foreground of the upper picture is the same stone as that in the right midground of the lower picture, they are not the same tree. The upper right tree is far closer to the stone than is the one in the lower right. Probably the stones are merely similar, rather than the same, in which case the pictures are still not of the same tree.
That, however, is a minor point.
Far more significant is the photoshopping of the upper right picture. This is far clearer in the version of the picture from the 21st Century Science and Technology interview, used as the basis of the picture below.

If you look closely at the picture you can see two edit lines where two pictures have been grafted together. The first in order of editing (marked by the orange arrow) is shown by the sharp cut off of the tree's shadow along with a subtle change of colouration in the stones. I am not expert on imaging fraud, so it is possible that I am wrong about that one, although I doubt it.
The second edit line is definite. Not only are the rock colours on either side of the line clearly distinct, but there is a clear discontinuity between the roots and lower branches of the tree and the leaves and upper branches. The discontinuity even orphans a sawn of branch on the left side of the tree, leaving it apparently floating in mid air.
Not only is the photo fishy, so is the attached story. The tale that the island on which the tree is located, Viligilli (or Villingili) is a prison island falls on the simple fact that no prison is located on the island (see also google map). The notion that the tree was uprooted and then replanted fails on the fact that the roots shown are solidly attached to the earth below, with no disturbance of that Earth. And with that part of the tale, so also goes the theory that Australian science students are both vandalous and fraudulent.
DJ at WUWT quotes a discussion of the story by a purported Maldivian. That anonymous source claims Viligilli was a prison island until 1973, which rescues part of Morner's story. They also go on to say, however:
"The tree is called ironwood (Pemphis acidula). It’s known for its resilience against salt and is usually the dominant species in very high wave energy and salt spray zones. Having traveled to over 600 islands in Maldives I have witnessed a number of such one ‘tree’s’. The tree in question simply has withstood erosion in the last 10 or so years while weaker trees around it fell. Aerial photographs of 1968/1969, 1998 and 2004 shows that the area is relatively stable with occasional erosion. There have been a number of trees in this specific area of the island like the one in question which have remain separated from the island. It is part of the erosion process. The tree most likely was there 50 years ago but it certainly was not alone as it is now. It is these kinds of adhoc observation based conclusions rather than rigorous assessments which make me question the findings of Morner."
(My emphasis)
If we accept the authenticity of this Maldivian (and hence the partial corroboration of Morner's account) then we must also accept their expertise on such isolated trees.
Indeed, on first principles we can see that account to be correct. If sea level is falling, the intertidal zone will be in the process of being colonized by a species (Pemphis acidula) that can grow in that region. We would consequently expect to see few mature trees, but a significant number of immature trees colonizing the zone. A stable sea level would be evidenced by a number of mature trees in thickets, as is common for the species. Only with rising sea levels would sole mature survivors of former thickets remain. So, in as much as Morner's photoshopped picture is evidence of anything, it is evidence of rising sea levels. But it takes the sort of "skepticism" that can't even notice such blatant photoshopping to not notice that.
- The Fool's Gold of Current Climate
John Fisher at 07:10 AM on 5 April, 2013Anthony Watts made the same mistake 3 years ago, commenting
"Actually a warmer planet with more C02 will in fact improve growing conditions, which is why that exact growing environment is created in production greenhouses."
Conditions in production greenhouses are monitored and modulated (drip lines, drainage, ventilation, etc). We can't simply open a 'space window' to let more heat escape!
Matt Ridley's talk reminds me of the Swedish politician who remarked--from his perspective--that a little global warming would be a good thing. He was later berated by an Israeli minister who called him self-interested twit.
More than 100 comments found. Only the most recent 100 have been displayed.
More than 100 comments found. Only the most recent 100 have been displayed.


? What happens to global surface temperatures when the AMO also peaks and no longer contributes to the warming? The climate science community skirts the common-sense questions, so no one takes them seriously. http:/wattsupwiththat.com/2013/08/28/another-paper-blames-enso-for-the-warming-hiatus/#more-92630 How’s this for a summary argument against the Tisdalian hypothesis (if it constitutes one): ENSO doesn’t generate or absorb heat. That’s why it’s called an oscillation. So when Tisdale things La Nina “stops” global warming and El Nino “contributes”, he’s got it totally wrong. Nothing is being stopped – it’s simply being moved around. Also, what do you think of this graphic from Hotwhopper: ENSO without AGW: http:/4.bp.blogspot.com/-bqjLCcFeHxI/UYksArpSe-I/AAAAAAAABKI/UiKbMz4jn_4/s400/flat.png ENSO without AGW: http:/3.bp.blogspot.com/-Ng6yjblMNso/UYksIWEDsDI/AAAAAAAABKQ/XAV0TpJj7Zk/s400/rising.png)
THE ESCALATOR

(free to republish)