


 Arguments


Does the global warming 'pause' mean what you think it means?
Posted on 18 October 2013 by dana1981
![]() In their study of media coverage of the 2013 Intergovernmental Panel on Climate Change (IPCC) report, Media Matters for America found that nearly half of print media stories discussed that the warming of global surface temperatures has slowed over the past 15 years. While this factoid is true, the question is, what does it mean?
In their study of media coverage of the 2013 Intergovernmental Panel on Climate Change (IPCC) report, Media Matters for America found that nearly half of print media stories discussed that the warming of global surface temperatures has slowed over the past 15 years. While this factoid is true, the question is, what does it mean?
Many popular climate myths share the trait of vagueness. For example, consider the argument that climate has changed naturally in the past. Well of course it has, but what does that tell us? It's akin to telling a fire investigator that fires have always happened naturally in the past. That would doubtless earn you a puzzled look from the investigator. Is the implication that because they have occurred naturally in the past, humans can't cause fires or climate change?
The same problem applies to the 'pause' (or 'hiatus' or better yet, 'speed bump') assertion. It's true that the warming of average global surface temperatures has slowed over the past 15 years, but what does that mean? One key piece of information that's usually omitted when discussing this subject is that the overall warming of the entire climate system has continued rapidly over the past 15 years, even faster than the 15 years before that.
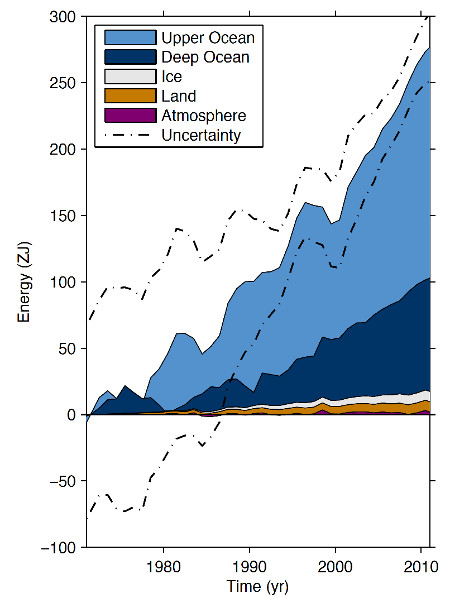
Energy accumulation within distinct components of Earth’s climate system from 1971 to 2010. From Chapter 3 of the 2013 IPCC report.
The speed bump only applies to surface temperatures, which only represent about 2 percent of the overall warming of the global climate. Can you make out the tiny purple segment at the bottom of the above figure? That's the only part of the climate for which the warming has 'paused'. As the IPCC figure indicates, over 90 percent of global warming goes into heating the oceans, and it continues at a rapid pace, equivalent to 4 Hiroshima atomic bomb detonations per second.
Another important piece of oft-omitted information: while the warming of surface temperatures was relatively slow from 1998 to 2012, it was relatively fast from 1990 through 2006. Over longer time frames, for example from 1990 to 2012, average global surface temperatures have warmed as fast as climate scientists and their models expected.
So what's changed over the past 10 to 15 years? The IPCC attributes the recent slowing of surface temperatures to a combination of external and internal climate factors. For example, solar activity has been relatively low and volcanic activity has been relatively high, causing less solar energy to reach the Earth's surface. At the same time, we're in the midst of cool ocean cycle phases, for example with a preponderance of La Niña events since 1999. A number of recent studies have suggested that most of the recent slowing of surface warming is due to these ocean cycles.
What does that mean for the future? It means more global warming. A number of papers from climate 'skeptics' have sought to fit the surface temperature measurements with various cycles. Some have tried to attribute these changes to astronomical cycles, others to ocean cycles, others to 'stadium waves'. Ultimately these papers are just trying to explain the short-term wiggles in the data. For example, as Marcia Wyatt, lead author of the recent Wyatt & Curry 'stadium waves' paper explained,
"While the results of this study appear to have implications regarding the hiatus in warming, the stadium wave signal does not support or refute anthropogenic global warming. The stadium wave hypothesis seeks to explain the natural multi-decadal component of climate variability."
In other words, the surface temperature speed bump is mainly due to the short-term influences of natural climate variability on top of the long-term human-caused warming trend. As Mark Boslough noted, it all boils down to physics and conservation of energy. We continue to increase the greenhouse effect by burning more and more fossil fuels. The extra energy trapped in the Earth's climate system by that increased greenhouse effect can't just disappear, it has to go somewhere. Right now it just so happens that more is going into the oceans, whereas in the 1990s more was going into the atmosphere.
Some have asked if the 'pause' is real or a result of cherry picking. The answer is that there is a 'pause' if the data are cherry picked. First we have to cherry pick the 2 percent of global warming represented by surface temperatures and ignore the other 98 percent. Then we have to cherry pick a sufficiently short time frame to find a flat trend.
Average of NASA GISS, NOAA NCDC, and HadCRUT4 monthly global surface temperature anomalies from January 1970 through November 2012 (green) with linear trends applied to the time frames Jan '70 - Oct '77, Apr '77 - Dec '86, Sep '87 - Nov '96, Jun '97 - Dec '02, and Nov '02 - Nov '12.
Despite this double cherry picking, ignoring 98 percent of global warming, and despite the sun and volcanoes and ocean cycles all acting in the cooling direction over the past decade, the best climate contrarians can do is find a flat 10-year surface temperature trend. Can you guess what's going to happen the next time the oceans shift to a warm cycle? That's the thing about cycles – they're cyclical.
Regarding the 'pause', Inigo Montoya would likely tell climate contrarians,
"You keep using that word. I do not think it means what you think it means."
This post has been incorporated into the rebuttal to the myth IPCC admits global warming has paused.


The fairly simple point that occurs to me is the temperatures overall have not fallen, if they have not fallen the trend is still for warming, even if this slowdown in rate lasted a thousand years.
Bob Tisdale has written an interesting response to this as published in the Guardian. http://wattsupwiththat.com/2013/10/18/dana-nuccitelli-cant-come-to-terms-with-the-death-of-the-agw-hypothesis/#comment-1452081 I would be really interested to see how Dana views this response and whether he feels it is valid.
garethman - "Interesting", in the Bob Tisdale sense. Or nonsense, really.
Tisdale, as usual, focuses on extremely short time periods (2005-2013 for ocean temps, 2000-2013 for air temps, neither of which has statistical significance), on small regions of the world oceans rather than the globe as a whole (cherry-picking), on surface sea temps only while seemingly dismissing the energy accumulation in the volume (2D vs. 3D cherry-picking), disses the satellite temps while ignoring their agreement with surface temperature data sets, tosses out the old 'can't trust the models' myth, etc.
He even attempts to toss all of the ocean heat content data by inappropriate scale comparisons - yes, the energy throughput of the climate is very large, but no, that doesn't block our ability to measure changes in temperatures.
Quite frankly, having looked at Tisdale's writings before, I would consider this one more (and rather boring) Gish Gallop of myths and misunderstandings.
Many Thanks for your response KR.
As usual Tisdsale is still focusing on surface temperatures and ignoring ocean temperatures. He does have a valid point that 0-700m ocean warming has slowed a bit, but only because 700-2000m ocean warming has accelerated. He's guilty of the same type of cherry picking I discussed above, just regarding surface ocean temps in addition to surface air temps.
I'm confused how Tisdale's response could possibly be qualified as "interesting" -- he has already written the same before, Nuccitelli here is pointing out Tisdale (among others) is wrong in several ways, Tisdale responds by ... making exactly the mistakes that Nuccitelli is pointing out in this article?!
Tisdale also dismisses peer-review, claiming his data is from peer-reviewed sources (although certainly not his statistically unsupportable conclusions), and that the post here isn't peer-reviewed.
The SkS post isn't peer-reviewed, of course - but it's reporting peer-reviewed conclusions (IPCC AR5, not to mention a more direct reference to Nuccitelli et al 2012). And that's the major difference - the conclusions regarding OHC described in the IPCC are supported by science and good practice, while Tisdale's conclusions are based on cherry-picking, misunderstandings of statistics, and confirmation bias towards his personal "it's all ENSO and climate shifts" framework.
garethman - Over on WUWT you wrote "I suppose Dana’s essay and Bob’s both seem pretty plausible...". I would have to disagree.
Thanks KR, I did indeed write that, but that is from a lay persons perspective. I wanted to check how accurate his essay was and a useful way of doing that is to get the experts here to dig a bit deeper and explain any mistakes in a way that I, as a lay person will be able to make sense of. The word interesting by the way can be applied to many things, they do not have to be correct! In some ways it is really difficult and long winded to check out all the facts in any essay item by item on both sides, thats why it is really helpful to have critical appraisals in this way by people who have previous experience.
garethman - That's a very good point, rhetorically "plausible" often has little connection with "likely" or "reasonable". Folks like Monckton make it a way of life, sounding entirely plausible while under closer examination what they are saying is utter nonsense. (Sounds great - just don't think about it...)
General items that jumped out at me in Tisdale's piece, which I've come to associate with unsupportable 'skeptic' nonsense:
I may have have missed a few bits of nonsense - I didn't bother to check every assertion. But when there are so many red flags, I consider it safe to conclude that the article containing those errors isn't saying much worth reading.
Here's Tamino's take on one of Tisdale's recent posts:
http://tamino.wordpress.com/2013/10/05/bob-tisdale-pisses-on-leg-claims-its-raining/
[Sph] This is a borderline violation of the Comments Policy (no links without context). As it clearly relates directly to an analysis of Tisdale it is applicable (although, too, the whole Tisdale thing is in in danger of wandering off-topic), but in the future, please provide your own (better clarified) context around such a link.
Sou at Hot Whopper has posted a pleasingly concise explanation of the major fallacy of Bob Tisdale's attempt to reply to Dana:
Bob Tisdale rejects the greenhouse effect
The seemingly rude title of the piece is unavoidable due to Tisdale's conclusions; the title is not impolite but is neutrally descriptive of the logical box Tisdale has constructed around himself.
dana @ #5, would it make sense that as the oceans warm overall, upper layers might cool? I remember reading years ago (can't remember where, sorry) that as the ocean warms it mixes better and becomes less stratified. I assume that's still true although I don't know what sort of temperature increment results in what sort of degree of mixing. But it occurred to me at the time that as the deeper ocean warmed, if it mixed better with the layer above 2000m then that might cool the upper layer (for a while), given that the volume of water below 2000m is so huge by comparison to the thin upper layer, and relatively cold, so a tendency in the direction of thermal equilibrium might reduce upper layer temperatures.. Is that a possibility? Sort of analogous to the weakening jet stream resulting in weather which is warm by Arctic standards but very cold by British or European standards dumping snow and ice all over Britain and Scotland and making the deniers happy because of the snow in their back garden.
caroza @12
hmmh, an analogy may be a bedroom: the person in bed is the heat source, the blanket the top layer of the ocean, the air in the room all deeper layers; the bedroom is thermally well insolated. Findings, with heat source constant:
I just rebutted a piece by a local TV meteorologist here in Toronto, and I used an "office building analogy" to explain the pause in global warming.
See what you think of it. I'm wondering if I subconciously "borrowed" it from someone here at SKS...
Maybe I missed it but claiming something about a change in the slope of global warming is nonsense. Now if the sign of the slope changed, I'd be interested but to quibble about the value of the slope?
The honorable global warming deniers are face with some hard, undenible facts. Arctic shipping through the NorthEast and NorthWest passage exceeded 1 million tons in 2013. It was 1.2 million tons in 2012 and similar numbers of ships, tonnage unknown, in 2011. The practical effect, the business effect, is Arctic shipping is open for the third year in a row.
So if this is just a slope problem and not a sign, hammer them away with "Is it cooling now?"
Bob Wilson
There is one thing that I don't understand. It said that the IPCC lowered their likely equilibrium sensitivity interval from 2-4.5 to 1.5-4.5 due to the "pause" (or rather due to simplified models that were very sensible to this kind of short term variability). Independent paleo data, GCM:s and observations of feedbacks does not support any (likely) values <2.
But if the climate system even accumulated more heat during the "pause", as claimed in the blog post, despite weaker sun and (probably) stronger negative aeorosol forcing, how can this be consistent with the IPCC assessment update, including a fair chance (17%) of sensitivity being even <1.5?
Dean, not sure how to answer your question at 16, but your post certainly does raise my antennae..suppose a team of *extremely* well-educated experts in a given field--say, oncologists--have studied my files, data, and extensive and comprehensive collection of CT scans and arrives at an opinion--a consensus, if you will--of my having an 83% chance of dying from an aggressive cancer.
How would it be rational, for me, to exclaim, "Well, shootfire, boys! That means I have a fair 17% chance of all of you, being wrong!" I'm asking the question because the final part of your post made me twig at the rest. would it be rational for me to proceed with the experts' 83% estimate of my mortality, or to run with the slim chance that 17% of them felt there was no worry?
I am sure the brainiacs among the SkS team can certainly address the first part of your post, and I am also interested in that, given how bad I am at stats.
"Was he not just asking that, given the ocean's ever-increasing heat content (as per the article) and despite the cool sun/La Nina dominance slowing surface temps very little, how could the IPCC possibly extend the lower bound of projected ECS down to 1.5degC? "
Not sure, and it's why I asked. As a long-time veteran of seeing deniers creep into conversations here and across the Web--and I am NOT asserting Dean is one--I have 'tingly antennae' about curious questions like that, ergo, why I asked, Dean hopefully will lean in and elucidate further on his intent, and I'm happy to hear it out.
Remember that the IPCC bases it reports on the severe side of 'least drama,' given the makeup of its constituent membership: their downgrading CS may or may be a function of that, or, perhaps more likely, is a function of science doing as it always does, and should: consider ALL rational, data-driven conclusions.
vrooomie and Matt, I don't think that there is anything particularly wrong with main stream climate science and I respect the IPCC reports as goldmines of scientific information. But I have spent a fair amount of time arguing with "skeptics" and would like to have a consistent understanding of the current state of knowledge.
As I wrote, I cannot reconcile the lowered equilibrium sensitivity (lower end) with Dana's explanations about the "pause", At least one expert has claimed: "The lowering is based on one narrow line of evidence: the slowing of surface warming during the past decade".
But if the "pause" has nothing to do with weaker feedback mechanisms, this a contradiction. Larger natural variations even points to stronger positive feedbacks.
Reading through the report there is quite a lot of mentioning about the period 1998-2012. But there is no systematic scientific reason for this, it is cherry-picking. As a non-expert I don't really want to claim that the IPCC authors are wrong, but lets say I'm rather skeptical against some of their assessments and would like to have confirmation that the lowering wasn't just due to the massmedia/politically driven pressure.
Vroomi, yes, I also have the problem with the tingly anntennas....
Dean, you may have a problem regarding uncertainty: There is a likelihood, that the equilibrium sensitivity is as low or lower than 1.5 - but you forget that uncertainty is not or friend! Because there ist just (or nearly) the same chance, that the equilibrium sensitivity is as high or higher than 4.5°C. On my part the best message in the whole sensitivity discussion ist that it is very unlikely to be higher than 6 degrees. (Judith Curry once, pushing uncertainties as always, claimed the ES may be up to 10 degrees .... that was the scariest "argument" I ever heard, let alone from a "sceptic")
A discussion to ES, in german: IPCC 5 - Uneinigkeit zur Klimasensitivität
Discussion with AR5 , graphs pages 172(ES) and 173(TS)
PS: Dana, with your Enigo Montoya reference you made my day! :-D
Michael M - didn't they have a higher confidence level above 4.5 C than they had for less than 1.5?
@Dean #16 You might want to first look 1 step back at the foundation. GEOPHYSICAL RESEARCH LETTERS, VOL. 40, 10 May 2013 pp 1754–1759 is 6 pages of "Distinctive climate signals in reanalysis of global ocean heat content" by Magdalena A. Balmaseda, Kevin E. Trenberth and Erland Källén with the graph & description of the ORAS4 reanalysis. Sure, they use models which can therefore be argued but my inference is that these are to interpolate in time & space between ocean temperature data from the 7,000 Argo floats & huge numbers of XBTs (I seem to recall climate scientist saying 240,000 in a video) which are sparsely spread at depth and back in time decades ago. Where you and I would simply average between the two distant measurements, I presume their fancy computers do a better job than a linear interpolation by simulating how the ocean moves. But basically it's underpinned by 7,000 Argo floats <huge numbers> XBTs. With all the work they've done it just doesn't look like they could have messed it up so badly that the 137 ZettaJoules they graph being added to the oceans from 2000 to 2012 could be off by any amount that's a game-changer. I doubt very much that the climate sensitivity IPCC uses is based on what's been seen, I think the big increase since 2000 is at the lower IPCC feedbacks. I infer that IPCC is using the models and I infer that they show increasing feedbacks so what we've seen so far hasn't even reached the lower end of the forcing+feedbacks they expect.
Dean @16,
The simple answer is that if the deep ocean is, in effect, able to act as a bottomless sink for at least some of the heat, then the system is able to absorb more energy with less change in atmospheric temperatures, thus effectively reducing climate sensitivity (same forcing, less actual temperature change).
The more complex answer is that the basic, accepted equation for computing Effective Climate Sensitivity based on short term observations is:
where ECS is the Effective Climate Sensitivity, F2x is the forcing due to a doubling of CO2, ∆T is the observed change in temperature of the period, ∆F is the observed or estimated/computed change in forcing over the period, and ∆Q is the observed change in heat content of the entire system (atmosphere plus oceans plus land plus ice melt).
When applying a reduced observed temperature of the past 30 years with a monotonic heat gain over the same time period, the net result is a lower sensitivity.
Of course, all of this assumes that the short tail of the pause is significant, i.e. that it is reflective of the longer term trend, so that the 30 year period of observations is indicative of what is to come.
Alternately, we might see a "rebound" effect from the deep ocean warming, much as we saw following the Pinatubo eruption, where temperatures climb dramatically. We could also see a double-rebound effect if that is combined with a less-quiet sun, a reduction in dimming aerosols, and less preponderance of La Niña events. In that event temperatures, and a newer, revised estimate of climate sensitivity, would sky rocket.
But for now, when considered with the full body of evidence and the variety of methods of computing climate sensitivity, the observational method points to at least a lowering of the lower bound of the expected range of climate sensitivity.
Is this to say that the oceans are retaining about 0.56% of the energy shining onto them from the sun?
And if so, why isn't the warmer ocean causing the surface temperature to rise? I assume by global surface temperature in your above graph you are measuring both the land and ocean surface temperature, correct?
0.56% Derivation
Earth Surface area = 196.9e6 mi^2
1/2 that = 9.845e7 mi^2
Earth recieves about 3.538 W/mi^2 avg
Total = 3.483e17W/s (Joules)
Little Boy about 16 Kton of TNT
1 Ton TNT about 4.25e9 J
Little Boy = 6.8e13 J
Earth recieving 1000 Little Boys/sec
Oceans = 71% so getting 710 Little Boys per second
4 of those retained = 0.56%
BruceWilliams @25.
Your 0.56% derivation is suffering some profound problems. Firstly you should divide by 4 (not 2) to obtain the area of a projected disc from the area of a sphere. But most important, solar radiation is ~1,366 W/sq metre. That is reduced to ~70% of that value due to albedo. To convert to W/sq mile (which you appear to be using) you would multiply by 2,589,988. And a joule is a watt.second not a watt/second. (Luckily you are only dividing by 1.) Thus I make the solar energy hitting the planet 4.8766e17 W so you are within the ballpark so far, but purely by luck rather than anything else.
Your TNT energy is marginally high & your energy per bomb marginally low. How you manage to then obtain 1,000 bombs per second I cannot imagine. It should be something like 7,000 bombs. I assume the 71% is the areal proportion of the oceans, thus some 5,000 bombsworth of solar radiation strikes ocean. If 4 bombsworth is absorbed, that would be 4/5,000 = 0.08%, or seven times less than the figure you derive. Hey, that means the last two lines of your derivation was okay. Well done!! (I should confess that my arithmetic is subject to occasional error. It is, however, not subject to systemic error.)
But then, I have a feeling you are not bothered by the actual figure. Rather you want to bash on about the recent global average SST.
Bruce Williams, MA Rodger:
Wikipedia gives the blast yield of Little Boy as 67 x 10^12 Joules
It also gives the surface of the Earth as having an area of 510 x 10^12 m^2
TOA insolatin is 1366 W/m^2 in a plane perpendicular to the suns rays, or 341.5 W/m^2 averaged over the Earths surface. Allowing for albedo, that reduces to 239 W/m^2. That yields a total of 121890 * 10^12 Joules per second (ie, 1.1289 * 10^17 Watts) incoming energy ignoring reflected Short Wave Radiation (SWR) over the Earth's, or the equivalent of 1819.25 Little Boy explosions. From that, we determine that the average 4 Little Boy explosions per second absorbed by the Earth (ie, incoming energy less reflected SWR minus Outgoing Longwave Radiation) is 0.22% of incoming energy less reflected SWR. That is 0.31% of energy falling on the oceans, but that figure is not particularly meaningfull as the Oceans absorb 90 plus percent of total energy absorbed. A little more meaningfull is the fact that the oceans absorb 0.28-0.3% of energy falling on the oceans.
That energy is absorbed, however, over the full depth of the ocean. It may transit the surface, but that does not mean it is stored at the surface. Therefore SST and OHC are not exactly coupled, and OHC can continue to rise when SST are steady or even falling.
Tom Curtis @27.
I concur with your numbers. In my haste to be done @26, I failed to convert from disc to sphere so my energy flux was 4x too big.
I would note that, while this does correct the arithmetic @25, there is still a fallacy within the logic. Solar energy can be considered in equilibrium prior to AGW. Today's imbalance is not with the solar energy (although with a warming climate, the solar imbalance could be considered now negative). What is heating the ocean is the increase in LW back radiation, a flux about twice the size of the solar flux. Thus it would be more correct to say that the oceans are actually retaining 0.16% of ocean's back radiation.
Tom Curtis @ 27
Although not directly coupled, would it be fair to say that the OHC must eventually follow the SST?
I ask because if not then the heat transfer characteristics surface to bottom must be different than from bottom to top, or there is a heat/cooling action going on at the bottom?