


 Arguments


How human-caused global warming worsens wildfires
What the science says...
Global warming worsens wildfires by drying vegetation and soil, creating more fuel for fires to spread further and faster. In some areas like southeastern Australia and California, altered atmospheric patterns may also be creating stronger and/or more frequent high pressure systems, resulting in less precipitation and thus both dryer conditions and longer fire seasons.
Climate Myth...
Wildfires are not caused by global warming
"it’s not climate change that has caused today’s [bushfire] disaster, but the criminal negligence of governments that have tried to buy green votes by locking up vast tracts of land as national parks, yet failed to spend the money needed to control ground fuel and maintain fire trails ... We can’t dial down the Earth’s temperature any more than we can lock up every teenage arsonist." [Miranda Divine, NY Post]
Heat worsens wildfires
The clearest connection between global warming and worsening wildfires occurs through increasing evapotranspiration and the vapor-pressure deficit. In simple terms, vegetation and soil dry out, creating more fuel for fires to expand further and faster. This is particularly a problem in Mediterranean climates that are prone to drought, like in California and Australia, as climate scientist Kevin Trenberth explains in the interview below with videographer Peter Sinclair.
For example, California's record-breaking wildfire season in 2018 came at the culmination of the state's five hottest years on record (2014–2018) and a record-breaking drought (2012–2017). Australia's record-breaking bushfire season of 2019–2020 followed the continent's two hottest and driest years on record, and expanded during a record-breaking heatwave that included an average country-wide high temperature of 41.9°C (107.4°F) on 18 December 2019.
Though many factors contribute to wildfires, the reason the Australian wildfires are so much worse this year than other recent years is the combination of record drought and record heat. #AustraliaFires
— Robert Rohde (@RARohde) January 4, 2020
History of national-average temperature and precipitation since 1910. pic.twitter.com/aHh3kDFIZ7
Because of the long-term warming trend, the Fourth National Climate Assessment Report concluded,
“Climate change has led to an increase in the area burned by wildfire in the western United States. Analyses estimate that the area burned by wildfire from 1984 to 2015 was twice what would have burned had climate change not occurred. Furthermore, the area burned from 1916 to 2003 was more closely related to climate factors than to fire suppression, local fire management, or other non-climate factors.
Climate change has driven the wildfire increase, particularly by drying forests and making them more susceptible to burning.”
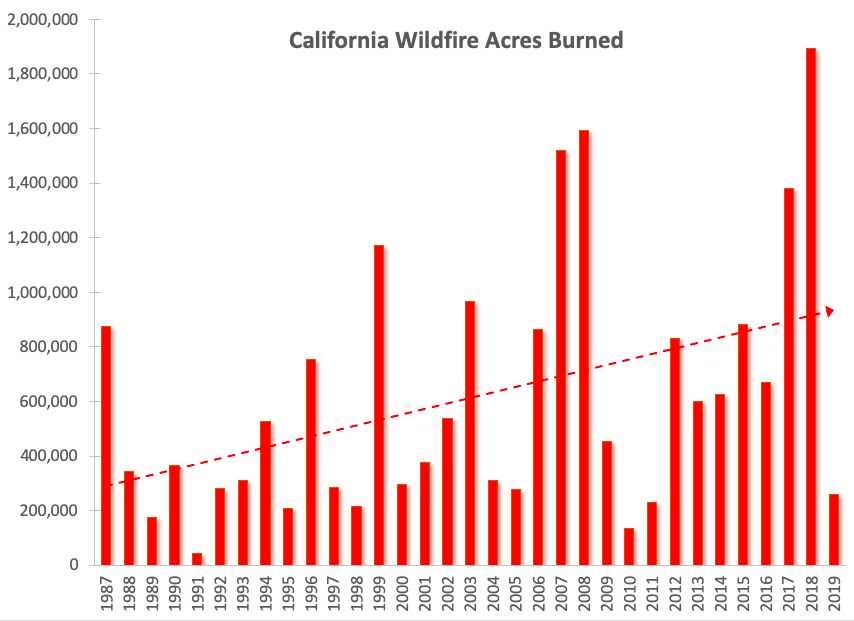
Acres burned by wildfires in California 1987–2019, with the linear trend shown. Data from Cal Fire.
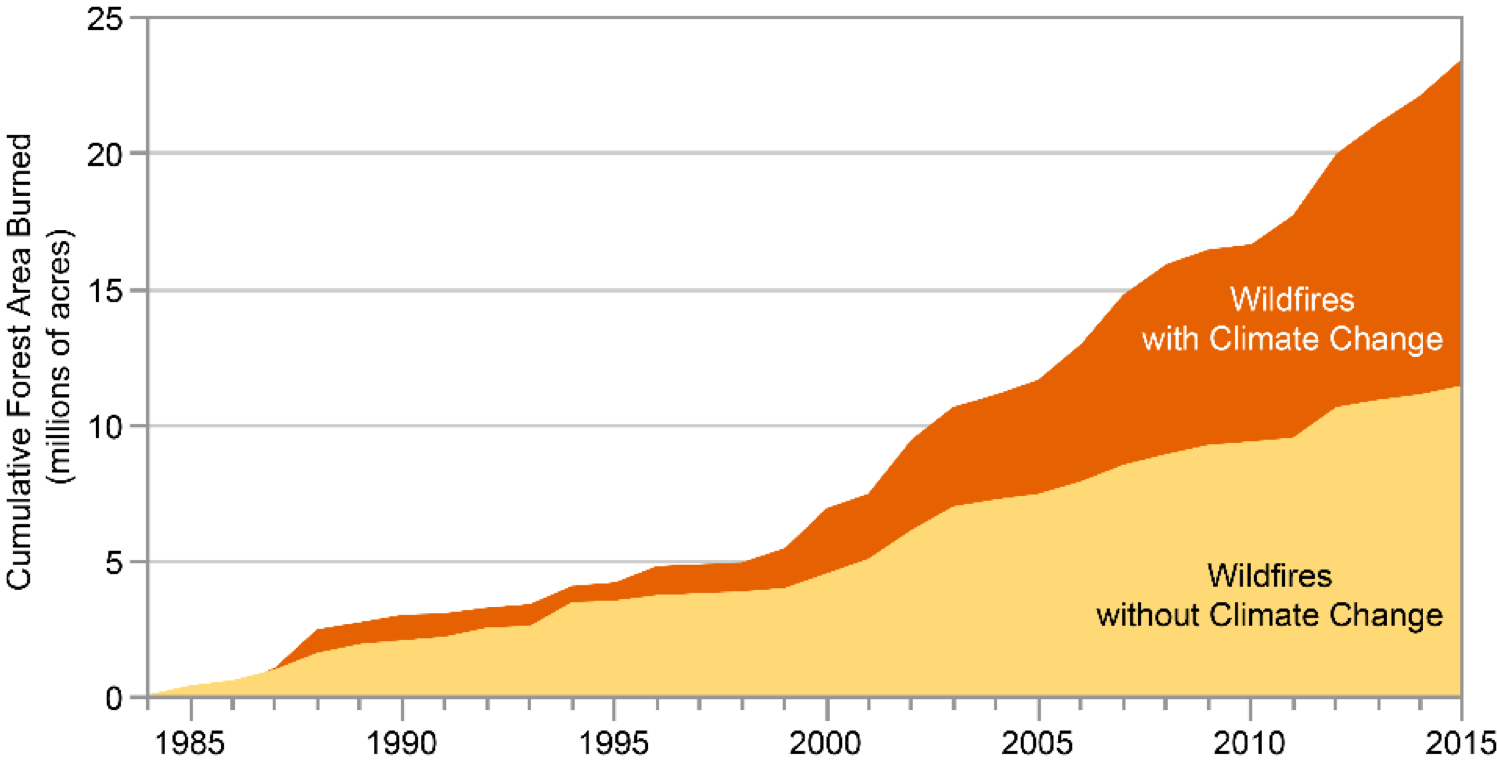
Cumulative forest area burned in the western United States 1984–2015, and attribution to human-caused climate change. Source: Fourth National Climate Assessment.
Changing atmospheric circulations
A second, though more scientifically uncertain connection between climate and worsening wildfires involves changing atmospheric circulation patterns.
California's aforementioned record drought was exacerbated by a high-pressure ridge sitting off the Pacific coast, coined the “Ridiculously Resilient Ridge.” That ridge diverted storm systems to the north of California; the resulting period of low precipitation combined with record high temperatures to create dangerously dry wildfire conditions.
Rutgers climate scientist Jennifer Francis over the past decade has been researching the connection between changes in the Arctic and extreme weather patterns throughout the Northern Hemisphere. In recent years a growing number of climate scientists have found evidence supporting her groundbreaking research. In a 2017 paper in Nature Communications, researchers led by Ivana Cvijanovic and Ben Santer found evidence of a connection between disappearing Arctic sea ice and these high-pressure ridges in the Pacific. And in an October 2018 paper in Science Advances, scientists Michael Mann, Stefan Rahmstorf and colleagues found that depending on how human fossil fuel pollution changes in the coming years, the frequency of wavy jet stream events that often lead to high-pressure ridges off the California coast could triple by the end of the century.
The situation in Australia is again strikingly similar to that in California. Researchers have shown that global warming is expanding an atmospheric circulation pattern known as the Hadley cell. This circulation is caused by hot air at the equator rising and spreading toward the poles, where it begins to cool and descend, forming high pressure ridges. In Australia, this process creates what’s known as the subtropical ridge, which as CSIRO notes, has become more intense as a result of global warming expanding the Hadley cell circulation. A 2014 study, CSIRO’s David Post and colleagues reported that stronger high-pressure ridges have been decreasing rainfall in southeastern Australia in the autumn and winter. The lack of rainfall creates more dry fuel for fires and lengthens the bushfire season.
Based on this scientific research, the latest IPCC report found in 2014 that “fire weather is projected to increase in most of southern Australia,” with days experiencing very high and extreme fire danger increasing 5–100% by 2050. And a 2015 CSIRO report concluded, “Extreme fire weather days have increased at 24 out of 38 Australian sites from 1973-2010, due to warmer and drier conditions … [forest fire danger index] increase across southeast Australia is characterised by an extension of the fire season further into spring and autumn … partly driven by temperature increases that are attributable to climate change.”
Global warming will keep worsening wildfires
Some are quick to point out that droughts and wildfires happen naturally, and the latter are often sparked by human activities. While that's true, it's also the case that human-caused climate change is responsible for making wildfires spread further and faster, by creating drier conditions and likely by changing atmospheric circulation patterns that result in less rainfall in some fire-prone regions like California and Australia.
This rebuttal was updated by Judith Matz in September 2021 to replace broken links. The updates are a result of our call for help published in May 2021.
Last updated on by dana1981. View Archives


I didn't see any reference within this explanation to the main driver of increased fire intensity as well as acreage burned: Anthropogenic alteration of the historic fire regime. 100+ years of aggressive fire suppression has created significant carbon loads well above historical levels. We now see much larger fires now that burn with greater intensity than in the past with the primary driver being fuel density. I didn't see any study sited, or any evidence given as to what proportion of these increases in fire frequency or intensity is created by climate change and which proportion would be attributable to our altering the natural frequency of burn cycles. I'm not really sure how the fourth national climate assessment report could conclude twice the amount of acreage has burned that otherwise would not have because of climate change when fuel density wasn't used as a primary driver within their model.
A-Train @1 , in the above quote from the Fourth NCAR, the "burnt area" studied was for 1916 to 2003. Presumably the pre-1916 data would be too skimpy & poor to provide real value ~ and the assessed period itself contains major changes in population/settlements and multiple other factors.
A-Train1906 , one extra point you may not have considered, is that prior to 1916, going back 70 years to the Gold Rush times (and earlier, too) . . . what was the natural state of the vegetation? Natural wildfires occurred, even with the much lower human population. But what would have been the "natural" level of fuel density in those times of little or no actual fire suppression efforts? Would the untouched/unmanaged fuel density have been much different than the fuel density of recent decades?
To some extent, for climate-factor purposes, we would somehow have to compare (apples to apples) the 2000's with the 1800's rather than with (say) the 1950's or similar period of "unnaturally" lower fuel density.
Atrain1906:
I saw a report (sorry no cite) that compared fires in large areas of the USA where no fire supression is done with those areas where high fire supression is done. These were high elevation areas or areas where the trees were not valuable for timber. They found that the natural areas are burning more today than 100 years ago. That could be the basis of the conclusion that cliamte change is theprimary driver and not fuel density since in the natural areaas fuel density would not have changed.
In general scientists have measured most everything. If you want to claim that they did not include fuel density in their models you need to provide data to support your claim.
Michael,
I'd love to see the data source you are referencing. As my observational opinion, having worked for the Forest Service for years, would be antithetical. Canada, Australia, and the US have had a century of aggressive fire suppression that has resulted in areas of carbon build up that is multiples of the norm for these historic fire regimes. Not only are the fires significantly larger now, because of the higher fuel density, the intensity now causes many of the nutrients to sublimate, lengthening the restoration phase. As for scientists "measuring everything", I would push back, especially since these models have so many moving parts, with significant unknowns. Once a scientist no longer questions their models, data, inputs, etc. it's very easy to let bias creep in. As for my claim they didn't give fuel density it's due, I simply read the inputs on their model.
A-train1906 at post #4 :
Welcome back to this thread after your 18-month hiatus. (An enjoyable vacation, or a period of deep cogitation? )
It is indeed difficult to reach unambiguous conclusions about forest wildfires, because of the many confounding factors ~ and as you indicate, the forest understory (carbon buildup) is a major factor in fire intensity. ~Among other factors, like moisture levels and high temperatures.
To reach a scientifically valid conclusion, would require careful analysis of areas of untouched old-growth forests versus logged forests and plantations ~ of various degrees of management (including of the understory). So many variables, and so much room for gut-feelings to be wrong!
But either way, high temperatures and low moisture levels must be huge contributors to the problem, and are very evidently influenced by global warming. Clearly there is room for better forest management, and perhaps of novel types. Less clear, is whether that should include managed burns in virgin forests where (in previous centuries & millennia) the climate was cooler and/or wetter and where native peoples did not do burns.
All very difficult to assess (and react to). But we should not fall into the trap of implying that modern rapid global warming should be ignored.
A-train1906, there is a Youtube video by Potholer54 title from January 2020, titled: "The cause of Australia's bushfires _ what the SCIENCE says". Recommended. It is rather long, at 36 minutes . . . but Potholer54 does include some humorous parts, so it is all good entertainment as well ! It covers the catastrophic Australian fires only, but there are some general applications too.
I haven't seen the Potholer video. Nonetheless, I don't believe that A-train1906' remark applies to the immense fires in Siberia, affecting areas that have historically received little to no human intervention.
Reaching temperatures close to 50deg Celsius at 50 degrees lattitude, as happened last year in BC should not be discounted as insignificant.
A-train 1906
So no data to support your claims. Yuo claim that you have extensive experience working in the forrest service. Perhaps yo could use that experience tofind some acutal data to share with us. Your claim defies common sense. You need to provide data to support your wild calim that increasing temepratures do not incfluence the amount of fires.
A-Train1906 @ 4:
You state "As for my claim they didn't give fuel density it's due, I simply read the inputs on their model."
If you want us to listen to you, I suggest that you provide details on the following:
I am familiar with the Canadian Wildland Fire Index, and have seen its application to changing climates, if you want to pick one to start.
Seems to be a lot of wildfires in Canada this June 2023 I think this is related to climate change. Yet, I am having trouble convincing others. Also, what can I do to protect myself? I've been wearing a n95 mask but my eyes feel and chest feel worse than usual. Thank you in advance. :)
PollutionMonster @9,
The Health Canada resource "Wildfire smoke, air quality and your health" may help you deal with the smoke effects.
PollutionMonster @9,
Regarding 'attribution of Canada's current wildfires to human caused climate change', the following Carbon Brief article may help you: "Media reaction: Canada’s wildfires in 2023 and the role of climate change"
The article states that:
"No attribution studies have so far made a climate connection with the ongoing wildfires in Canada.
But previous studies have looked at the link between climate change and other extreme weather events. One study found that climate change made a 2020 Siberian heatwave at least 600 times more likely. This heat broke temperature records and led to wildfires.
Additionally, the IPCC said that wildland fire has been “identified as a top climate-change risk facing Canada”.
The interactive map below displays a 2020 review of scientific studies finding that climate change is increasing the risk of wildfires globally."
The bolded words in the quote are links to additional information in the article. Read the article to access those links. And read the entire article. It includes additional information you may find helpful in your attempts to help others learn to better understand this issue.
Something is not adding up here. The diagram from the IPCC shows the area of wild fires increasing (for the Western US). Yet research published by the Royal Society shows the opposite (globally) and I give a link to the article:
doi.org/10.1098/rstb.2015.0345
"Analysis of charcoal records in sediments [31] and isotope-ratio records in ice cores [32] suggest that global biomass burning during the past century has been lower than at any time in the past 2000 years."
"The availability of satellite data now allows a more consistent evaluation of temporal patterns in area burned. Thus, from an analysis based on MODIS burned area maps between 1996 and 2012, Giglio et al. [35] present some rather notable outcomes. In contrast to what is widely perceived, the detected global area burned has actually decreased slightly over this period (by 1% yr−1). A more recent global analysis by van Lierop et al. [36], based primarily on nationally reported fire data supplemented by burned area estimates from satellite observations, shows an overall decline in global area burned of 2% yr−1 for the period 2003–2012."
In particular in Europe there has been a gradual declining trend in area burnt since 1980:![Wildfire occurrence (a) and corresponding area burnt (b) in the European Mediterranean region for the period 1980–2010. Source: San-Miguel-Ayanz et al. [37].](https://royalsocietypublishing.org/cms/asset/8f6375bb-8f56-4e47-a3e0-3195336d9530/rstb20150345f02.jpg)
Wildfire occurrence (a) and corresponding area burnt (b) in the European Mediterranean region for the period 1980–2010. Source: San-Miguel-Ayanz et al. [37].
Given that the concern should be for GLOBAL CO2 why is the emphasis on wild fires in the Western US? I'm beginning to suspect that the IPCC is a political body with a political agenda to push.
Scott @ 12:
Frankly, you appear to be having some difficulty in reading comprehension. You make the serous accusation that "the IPCC is a political body with a political agenda to push", but you have very little in the way of logic or data to support that claim. Such an accusation flirts with the Comments Policy here, but let's entertain your case for a bit.
So,, you reference in your very first paragraph "the diagram from the IPCC". Can you be specific as to which diagram you are referring to? The original post references the IPCC just once, near the end, where is says:
The first diagram in the post, in the tweet from Robert Rhode, has no citation, but states that the data are from the Australian Bureau of Meteorology. The graph is for Australia.
The second diagram is for California data. Again, the diagram is not attributed to a reference, but states "Data from Cal Fire", and is titled "California Wildfire Acres Burned".
The third diagram looks at the forest area burned in the western US. It is sourced from page 1105 in the referenced Fourth National Climate Assessment. The "national" part of that report title relates to its origin: the US Global Chance Research Program.
..and that is the last diagram in the post. So where is this "diagram from the IPCC"???
The original post also makes specific reference to Australia and California in its opening paragraph (the green box at the top). Under "heat worsens wildfires", the post specifically says (emphasis added):
So, the post is specifically looking at certain regions. What about the paper you link to? You make the claim:
Now, you do add "(globally)" after that. But why are you presenting this as if it evidence that goes again the evidence provided for Australia, California, and the western US? If we dig into that reference (which is now 7 years old), what we find is statements like the following, in their Synthesis and Conclusion:
That reference discusses many of the factors affected fire statistics, and make frequent reference to regional variations. (It also provides no new research - it is a review of existing research and expresses an opinion.)
And the figure you provide - which you introduce with "In particular in Europe..." is, as it says in the caption (which you included), for the European Mediterranean region.
So, your case seems to boil down to "but if we average out the areas where burning is less with the areas where burning is more, then the areas where burning is more won't be affected"??? Add in a bit of "but if there is not a trend in current data, there won't be a problem in the future", and you have someone that simply does not like the science. The OP and the references all indicate that increased risk of fire is something that is worth worrying about.
Scott @12 , thank you for the link to the Royal Society research article (by Doerr & Santin) published in 2016. This was somewhat earlier than the disastrous wildfires recently in Australia and in California ~ disastrous not so much in their extent as in their effect on human lives & livelihoods.
Also earlier than the more recent ( non-Mediterranean ! ) wildfires in Canada that were "smoking out" regions of New England, into the bargain.
Also earlier than the [current] disastrous wildfires in southern Greece and Rhodes. (Difficult to picture a more Mediterranean scenario than southern Greece and Rhodes.) Human impact is a large factor in assessing the significance of fires ~ but I am sure the inhabitants & tourists in Rhodes are at present comforted by by the knowledge that the island of Rhodes is small in area, in global terms.
[IPCC] was established by the United Nations Environment Programme (UNEP) and the World Meteorological Organization (WMO) in 1988 ... to provide policymakers with regular assessments on the current state of knowledge about climate change. [And was endorsed by the UN General Assembly in 1988.] So I suppose we can say that the IPCC is a political body in a sense . . . perhaps rivalling the well-known political nature of the WMO. Scott , you need to explain what you mean by the "political agenda" being "pushed" by all these international bodies. Are they in any way partisan or nefarious?
Eclectic @14 /Bob Loblaw @13 You are correct, I assumed the diagram was from the IPCC, it isn't, and the increase it shows has very little to do with global warming. In that respect it is extremely misleading. The area burnt by wild fires has been decreasing not increasing. You criticised this conclusion as being from 2016 - yet in a 2020 blog post by the Royal Society the authors of the paper were interviewed again to find out whether things have changed since its publication. The answer was basically no. "... when considering the total area burned at the global level, we are still not seeing an overall increase, but rather a decline over the last decades. This has been confirmed in a series of subsequent studies, using data up to 2017 or 2018."
royalsociety.org/blog/2020/10/global-trends-wildfire/
From: 'Large Variations in Southern Hemisphere Biomass Burning During the Last 650 Years' Z. Wang,1 J. Chappellaz,2 K. Park,1 J. E. Mak1 (Science Vol 330 17 December 2010)
"These observations and isotope mass balance model results imply that large variations in the degree of biomass burning in the Southern Hemisphere occurred during the last 650 years, with a decrease by about 50% in the 1600s, an increase of about 100% by the late 1800s, and another decrease by about 70% from the late 1800s to present day."

[For some reason images are not showing in the preview but the source is correct]
The same picture is repeated globally. In 'Climate and human influences on global biomass burning over the past two millennia' by J. R. MARLON et al. (Nature Geoscience 1, 697–702; published online: 21 September 2008), they measure sedimentary charcoal records spanning six continents to document trends in both natural and anthropogenic biomass burning for the past two millennia. From this they obtain the following graph - again showing a very clear 20th century decline.
All this begs the question of why there has been such an increase in fires in California.
"Autumn and winter Santa Ana wind (SAW)–driven wildfires play a substantial role in area burned and societal losses in southern California. Temperature during the event and antecedent precipitation in the week or month prior play a minor role in determining area burned. "
"Models explained 40 to 50% of area burned, with number of ignitions being the strongest variable. One hundred percent of SAW fires were human caused, and in the past decade, powerline failures have been the dominant cause. Future fire losses can be reduced by greater emphasis on maintenance of utility lines and attention to planning urban growth in ways that reduce the potential for powerline ignitions."
See 'Ignitions explain more than temperature or precipitation in driving Santa Ana wind fires' by Jon E. Keeley et al. Science Advances 21 Jul 2021 Vol 7, Issue 30
In 'Nexus between wildfire, climate change and population growth in California' by Jon E. Keeley and Alexandra D. Syphard (Fremontia vol 47 Issue 2 2020) is a detailed analysis of wildfires in California. A distinction is drawn between fuel dominated and wind dominated fires.

Population increase leading to urban expansion, accompanied by expansion of the electric power grid, increasing the chances of a powerline failure was a significant cause of wildfire. (The 2021 Dixie fire at 389,837 hectares was caused by a tree falling onto a powerline and could have been prevented had the power company acted promptly - see California Department of Forestry and Fire Protection, Investigation Report Case Number: 21CABTU009205-58). General poor maintenance by utilities has caused many wind dominated wildfires.
Fuel-dominated fires are mostly forest fires in lightly populated regions and so tend to result in less property damage. A century of fire suppression has led to a huge accumulation of fuel at ground level. As a result a low intensity surface fire can easily become a high intensity crown fire.
How 100 years of a misguided policy outlawing controlled burns has left California vulnerable to wild fires
www.theguardian.com/us-news/2019/nov/21/wildfire-prescribed-burns-california-native-americans
www.reuters.com/world/us/california-is-meant-burn-experts-teach-landowners-art-prescribed-burns-2023-06-01/
In conclusion, the total area burnt has been decreasing globally and in California where it has increased this is largely due to misguided policies of forest management and poorly maintained, overloaded power infrastructure. (Urban planning which doesn't adequately address fire hazard doesn't help either). I think linking wildfires to global warming is misguided and likely to backfire when it is revealled to be the least important factor.
Eclectic @14 /Bob Loblaw @13
It didn't find those files but here they are:
Southern hemisphere biomass burning
Fire Cause
Global Biomass Burning
Scott @ 15, 16:
Congratulations. You continue your biased assertions of "extremely misleading". Once again, you really should read the Coments Policy, and tone down the rhetoric.
You continue to cherry pick specific graphs or quotes that do not necessarily imply what you want them to mean.
You continue to fail to discuss the difference between global and regional issues. Your very first reference, to the Royal Society blog post, starts off with the Overview statement (emphasis added):
In the first paragraph of the article, they quote the author as saying (emphasis added):
Yet you characterize the blog past solely on the basis of what they say about global biomass burning trends. What else do they say about the recent global decrease they are referring to? The second paragraph, in full:
Much of the damage and danger in other areas is associated with forest fires. Burning an acre of forest is not the same as burning an acre of grassland.
Nobody is claiming that global or regional climate is the only factor in fires, so arguing that other factors is present is arguing a strawman. Regardless of the source of ignition, large fires require large amounts of fuel.
...and you continue to ignore the question of what the future holds. That requires a deeper level of understanding than what you have shown here.
Claiming that climate "is the least important factor" is certainly not supported by any of the evidence you provide.
Bob makes a interesting point above by bringing the difference between grasslands fires and forest fires, and how they play in the decrease of global area burned.
As Bob pointed above, said decrease is pretty much entirely due to the lower area of savannah and grasslands burned. These environments have a long relationship to fire and are very well adapted to it, with grass species in fact relying on it for their life cycle. The carbon cycling from grassland fires is a short term one that has always been present in the background of the natural global carbon cycle. The amount of CO2 released per unit of surface burned is limited, since grasslands store the vast majority of their carbon underground, and quickly regenerate the above ground part that is lost in fires.
Forest fires, especially the ones affecting old growth forest are an entirely different beast. The amount of CO2 generated by unit of surface is much higher for forested lands. Zheng et al (2021) show that the CO2 released by forest fires essentially compensates for the decrease in total area burned provided by the decline in grassland fires. The result is a "quasi stable" amount of CO2 generated by wildfires. It would not be surprising if this changed with more years like this one has been in Canada and Siberia.