


 Arguments


Explaining climate change science & rebutting global warming misinformation
Global warming is real and human-caused. It is leading to large-scale climate change. Under the guise of climate "skepticism", the public is bombarded with misinformation that casts doubt on the reality of human-caused global warming. This website gets skeptical about global warming "skepticism".
Our mission is simple: debunk climate misinformation by presenting peer-reviewed science and explaining the techniques of science denial, discourses of climate delay, and climate solutions denial.


Wildfires used to ‘go to sleep’ at night. Climate change has them burning overtime
Posted on 29 April 2026 by Guest Author
WASHINGTON (AP) — Burning time for North American wildfires is going into overtime. Flames are lasting later into the night and starting earlier in the morning because human-caused climate change is extending the hotter and drier conditions that feed fires, a new study found.
Fires used to die down or even die out at night as temperatures dropped and humidity increased, but that’s happening less often. The number of hours in North America when the weather is favorable for wildfires is 36% higher than 50 years ago, according to a study published earlier this month in Science Advances.
Places such as California have 550 more potential burning hours than in the mid-1970s. Parts of southwestern New Mexico and central Arizona are seeing as many as 2,000 more hours a year when the weather is prone to burning fires, the highest increase seen in the study, which looked at Canada and the United States. The research looked at times when conditions were ripe for fire, but that didn’t mean fires occurred during all that time.
Recent big fires in LA and Hawaii burned at night
Fires that surge at night are tougher to fight and included the Lahaina, Hawaii fire in 2023, the Jasper fire in Alberta in 2024, and the Los Angeles fires in 2025, the study said. Maui’s fire ignited at 12:22 a.m.
It’s not just the clock that is getting extended. The calendar is too. The number of days with fire-prone weather increased by 44%, which effectively added 26 days over the past half-century.
It’s mostly from warmer, drier nighttime weather, with a bit of extra wind, the study authors said.
“Fires normally slow down during the night, or they just stop,” said study co-author Xianli Wang, a fire scientist with the Canadian Forest Service. “But under extreme fire hazard conditions, fire actually burns through the night or later into the night.”
And Wang said Earth’s warming atmosphere means it’s like to get worse.
Transition risk: The human cost of net zero
Posted on 28 April 2026 by Guest Author
This is a re-post from The Climate Brink by Andrew Dessler
I am finalizing a textbook on climate risk and am posting chapters as I finish them. I’d previously posted chapters about embedded energy and physical climate risk; this post is a chapter on transition risk, the economic and social risks of the transition to a clean-energy economy.
Introduction
In the context of climate risk, transition risk encompasses the economic and social risks associated with a shift towards a low-carbon economy. Such an effort would fundamentally reshape our world and create critical financial uncertainty for assets and industries tied to the old, carbon-intensive system.
Net zero
Reaching “net zero” is the ultimate goal of most climate policy. This means reducing greenhouse gas emissions as much as possible, with any remaining emissions that are too difficult or costly to eliminate are canceled out by an equivalent amount of “negative emissions” — processes that actively pull carbon dioxide out of the atmosphere. These negative emissions are the “net” part of net zero and it acknowledges the practical reality that some sectors, like long-distance air travel or ocean shipping, may be incredibly difficult to decarbonize in the near future.
What are these negative emissions technologies? The two primary methods discussed are Direct Air Capture (DAC), which uses machines to filter carbon dioxide directly from the air, and Bioenergy with Carbon Capture and Sequestration (BECCS), which involves growing crops, burning them for energy, and capturing and burying the resulting carbon dioxide. However, both technologies face significant hurdles, including high costs, large energy requirements, and, in the case of BECCS, immense land use needs that could compete with food production and biodiversity.
Once we reach net zero, global temperatures will stabilize — although they won’t recover to pre-industrial levels for tens of thousands of years. Getting the climate to actually cool on time scales we care about (decades to centuries) would would require pulling even more carbon dioxide out of the atmosphere, or deploying some type of climate engineering approach like injecting aerosols into the stratosphere.
The scale of the net zero transformation means that reaching net zero will fundamentally overhaul vast parts of the global economy. Many big sectors of our economy — energy, transportation, industry, agriculture — must be reshaped, and that reshaping will create enormous opportunities as well as painful dislocations. The transition to a low-carbon economy is not simply a matter of swapping one energy source for another; it requires rebuilding infrastructure, retraining workers, and redirecting trillions of dollars in investment.
Some industries are poised to prosper. Renewable energy is the most obvious example: in 2025, the world added over 700 GW of new capacity, and sustaining that pace for decades will require ongoing investment in manufacturing, installation, and maintenance of wind turbines and solar panels. The profits for those well positioned will be enormous.
The electric vehicle industry and its supply chains — from battery manufacturers to mining operations for lithium and cobalt — also stand to grow dramatically. Companies that build and manage electrical grid infrastructure, including new transmission lines and energy storage systems, will see surging demand. So too will firms specializing in energy efficiency, building retrofits, and emerging technologies like green hydrogen and sustainable aviation fuels. Even agriculture could see new revenue streams as farmers are paid to adopt practices that sequester carbon in soil.
Other industries, however, face serious decline. Fossil fuel producers (coal, oil, and natural gas) confront the prospect of their core product becoming obsolete, stranding assets worth trillions of dollars. Workers in these industries, from coal miners to oil rig operators, risk losing their livelihoods.
The effects extend well beyond extraction: refineries, pipelines, and petrochemical plants all face an uncertain future. The automotive sector will also see significant disruption, as the shift to electric vehicles renders the internal combustion engine and its complex supply chain of transmissions, exhaust systems, and fuel injection components irrelevant. Communities built around these industries may face economic devastation if the transition is not carefully managed.
This uneven distribution of winners and losers will create difficult economic and political challenges, particularly during the transition period. The enormous capital investment required — in renewable generation, grid modernization, EV charging infrastructure, industrial retooling, and carbon removal — must be mobilized quickly, creating the risk of supply chain bottlenecks, inflation in key materials, and financial instability. Managing this transition in a way that is both fast enough to meet climate targets and equitable enough to maintain broad public support is one of the defining policy challenges of our time.
How strong can a hurricane get in a warming world?
Posted on 27 April 2026 by Guest Author
This is a re-post from Yale Climate Connections by Jeff Masters
October 28, 2025, was a very bad day to be in Jamaica. That morning, Category 5 Hurricane Melissa intensified into the strongest hurricane ever observed in the Atlantic: 190 mph (305 km/h) winds, a tie with Hurricane Allen of 1980. That afternoon Melissa powered ashore in Jamaica, causing a catastrophic $8.8 billion in damage, equivalent to 41% of Jamaica’s GDP.
Melissa came close to its maximum potential intensity
The maximum potential intensity of a tropical cyclone is the maximum strength a storm can achieve based on the existing atmospheric and oceanic conditions. Potential intensity theory was pioneered in 1987 by MIT hurricane scientist Kerry Emanuel, who showed that human-caused global warming will increase the maximum strength that a hurricane can achieve. Hurricanes are heat engines that take heat energy out of the ocean and convert it to the kinetic energy of wind, so it makes sense that the winds of the strongest hurricanes will get stronger as the oceans heat up.
Melissa’s 190-mph winds were very close to its maximum potential intensity: The hurricane’s maximum potential intensity was about 197 mph (317 km/h), according to the SHIPS model, and about 200 mph (320 km/h), according to a graphic available at the University of Wisconsin’s CIMSS (Fig. 1). It is quite rare for a hurricane to come this close to its maximum potential intensity — all conditions have to be perfect, and the atmosphere and ocean make up a complex system where perfection is rarely achieved.
 Figure 1. The maximum potential intensity (MPI) of Hurricane Melissa on Oct. 28, 2025, was about 175 knots (200 mph). (Image credit: University of Wisconsin’s CIMSS)
Given the less-than-ideal conditions for intensification – light to moderate wind shear of 5-15 knots, a very slow forward speed of less than 5 mph that allowed upwelling of cooler water from the depths to affect it, and interaction with the rugged terrain of Jamaica – Melissa came remarkably close to its maximum potential intensity. (The formula for maximum potential intensity does not include wind shear and slow hurricane motion.)
2026 SkS Weekly Climate Change & Global Warming News Roundup #17
Posted on 26 April 2026 by BaerbelW, John Hartz, Doug Bostrom
Stories we promoted this week, by category:
Climate Change Impacts (10 articles)
- A more troubling picture of sea level rise is coming into view Scientists have uncovered a “blind spot” in the research on rising seas, revealing that tens of millions of people thought safe from coastal flooding are at risk of inundation. Grist, Fred Pearce, Apr 18, 2026.
- Wildfires used to 'go to sleep' at night. Climate change is turning them into prime burning hours Phys.org, Seth Borenstein, Apr 18, 2026.
- The Guardian view on Japan`s cherry blossom: when spring slips out of time | Editorial A 1,200-year dataset shows the ‘peak bloom’ is arriving earlier. Global heating is unsettling nature’s rhythms – and their cultural meaning The Guardian, Editorial, Apr 19, 2026.
- Lost millennium of Galapagos deep-sea corals linked to major Pacific climate shift Phys.org, University of Bristol, Apr 20, 2026.
- State of the climate: Strong El Niño puts 2026 on track for second-warmest year The first three months of 2026 have been the fourth warmest on record, with each successive month surpassing historical averages by a greater margin. Carbon Brief, Zeke Hausfather, Apr 21, 2026.
- What`s driving the catastrophic wildfires in Georgia Drought conditions have been worsening for months in the Southeast. Now tens of thousands of acres are burning, displacing people and destroying dozens of homes. Grist, Emily Jones, Apr 22, 2026.
- As Climate Disasters Create an Insurance Crisis, a California Bill Seeks to Make Fossil Fuel Companies Pay Premiums “have gone through the roof” and insurers have been leaving the state as the costs of disasters soar amid worsening extreme weather. Inside Climate News, Steven Rodas, Apr 23, 2026.
- Hot, dry and hurricane-scarred: How climate change fueled wildfires in Georgia and Florida Widespread drought in the Southeast is largely to blame for the fires, but their spread has also been fueled by leftover debris from past hurricanes that swept across the region. NBC News, Denise Chow, Apr 24, 2026.
- The “grim news” that isn’t making headlines Dr Gilbz on Youtube, Anna Gilbert, Apr 24, 2026.
- The Next El Niño Could Lock Earth Into a Hotter Climate The Pacific heat pulse is temporary, but scientists warn that its climate impacts are not. Inside Climate News, Bob Berwyn, Apr 25, 2026.
Climate Change Mitigation and Adaptation (3 articles)
- Clean energy pushes fossil-fuel power into reverse for `first time ever` Renewable energy has overtaken coal to become the world’s largest source of electricity in 2025, according to thinktank Ember. Carbon Brief, Molly Lempriere, Apr 20, 2026.
- Why Climate Work Is Community Work State of the Planet, Eve Kaplan-Walbrecht, Apr 23, 2026.
- Transition risk: The human cost of net zero Stranded assets and ghost factories The Climate Brink, Andrew Dessler, Apr 23, 2026.
The really big picture, in four pictures
Posted on 24 April 2026 by Guest Author
This is a guest blog post by John Lang about his new "Climate Trunk" graphics project and website. He will add one graphic per week for about 2 years rounding out the big picture of human-caused climate change graphic by graphic.
If you had to explain climate change in 10 seconds, what would you say?
Climate scientists Katharine Hayhoe and Kimberly Nicholas have long boiled it down to five phrases: It’s real. It’s us. It’s bad. We’re sure. And we can fix it.
This framing has helped millions cut through a topic swamped by jargon, acronyms and complexity. The first four Climate Trunk graphics owe a debt to that tradition.
You’ll notice below I leave one off: we’re sure. Not because scientific certainty doesn’t matter. It does. The evidence is overwhelming. Scientists have passed the gold standard of certainty on human-caused climate change: the five-sigma level. The scientific consensus is as solid as gravity – and like gravity, it doesn’t care what you believe.
I just don’t want to start on the defensive. I want to start by showing the big picture as simply as possible – ‘we’re sure’ will get its own graphic later.
With that caveat out of the way, here’s the Trunk version of the really big picture:
1. It’s real.
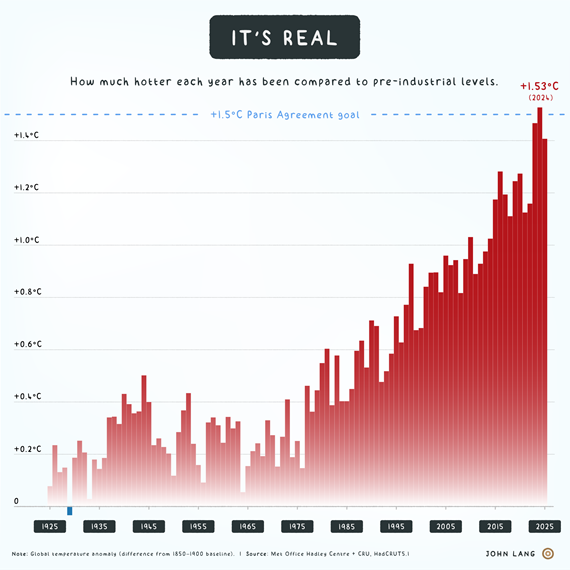
Earth is heating.
Global temperatures are rising, and faster than most people realise. The planet has heated by around 1.3°C since the late 19th century, with the bulk of that increase concentrated in the last 50 years. Land – where people tend to live – has heated by about 2°C on average already. (Ocean takes longer to heat up than land.)
In 2024, the global average reached 1.53°C above the pre-industrial baseline. That doesn’t mean the 1.5°C temperature goal of the 2015 Paris Agreement has been breached, since that threshold refers to the long-term average, not a single year. But it’s a warning that we’re inching closer.
Skeptical Science New Research for Week #17 2026
Posted on 23 April 2026 by Doug Bostrom, Marc Kodack
Technical note: new feature in New Research
Every article we list here is eyeball-scanned by a real human but we do lean on bibliographic catalogs (publication databases) to supply article metadata for assembly of each edition of our weekly research surveillance scan. A little in-house software on our end connected via an API to a rich suite of upstream bibliographic information makes regular production possible.
While recently making API changes to improve our background tooling for New Research, we found ourselves unable to resist tapping into a little more information to include in our regular product. There's one key metric to help us all better understand what practicing scientists find most useful (and stimulating) in the torrent of climate-related research reports we sample here each week: "how many investigators cite a work in their own inquiries?" Our knowledge boundaray inexorably expands past any given report, but older results may well be foundational to newer exploration. So, we've added an little retrospective to each domain section in our weekly listing. For each section, we query our data, asking "what paper listed here 2 years ago has been most cited since it appeared?" This new feature appears at the end of each section:
 There's a vast wealth in our bibliographic resources of ways to see how fresh information travels and effloresces after publication. For instance, by looking at raw cite statistics one might think that Springer-Nature is the center of mass of the entire academic publishing world. But by other metrics quite likely better describing concentration of thought and new insight, the barycenter of cutting-edge human intellect may well lie elsewhere. Given enough effort it's possible to "see" such things in diagram form— but there are not 36 hours in a day, unfortunately. Hopefully we'll have time to explore more!
After this round of tinkering, we now rely entirely on OpenAlex for bibliographic catalog API services. While this speeds internal production, we continue to recommend Unpaywall, and particularly the Unpaywall browser extension which for readers denied institutional privileges affords much handier access to many research articles.
Open access notables
Increasing Population and Cropland Exposure to Human-Induced Sequential Heatwave-Downpour Events, Guan et al., Earth s Future
Compound sequential heatwave-downpour (SHD) events, characterized by abrupt shifts from heatwaves to heavy rainfall, pose serious threats to health, infrastructure, and agriculture. However, the anthropogenic influence on the increasing trend of SHD events is poorly understood, and projections also exhibit large uncertainties. Our study revealed that the affected area of SHD events has grown notably across the Northern Hemisphere. The anthropogenic influences account for approximately 82.2% of the increase in affected areas of SHD events, with greenhouse gas emissions contributing the most. The constrained projection found that the exposure of population and cropland will increase nearly 8-fold under a high-emission scenario in the long term (2081–2100), compared to the current climate baseline (1991–2020). Notably, climate change, rather than population or land use change, is identified as the dominant driver of this increased exposure. Our finding highlights that reducing greenhouse gas emissions can mitigate the impacts of SHD on populations and croplands.
Dramatic increase in ecosystem respiration causes record-breaking atmospheric CO2 growth rate in 2024, Dong et al., Nature Communications
2024 is the hottest year on record, accompanied by extreme precipitation, droughts and fires. The global atmospheric CO2 growth rate in 2024 reached a historic high of 3.73 ppm yr-1, significantly surpassing the previous record set during the 2015/16 El Niño event. Here, we investigate the causes and underlying mechanisms of this record-high growth rate by combining satellite-based atmospheric inversions and estimates of gross primary production and fire emissions. We find that the record-high CO2 growth rate is due to large reductions in the land CO2 sink. This is dominated by a dramatic increase in total ecosystem respiration, which occurred primarily in grass and shrub lands, owing to compound hot-wet climatic conditions in 2024. Given the projected increase in the frequency and intensity of compound pluvial-hot extremes under warming, changes in ecosystem respiration will become more drastic and cause positive feedback to climate warming.
Climate futures require politics, Leininger et al., Nature Communications [commentary]
The Intergovernmental Panel on Climate Change’s (IPCC) seventh assessment cycle (AR7) has begun. Scientists have started to assess the literature on feasible and just climate and sustainability scenarios. The recommendations of the IPCC Workshop on the lessons learnt from the use of scenarios in AR6 point to the need for political science expertise to improve scenarios1. One key aspect highlighted in this report is political development2, including the quality and effectiveness of institutions, rule of law, and maintenance of peace. These factors have not yet been incorporated systematically and quantitatively into the Integrated Assessment Models (IAMs) used to generate pathways of climate action that are assessed in the IPCC. Findings of the IPCC have substantially influenced global climate action. If the omission of political development biases the conclusions drawn from scenario analysis, then the real-world merit of the scenario-based findings is called into question. Therefore, the purpose of this commentary is to suggest steps to improve the incorporation of political development in scenarios during the AR7 assessments and beyond.
A weakened diurnal weather constraint leads to longer burning hours in North America, Luo et al., Science Advances
Contemporary North American wildfires exhibit increasingly erratic intraday burning, posing immediate operational and socioeconomic challenges. Here, we show that climate-driven weakening of day-night (diurnal) weather constraints extends and intensifies burning hours, a key mechanism behind broader fire regime transformations. Analyzing hourly geostationary satellite observations for ~9000 fires (>200 hectares; 2017–2023), we found western mountains and boreal forests experienced the longest active burning hours, with approximately one-third of active days exceeding 12 hours. About 60% of fires reached peak intensity within 24 hours of detection, while 14% of active days peaked at night. On the basis of fire weather, annual potential burning hours were estimated to rise 36% over 1975–2024, with pronounced increases in western regions and spring/fall (48 to 57%). Regions with significant changes gained 26 more potential active days annually and 1.2 additional potential burning hours daily, while extreme days (≥12 or 24 potential burning hours) rose 81 to 233% in fire-prone biomes. Future management requires adaptation to wildfires that increasingly defy diurnal norms.
From this week's government/NGO section:
Climate Change Concern Near Its High Point in U.S, Jeffery Jones, Gallup
Americans’ concern about global warming or climate change remains elevated compared with what it had been prior to 2017. At least four in 10 U.S. adults have expressed “a great deal” of concern about the matter throughout the past decade except for a 39% reading in 2023. Between 2009 and 2016, worry was typically in the low-to-mid 30% range but dropped to as low as 25% in 2011. Currently, 44% of U.S. adults worry a great deal about global warming or climate change, among the highest in the full trend since 1989, along with 46% measured in 2020 and 45% in 2017.
A Global Fleet Under Wind: Scaling Wind Propulsion for Emission Reduction, Energy Demand and Equity, Mason et al., Seas at Risk
The authors present a first-ever study showcasing the benefits of wind propulsion when scaled up to the global fleet. Drawing on 1.74 billion kilometers of real voyage data – the equivalent distance from Earth to Saturn – wind propulsion could, conservatively, reduce modelled wind ship fuel use by 6.3-9.4%, with an even greater potential if paired with other optimization measures such as weather routing, slowing down speeds, and hull cleaning. By 2050, it could deliver up to 762 million tons of cumulative CO2 savings, getting us closer to our climate targets. The technology is here, but is policy willing?
173 articles in 70 journals by 1545 contributing authors
Physical science of climate change, effects
Can Large-Scale Clustering of Tropical Precipitation Be Used to Constrain Climate Sensitivity?, Blackberg & Singh, Journal of Geophysical Research Atmospheres Open Access 10.1029/2025jd045282
EGU2026 - My plans for attending virtually
Posted on 22 April 2026 by BaerbelW
This year's General Assembly of the European Geosciences Union (EGU) will again take place as a fully hybrid conference in both Vienna and online from May 4 to 8. This year, I'll join the event virtually for the full week, participating in the hybrid sessions from the comforts of my home. I already picked most of the sessions I plan to attend and - as meet-hopping is a lot easier online than on-site - I didn't have to pay close attention to where in the conference center they happen. This year, I submitted abstracts to two sessions and both happen to be on Monday. This suits me just fine as it means, that I can freely plan the rest of my week, picking and chosing sessions piquing my interest. This blog post provides an overview of my itinerary.

Monday morning, May 4
The very first session for me at this year's EGU meeting starts at 8:30 and will be EOS1.1 Science and Society: Science Communication Practice, Research, and Reflection in which I'll have the first of my two oral presentation slots. The session has been (co)convened by Roberta Bellini, Nuno Pimentel, Megan O'Donnell, Thomas Harvey, Ashley Akingbade and Nikos Kalivitis and will include the Angela Croome Award Lecture as well as the Katia and Maurice Krafft Award Lecture.
Science communication includes the efforts of natural, physical and social scientists, communications professionals, and teams that communicate the process and values of science and scientific findings to non-specialist audiences outside of formal educational settings. The goals of science communication can include enhanced dialogue, understanding, awareness, enthusiasm, influencing sustainable behaviour change, improving decision making, and/or community building. Channels to facilitate science communication can include in-person interaction through teaching and outreach programs, and online through social media, mass media, podcasts, video, or other methods. This session invites presentations by individuals and teams on science communication practice, research, and reflection, addressing questions like:
- What kind of communication efforts are you engaging in and how are you doing it?
- What are the biggest challenges or successes you’ve had in engaging the public with your work?
- How are other disciplines (such as social sciences) informing understanding of audiences, strategies, or effects?
- How do you spark joy and foster emotional connection through activities?
- How do you allow for co-creation of ideas within a community?
- How are you assessing and measuring the positive impacts on society of your endeavours?
- What are lessons learned from long-term communication efforts?
Based on its description this seemed to be a very good session to talk about our upcoming website relaunch and it'll be my turn for not quite 10 minutes at 10:05 to do just that in my assigned oral slot. This is the abstract I submitted a few months ago:
Global warming is making the strongest hurricanes stronger
Posted on 21 April 2026 by Guest Author
This is a re-post from Yale Climate Connections by Jeff Masters
In brief:
- Multiple studies have found that tropical cyclones are becoming stronger worldwide.
- New so-called attribution studies have linked increased wind speeds to human-caused ocean warming.
- In the future, scientists expect an increase in the proportion of Category 4 and Category 5 tropical cyclones.
The dangers posed by one of humanity's greatest scourges – the tropical cyclone – are being significantly increased by human-caused global warming. In fact, one of the more confident predictions about how climate change will affect these great storms — which we will refer to by their Atlantic name when they reach winds of 74 mph (119 km/hr) or greater, the hurricane — is that the winds of the strongest ones will get stronger. But how much stronger? Are we already seeing this happening? And how do scientists know?
Spotty data
People began collecting high-quality, satellite-based global tropical cyclone data only around 1982. The relatively poor quality and short length of the global hurricane database, combined with the natural high variability in hurricanes, make ironclad scientific statements on how climate change is affecting hurricanes difficult. In their Global Warming and Hurricanes explainer, scientists at NOAA's Geophysical Fluid Dynamics Laboratory wrote, "it is premature to conclude with high confidence that human-caused increases in greenhouse gases have caused a change in past Atlantic basin hurricane activity that is outside the range of natural variability." Statements like this are often used by climate deniers to downplay climate change risks.
That said, scientists do understand the basics. Hurricanes are heat engines that take heat energy out of the ocean and convert it to the kinetic energy of their winds. A hotter ocean will allow hurricanes to grow more powerful, assuming that the other factors that support intensification, including low wind shear and a moist atmosphere, are present.
And there is already evidence that the strongest storms are getting stronger. For example, a July 2025 analysis found that human-caused climate change increased the intensity of 2024's Atlantic hurricanes by 3%-12%. This may seem trivial, but a 5% increase in hurricane winds yields about a 50% increase in damage: Hurricane damage increases exponentially with an increase in winds (see NOAA's damage multiplier table in Fig. 3)
For 2024's devastating Hurricane Helene, another study found an 11% increase in winds because of climate change, accounting for 44% of the $81 billion in damage caused by Helene.
As Cuba’s grid fails, solar power becomes a lifeline
Posted on 20 April 2026 by Guest Author
This is a re-post from Yale Climate Connections by Pearl Marvell
The Trump administration’s fuel blockade against Cuba has resulted in widespread power outages, gas shortages, garbage in the streets, and a humanitarian crisis – but also a surge in solar installations.
In 2025, the Caribbean nation produced 10% of its electricity from renewable sources, a jump from 3.6% in 2024, according to Rosell Guerra Campaña, director of the Ministry of Renewable Energy at Cuba’s Ministry of Energy and Mines.
Cuba’s increased reliance on renewables is driven by dire necessity.
Since President Donald Trump’s January 2026 executive order imposing tariffs on countries that supply oil to Cuba, gas and diesel supplies have grown sparse, forcing many residents to stay home.
“The streets feel like a ghost town,” said Michael Galant, a senior research and outreach associate at the Center for Economic and Policy Research, who visited Cuba for work in March.
Galant described the situation as “extremely dire” and “visibly worse” than what he saw in previous visits.
Trash trucks can’t operate without fuel, so garbage is piling up on city streets and creating a breeding ground for the mosquitoes that spread diseases like dengue and chikungunya. The alternative is to burn the trash, polluting the air.
U.N. experts condemned the fuel blockade in February.
“The U.S. executive order imposing a fuel blockade on Cuba is a serious violation of international law and a grave threat to a democratic and equitable international order,” they said.
Residents in La Habana and Morón, in the middle of the main island of Cuba, have expressed their frustration by banging pots and pans at all hours.
The U.S. capture in January of Venezuelan President Nicolás Maduro has intensified the crisis, as Venezuela was previously one of the primary suppliers of oil to Cuba. In February, Trump allowed the resumption of some Venezuelan oil imports, but that has not halted the energy crisis. Other countries that used to supply oil have cut Cuba off under the threat of U.S. tariffs.
2026 SkS Weekly Climate Change & Global Warming News Roundup #16
Posted on 19 April 2026 by BaerbelW, John Hartz, Doug Bostrom
Stories we promoted this week, by category:
Climate Change Impacts (7 articles)
- Climate change is outpacing evolution. Scientists are using DNA to catch up Phys.org, Annika Hammerschlag, Apr 10, 2026.
- Marine heatwaves `nearly double` the economic damage caused by tropical cyclones Tropical cyclones that rapidly intensify when passing over marine heatwaves can become “supercharged”, increasing the likelihood of high economic losses, a new study finds. Carbon Brief, Giuliana Viglione, Apr 10, 2026.
- ‘Heat Batteries’ Leave Some City Blocks Scorched "Even measures designed to help, like air conditioning, can create vicious cycles that lead to hotter temps." Inside Climate News, Lauren Dalban, Apr 14, 2026.
- ‘Nothing but tree skeletons’: record-breaking wildfires devastate US cattle country "Rising temperatures and extreme drought are driving more destructive spring fires across the American Great Plains. This year, forces aligned to create the perfect storm in Nebraska" The Guardian, Gabrielle Canon, Apr 14, 2026.
- Critical Atlantic current significantly more likely to collapse than thought Scientists say finding is ‘very concerning’ as collapse would be catastrophic for Europe, Africa and the Americas The Guardian, Damian Carrington, Apr 15, 2026.
- Global warming is making the strongest hurricanes stronger Recent studies link human-caused warming to more powerful, more destructive storms worldwide. Yale Climate Connections, Jeff Masters, Apr 15, 2026.
- Wildfires used to 'go to sleep' at night. Climate change has them burning overtime The number of hours in North America when the weather is favorable for wildfires is 36% higher than 50 years ago. The Independent News, Seth Borenstein, Apr 17, 2026.
Climate Policy and Politics (6 articles)
- How the Trump administration`s climate math doesn`t add up There's an old argument that protecting the environment hurts the economy. It's wrong for a lot of reasons. Grist, Kate Yoder, Apr 10, 2026.
- Who Loses in the Trump Administration’s $1 Billion ‘Deal’ to Abandon Offshore Wind? "That would be American ratepayers—i.e., you." Inside Climate News, Jenni Doering, Apr 11, 2026.
- Don’t mention the climate: Trump creates ‘beyond absurd’ situation at global finance talks "Developing countries face possible shelving of crucial green action plan at IMF and World Bank spring meetings" The Guardian, Fiona Harvey, Apr 13, 2026.
- The Treasury Secretary vs. Climate Science In comments on Tuesday, Treasury Secretary Scott Bessent dismissed the scientific consensus on the causes of climate change. New York Times, Lisa Friedman, Apr 14, 2026.
- Skeptical Science New Research for Week #16 2026 This week's Skeptical Science research scan included 107 new reports by 763 contributing investigators, as well as 11 government/NGO items related to matters of climate change. Skeptical Science, Doug Bostrom & Marc Kodack, Apr 16, 2026.
- US pressure puts World Bank`s climate plan at risk Assiduously working on behalf of Big Oil and not the citizens who elected it, the Trump administration pressures the World Bank to play dumb on climate. Climate Home News, Matteo Civillini, Apr 16, 2026.
Skeptical Science New Research for Week #16 2026
Posted on 16 April 2026 by Doug Bostrom, Marc Kodack
Open access notables

Tropical cyclones (TCs) are among the most devastating natural phenomena, causing substantial economic damage and severe impacts on human life and infrastructure. Prolonged extreme ocean temperature events, known as marine heat waves (MHWs), affect 52% of landfalling TCs globally and provide favorable conditions for TC rapid intensification (RI). Here, we use four decades of global data to demonstrate that TCs experiencing RI during MHWs resulted in 60% more billion-dollar disasters compared to those without heat wave influence. Our analysis reveals these costlier storms produced consistently higher maximum wind speeds, storm surges, and precipitation rates. We found that, for billion-dollar TCs, even controlling for similar levels of coastal development, MHW TCs cause significantly higher damages than their counterparts, confirming that their enhanced intensity characteristics amplify economic impacts beyond what would be expected from exposure alone. These findings underscore the critical need for improved disaster preparedness as MHWs increasingly supercharge TCs’ intensity, leading to more frequent billion-dollar disasters.
Attributing and projecting record-shattering September tropical night events in East Asia, Seo et al., Weather and Climate Extremes
In 2024, East Asia experienced an unprecedented nighttime heatwave during the summer. This study analyzes the features of 2024 tropical night events in July-August (JA) and September (SEP) and projects their future occurrence under different global warming levels (GWLs). The analysis reveals that the daily minimum temperature and specific humidity reached unprecedented levels in both JA and SEP in 2024, remarkable in SEP with breaking records by four or more standard deviations. Based on Coupled Model Intercomparison Project phase 6 (CMIP6) simulations, the 2024-like tropical night events exhibit zero probability of occurring under the historical climate with natural forcing only and remain rare even under historical climate involving anthropogenic forcing, particularly for SEP tropical night. Under future warming scenarios, the return period of 2024-like event drastically shortens, reaching 71, 10, and 2.5 years at 1.5 °C, 2.0 °C, and 2.5 °C GWL, respectively, implying that such events could become frequent and nearly regular event under higher warming levels.
Sensitivity of Heatwave Characteristics to the Climatic Baseline, Fraser-Leonhardt et al., Atmospheric Science Letters
Temperature extremes are usually defined relative to conditions during a past baseline period. Due to global warming, different baselines produce different results for heatwave frequency, intensity, spatial extent and duration. This study investigates how the choice of baseline affects summer heatwave metrics across Europe from 1950 to 2023. We evaluate regional and temporal differences in heatwave characteristics using both grid-point analysis and a case study of the 2003 European heatwaves using observational daily maximum summer temperature for three different baselines (1961–1990, 1981–2010 and 1991–2020). Results show that more recent baselines yield a substantial reduction across Europe in observed heatwave frequency, of up to 12 days per summer in some southern European regions. The average intensity of heatwaves relative to the 90th percentile decreases by up to 2.0°C when using more recent baselines. The largest reductions are observed in southern and central Europe. The spatial extent of the 2003 European heatwave declines by more than 0.5 million km2 if using more recent baselines, and the duration shortens by up to 2 days as conditions that would have been extreme in the past are nearer the new normal. However, 2003 is still classified as a mega-heatwave under both baselines. Comparisons of fixed, detrended and rolling reference approaches show that methods that vary baselines, assuming linear warming—despite its unrealistic nature—yield similar results to rolling reference windows from 1960 onward.
A topographically-controlled tipping point for complete Greenland ice-sheet melt, Petrini et al., The Cryosphere
A major impact of anthropogenic climate change is the crossing of tipping points, which may have severe consequences such as the complete mass loss of the Greenland ice sheet (GrIS). At present, the GrIS is losing mass at an accelerated rate, largely due to a steep decrease in its surface mass balance (SMB; the balance between snow accumulation and surface ablation from melt and associated runoff). Previous work on the magnitude and nature of a threshold for GrIS complete melt remains controversial. Here, we explore a potential SMB threshold for complete melt of the GrIS; the impact and interplay of surface melt and glacial isostatic adjustment (GIA) in determining this threshold; and whether the GrIS exhibits characteristics commonly associated with tipping points, such as sensitivity to external forcing. To this end, we force the Community Ice Sheet Model v.2 (CISM2) by cycling different SMB climatologies previously calculated at multiple elevation classes with the Community Earth System Model v.2 (CESM2) in a two-way coupled CESM2–CISM2 transient simulation of the global climate and GrIS under high CO2 forcing. The SMB calculation in CESM2 has been evaluated with contemporary observations and high-resolution modelling and includes an advanced representation of surface melt and snow–firn processes.
We find a positive SMB threshold for complete GrIS melt of 230 ± 84 Gt yr−1, corresponding to a 60 % decrease in SMB and to a global mean warming of +3.4 K compared to pre-industrial CESM2–CISM2 simulated values. In our simulations, a small change in the initial SMB forcing (from 255 to 230 Gt yr−1) and global mean warming above pre-industrial levels (from +3.2 to +3.4 K) causes an abrupt change in the GrIS final volume (from 50 % mass to nearly complete deglaciation). This nonlinear behaviour is caused by the SMB–elevation feedback, which responds to changes in surface topography due to surface melt and GIA. The GrIS tips from ∼ 50 % mass towards nearly complete melt when the impact of melt-induced surface lowering outweighs that of GIA-induced bedrock uplift and the (initially positive) SMB becomes and remains negative for at least a few thousand years. We also find that the GrIS tips towards nearly complete melt when the ice margin in the central west unpins from a coastal region with high topography and SMB. We show that if we keep the SMB fixed (i.e. no SMB–elevation feedback) in this relatively confined region, the ice sheet retreat is halted and nearly complete GrIS melt is prevented even though the initial SMB forcing is past the threshold. Based on the minimum GrIS configuration in previous paleo-ice-sheet modelling studies, we suggest that the surface topography in the central west might have played a role in preventing larger GrIS loss during the last interglacial period ∼ 130–115 kyr BP.
From this week's government/NGO section:
The President and the Power Grid, Alexandra Klass and Dave Owen, SSRN
There is a sharp discontinuity between the second Trump administration's electricity policies and those of previous presidential administrations. President Trump has directed the Department of Energy to use statutory authority designed for wartime conditions and sudden emergencies to prevent electric utilities from retiring aging coal plants. In doing so, he has elevated the President's role in electric grid governance and reduced the primacy of the independent expert regulatory agency-the Federal Energy Regulatory Commission-that Congress authorized to govern electricity markets and grid reliability. This Essay places these actions in historical context. It recounts the executive branch's role in electricity policy during the first part of the twentieth century, when the federal government responded to wartime crises by building new electricity supplies and actively managing existing electricity infrastructure. While these early and mid-twentieth century executive actions may superficially resemble present-day events, they were, in fact, profoundly different. Even amid the urgency of wartime, the executive branch was laying the foundation for an integrated grid managed by expert government agencies, not through direct presidential decrees, and it was working for technological progress, not regression. Building on this history, this Essay then explains why the present-day shift from expert agencies to presidential power in electric grid governance matters. The most obvious reason is that it will carry heavy financial and environmental costs to consumers and the nation. But the increased assertion of presidential power in electric grid governance also has doctrinal significance in light of recent developments in Supreme Court jurisprudence surrounding statutory interpretation and presidential use of emergency authorities.
Understanding the Economic Effects of Renewable Energy Restrictions: Evidence from Indiana, USA, Hicks et al., Center for Business and Economic Research, Miller College of Business, Ball State University
The authors summarize the findings of a broader empirical study examining the how county-level restrictions on utility scale wind and solar facilities affect economic activity. The results consistently show that counties adopting renewable energy restrictions for either or both wind and solar experienced weaker economic performance than counties without restrictions. Differences are most evident in employment outcomes and GDP, with effects concentrated in manufacturing and related sectors. Employment effects are mostly negative. Although 113 jobs were added in the agricultural sector, the total number of jobs in manufacturing and transportation/ warehousing declined by 8,841 exclusively in counties with restrictions), resulting in an overall net loss of 8,728 jobs. Counties with wind and solar energy restrictions experienced an aggregate net loss of $204 million in GDP, while adjacent counties experienced a GDP gain of $13 million. Counties with these restrictions also experienced slower growth in assessed value and local revenue. Over time, the reduced tax base can constrain the local government’s ability to fund public services or maintain infrastructure without raising tax rates.
107 articles in 53 journals by 763 contributing authors
Physical science of climate change, effects
Changes in ENSO-Induced Ocean Heat Content Redistribution under Global Warming, Li et al., Journal of Climate 10.1175/jcli-d-25-0184.1
ENSO’s Strengthened Control over Global Climate Anomalies in a Warmer World, Liu et al., Journal of Climate 10.1175/jcli-d-25-0550.1
Don’t panic: A field guide to the runaway greenhouse
Posted on 15 April 2026 by Guest Author
This is a re-post from The Climate Brink by Andrew Dessler
In a recent post on his Substack, Jim Hansen wrote about “runaway climates” on Earth, and I thought it would be useful to explain the physics of what this actually means and whether it’s something we need to worry about.
A runaway greenhouse occurs when humans add enough carbon dioxide to the atmosphere to push it past a threshold beyond which warming becomes self-sustaining and unstoppable1.
Venus is the canonical example of what that looks like. At some point in the past, it probably looked a lot like Earth. But then the planet heated up and boiled the oceans. Over time, ultraviolet radiation from the Sun split the water molecules into constituent hydrogen and oxygen atoms and the hydrogen escaped to space. In this way, the planet lost its water.
The loss of the ocean also caused the carbon cycle to shut down. This means that, unlike on Earth, where carbon dioxide is continuously removed from the atmosphere by dissolving into the ocean, there’s nothing removing carbon dioxide from the Venusian atmosphere. As a result, carbon dioxide accumulated in the atmosphere.
Today, Venus has an atmosphere that’s 90 times more massive than the Earth’s and it’s almost entirely carbon dioxide. The resulting greenhouse effect leads to surface temperatures around 450°C (850°F) — basically the temperature of your oven on self-clean cycle — and under pressures comparable to those at the bottom of the ocean.
In this hellish environment, spacecraft engineered specifically to survive Venusian conditions are still only able to last one or two hours before they are destroyed by the harsh environment.
So let’s take a step back and consider what it takes for the climate to run away.
Human-caused climate change is unmistakably distinct from Earth’s natural climate variability
Posted on 14 April 2026 by Guest Author
This is a re-post from Staying Curious by Dean Rovang
This post presents two figures that are the culmination of an extended effort to build the strongest possible empirical case for what the paleoclimate record shows about CO? and temperature. They draw on five independent regression fits across four independent archives and 66 million years of geological evidence. The argument stands on its own merits.
Earth’s natural climate relationship
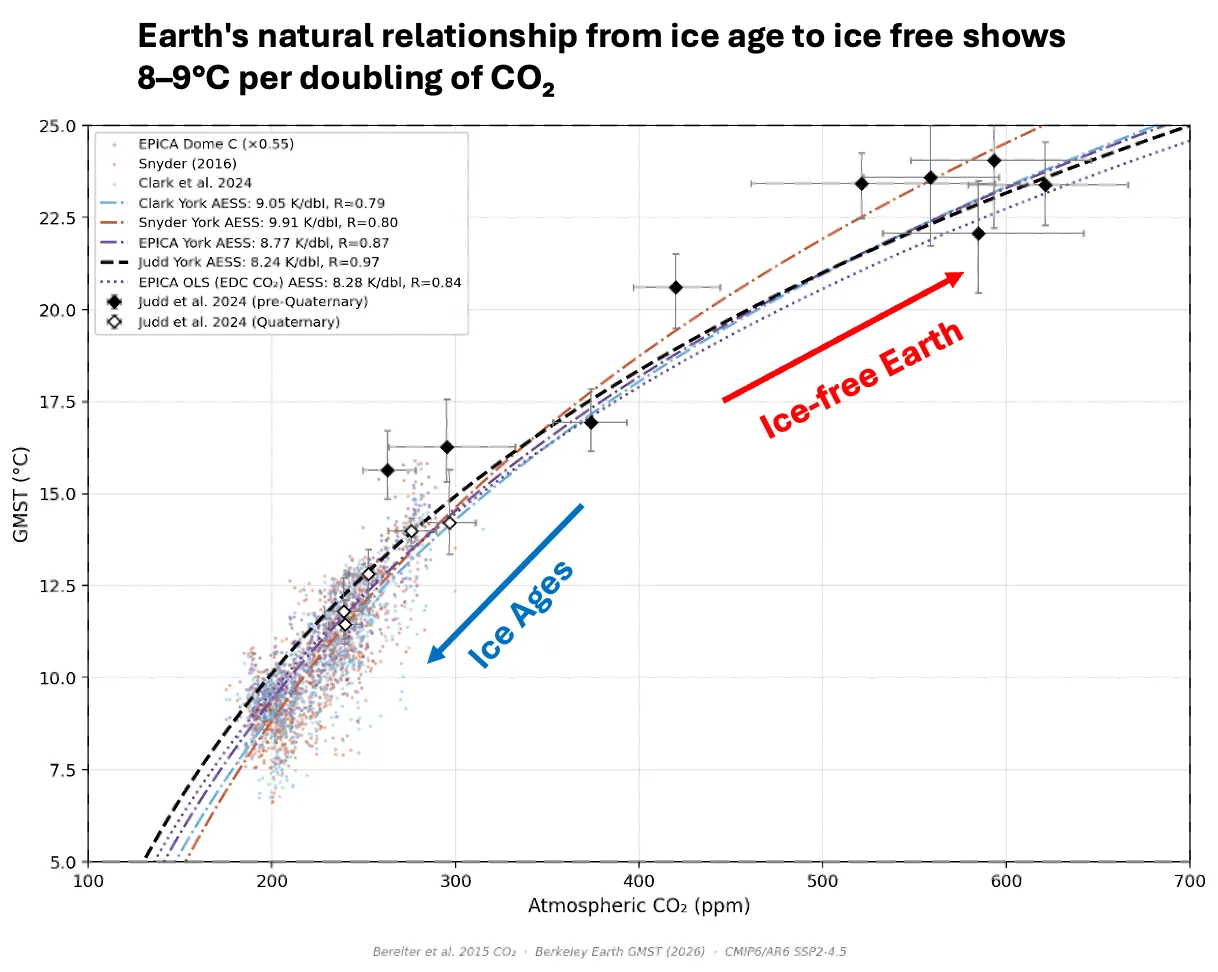
Three completely independent temperature reconstructions — the EPICA (European Project for Ice Coring in Antarctica) Dome C ice core, the Snyder (2016) Bayesian stack of 61 marine sediment cores, and the Clark et al. (2024) area-weighted reconstruction of 111 marine sediment cores — are plotted against the same CO? record on common axes. All three share Bereiter et al. (2015) as their CO? source, the best available composite for this period. The geological stages from Judd et al. (2024) extend the record to 66 million years.
Five regression fits are shown. Four use York/ODR regression — the method that accounts for measurement uncertainty in both CO? and temperature simultaneously, and the method used by Judd et al. themselves. The fifth is the canonical EPICA OLS fit using the original EDC CO? source, included because it was the first fit introduced relative to the Judd curve and remains the most conservative estimate in the set. All five land between 8.24 and 9.91 K/doubling of CO? — the same tier regardless of dataset, CO? source, or regression method.
The figure spans Earth’s climate from deep ice ages — CO? near 175 ppm, global temperatures near 8°C — to the warm Cenozoic periods when there were no significant continental ice sheets and sea levels were 60–70 meters higher. A natural question is whether the ice-albedo feedback drives this slope — and whether it therefore only applies to glaciated climates. The figure addresses this directly: most of Judd’s data comes from greenhouse climates with little or no continental ice — the Eocene, Oligocene, early Miocene — yet the same slope holds across the full range. If ice-albedo were the dominant driver, the relationship should look different in ice-free regimes. It does not, which Judd et al. themselves describe as surprising. The relationship appears to be a fundamental property of the Earth system across a wide range of boundary conditions, with and without ice sheets.
What’s cheaper: Fueling your car with gas or electricity?
Posted on 13 April 2026 by Guest Author
This is a re-post from Yale Climate Connections by Karin Kirk
he price of gasoline has spiked amid a U.S.-led war with Iran. It’s not uncommon for the fossil fuel economy to be disrupted by geopolitical conflicts, but now consumers have more options than ever to protect themselves from price hikes.
EVs are already putting a dent into oil consumption worldwide, and as gas prices climb higher, the simple efficiency of an EV could become all the more appealing. In all 50 states, the cost of home-charging an EV is considerably cheaper than fueling a car with gasoline.
The map above shows the cost of charging an EV at home. The price is expressed in “eGallons,” which is the cost of charging an EV by an amount equivalent to one gallon of gasoline.
I wrote about the math behind the eGallon and plotted a similar map of prices in early 2024, when gas was relatively cheap. And even then, EVs were much more economical to drive. But now, consumers have even more incentive to make the switch.
2026 SkS Weekly Climate Change & Global Warming News Roundup #15
Posted on 12 April 2026 by BaerbelW, John Hartz, Doug Bostrom
Stories we promoted this week, by category:
Climate Change Impacts (9 articles)
- The US is now paying more than any other country for climate change damage, study suggests "Despite being the biggest carbon emitter, the US is already paying a disproportionate price for the climate crisis" BBC Science Focus, Hatty Willmoth, Mar 31, 2026.
- The Western US is already running out of water — and summer is still months away The Western US is already running out of water — and summer is still months away Vox, Kiley Price, Apr 3, 2026 .
- Scientists warn the Gulf Stream is shifting north, which means an ocean current collapse is imminent Earthdotcom, Eric Ralls, Apr 4, 2026.
- Climate experts say spring is coming earlier. How will that affect agriculture and ecosystems? "An earlier spring affects when migratory birds arrive, leaves emerge, and fruit ripens — among plants and animals that determine ecosystem health." Grist, Héctor Alejandro Arzate, Apr 5, 2026.
- A biblical megaflood could hit the US at any moment. And that’s only the beginning "A flood, the scale of which has not been seen in centuries, is coming, scientists say. Can we prepare before it hits?" BBC Science, Tom Howarth, Apr 6, 2026.
- Strongest El Niño in a century? What this rare phenomenon could bring. "This year’s potential super El Niño is looking increasingly likely to have wide-reaching climate impacts that last into 2027." Washington Post, Ben Noll, Apr 6, 2026.
- A Super El Niño is coming. Here’s how a hotter ocean could change the weather near you CNN, Andrew Freed,an, Apr 7, 2026.
- The first predictions for hurricane season are in and El Niño’s fingerprints are all over it CNN, Mary Gilbert, Apr 9, 2026.
- The world just had its second-warmest March on record "Arctic sea ice had its lowest seasonal maximum and lowest March extent on record." Yale Climate Connections, Jeff Masters, Apr 9, 2026.
Skeptical Science New Research for Week #15 2026
Posted on 9 April 2026 by Doug Bostrom, Marc Kodack
Open access notables
Why we need to explore conflict and competition around solar geoengineering, Möller & Young, PLOS Climate
In an increasingly aggressive international political environment, solar geoengineering needs to be reconceptualized – not only as a response to climate change, but as an instrument of power. This conceptualization means going beyond focusing on cooperative scenarios in which the technoluogy is used to effectively reduce temperature rise while minimizing potential side effects. As scholars of international relations, we see a need for more interdisciplinary engagement with solar geoengineering scenarios that explicitly feature political conflict and competition. By anticipating and exploring these, we can better contribute to informing governance arrangements that might be able to prevent situations that undermine international political stability and efforts to address climate change.
El Niño Events Enhance Melting of Sea Ice in the West of Greenland, Zhang et al., Geophysical Research Letters
Using reanalysis data sets and numerical simulations, this study investigates the linkage between El Niño events and spring Arctic sea ice melt rate (AMR) in the west of Greenland. The results indicate that the accelerated spring AMR often corresponds to the previous winter's El Niño–like sea surface temperature anomalies. El Niño strengthens the Aleutian Low, facilitating the upward propagation of quasi-stationary planetary waves into the lower stratosphere and leading to a weakening of the polar stratospheric vortex in the North Pacific sector. This weakened vortex subsequently propagates downward into the troposphere over the North Atlantic sector in spring, inducing a cyclonic anomaly over the Svalbard Islands and an anticyclonic anomaly over the North Atlantic. Such conditions favor the development of southeasterly near-surface winds, which can transport warm air from lower latitudes northward, thereby influencing sea ice melting in the west of Greenland.
Increased Arctic Sea-Ice Variability Is Associated With Amplified Air-Sea Heat Fluxes, Wang et al., Geophysical Research Letters
While the role of long-term sea ice decline in shaping Arctic climate change is well-established, the contribution of short-term sea-ice variability remains insufficiently explored. Here we present observational evidence that since 2007, sea ice fluctuations in Arctic marginal ice zone have remained at a high level. The annual-mean daily variability of sea ice concentration rose by 11.4%, with high-variability days becoming more frequent, especially in summer and autumn. Composite analyses reveal enhanced net heat uptake in summer (+11.9%) and greater ocean-to-atmosphere heat release in winter (+45.3%), both of which intensify after 2007. Causal analyses reveal a feedback, with higher sea ice variability being closely linked to and reinforced by anomalous net heat fluxes. These findings highlight the increasing short-term variability of the Arctic sea-ice and its key role in regulating local air–sea heat exchange.
Decarbonising existing buildings with heat pumps – Early evidence and policy analysis for Switzerland, Patel et al., PLOS Climate
In order to overcome the problem that oil and gas boilers in existing buildings are typically replaced again by fossil fuel boilers, leading cantons in Switzerland have started to implement more targeted decarbonisation policies. The objective of the present paper is to critically discuss the experience made with policy measures for the decarbonisation of building-related heating systems in these cantons. For this purpose, semi-structured interviews were conducted as primary method. Early evidence indicates that the policies are effective by ensuring the transition to renewable heating technologies (primarily heat pumps). The implemented policy packages include coercive elements (mandatory renewable energy shares), subsidies as well as information and communication measures, resulting in a quasi-ban of fossil fuel boilers. Avoiding outright bans of fossil fuel use seems both effective to increase acceptance among building owners and reasonable to account for particularly demanding cases of boiler replacement (for which there is no technically or financially viable, fully renewable solution). Considering the very low carbon footprint of its electricity supply, Switzerland is a particularly convincing case for the transition from fossil fuel boilers to electric heat pumps. This is shown by means of an analysis of the CO2 emissions of heat pumps in comparison to gas and oil boilers across several European countries. We then compare the levelised cost of heat pumps for different subsidy levels. For a typical subsidy for the heat pump (equivalent to 11% of the investment cost), its levelised cost remains in an acceptable range compared to a gas boiler (7% more expensive). A sensitivity analysis shows the importance of high gas to electricity price ratios for financial viability. Evidence from leading cantons in Switzerland indicates that the chosen policy measures are effective, affordable and accepted and that they can be recommended to other countries.
From this week's government/NGO section:
Americans’ Shifting Views on Energy Issues, Brian Kennedy and Emma Kukuchi, Pew Research Center
The share of Republicans and Republican-leaning independents who say the country should prioritize oil, coal and natural gas over wind and solar power has doubled to 71% over the last six years. Majorities of Republicans see wind and solar power as less reliable than other energy sources, and decreasing shares of Republicans say wind and solar energy is better for the environment. An overwhelming majority of Democrats continue to prioritize wind and solar power and say the federal government should encourage their development.
INNOVATION INTERRUPTED: The Lasting Impact of Grant Terminations and Freezes at the U.S. Department of Energy, Tarak Shah,, US. Department of Energy Alumni Network
The scale of terminations and funding at risk is massive: DOE has announced the termination of 356 awards since January 2025, totaling $12.5 billion in federal funding. It has also threatened to terminate an additional 303 awards worth $12.2 billion. This action is part of a larger pattern of disruption that includes freezing projects at stage gates, not finalizing conditional awards, and reducing new solicitations, which puts Congressional goals for our energy sector, infrastructure, and domestic manufacturing at risk. Long Term Repercussions Exist for U.S. Energy Innovation: DOE’s actions profoundly undermine the reliability of federal grants as a mechanism for achieving national energy goals. This disruption has created deep uncertainty among private sector partners, with some awardees stating they will no longer pursue future DOE funding, posing a long-term risk to domestic energy innovation and deployment.
62 articles in 41 journals by 602 contributing authors
Physical science of climate change, effects
Combined Impacts of ENSO and Arctic Sea Ice on North American Climate, Yu et al., Journal of Climate 10.1175/jcli-d-25-0469.1
Global Observational Estimates of Thermohaline Transformations by Interior Ocean Mixing, Castro et al., Journal of Physical Oceanography 10.1175/jpo-d-25-0265.1
What the Iran conflict means for gas prices, clean energy, and the climate
Posted on 8 April 2026 by dana1981
This is a re-post from Yale Climate Connections
The U.S. and Israel’s attacks on Iran have sent oil and gas prices soaring. That could be a boon to cheap, clean technologies like electric vehicles, solar power, and wind – at least in the long run. But in the short run, the outlook is more complicated.
Why is the conflict causing oil and gas prices to spike?
Iran began restricting ship traffic through the Strait of Hormuz after the U.S. and Israel attacked Iran on Feb. 28, 2026. The strait is the narrow passage, about 20 to 40 miles wide, through which ships must navigate from the Persian Gulf to reach the Arabian Sea and global shipping routes.
 Data source: U.S. Energy Information Administration
Behind the strait lie five of the world’s 10 biggest oil-producing countries: Saudi Arabia, Iraq, the United Arab Emirates, Iran, and Kuwait. Despite efforts to shift some of these countries’ oil exports through pipelines and to allow Iran’s own oil tankers safe passage, International Energy Agency executive director Fatih Birol estimated that the war has caused the global oil supply to drop by more than 10%. His organization described it as “the largest supply disruption in the history of the global oil market.”
As a result, global oil prices have risen by $40 per barrel since the start of the conflict. Gasoline prices have followed suit, with the U.S. national average surpassing $4 per gallon on the final day of March, up more than a dollar from pre-conflict prices. It’s the third spike in fossil fuel prices in just the past five years, following COVID supply chain disruptions in 2021 and Russia’s invasion of Ukraine in 2022.
 Average price of a gallon of gasoline in the U.S. (left axis, brown; data from the U.S. Energy Information Administration) and West Texas intermediate oil price (right axis, black; data also from the EIA). (Graphic: Dana Nuccitelli)
And fossil fuel prices are likely to rise further. Countries agreed to release 400 million barrels of oil from their strategic reserves, and some oil tankers were already en route to their destinations when the conflict began, but the amount of lost oil production in the Middle East has now surpassed those numbers. Parts of Asia and Africa are beginning to experience fuel shortages, and Europe could follow suit as soon as this month. Meanwhile, the Trump administration has signaled that the end of the conflict is not contingent on reopening the Strait of Hormuz.
Fact brief - Do wind turbines utilize land for electricity generation more efficiently than fossil fuels?
Posted on 7 April 2026 by Sue Bin Park
![]() Skeptical Science is partnering with Gigafact to produce fact briefs — bite-sized fact checks of trending claims. You can submit claims you think need checking via the tipline.
Skeptical Science is partnering with Gigafact to produce fact briefs — bite-sized fact checks of trending claims. You can submit claims you think need checking via the tipline.
Do wind turbines utilize land for electricity generation more efficiently than fossil fuels?
 Wind turbines require less land use for the same amount of energy generated by oil or natural gas, and land between turbines is available for agriculture and wildlife habitats.
Some sources report larger footprints by ignoring space between turbines, or expanding the area of a wind farm based on whether turbines are visible in the distance. In reality, according to Princeton University, land occupied by wind in a U.S. net-zero emissions plan would have a footprint between 10-30% of the 8 million acres currently occupied by natural gas and oil operations.
Cultivated and wild plant life can safely grow, and terrestrial animals safely roam, up to a turbine’s base. Turbines on farmland take up only 5% of the project area, with the remaining land available for other purposes.
Compared to the widespread spills, soil and water contamination, and warming impacts of fossil fuels, wind produces significantly less environmental disruption.
Go to full rebuttal on Skeptical Science or to the fact brief on Gigafact
This fact brief is responsive to quotes such as this one.
Sources
Princeton University Net-Zero America
Bloomberg The U.S. Will Need a Lot of Land for a Zero-Carbon Economy
The Electricity Journal Renewable Energy's ‘Footprint’ Myth
ScienceDaily Clearing the air: Wind farms more land efficient than previously thought
World Resources Institute How Wind Turbines Are Providing a Safety Net for Rural Farmers
U.S. Department of Energy WindVision: A New Era for Wind Power in the United States
EESI Fact Sheet | Climate, Environmental, and Health Impacts of Fossil Fuels (2021)
Columbia Law School Sabin Center for Climate Change Law Rebutting 33 False Claims About Solar, Wind, and Electric Vehicles
Please use this form to provide feedback about this fact brief. This will help us to better gauge its impact and usability. Thank you!
Our new research is published - but we're not done yet with the 'Experiment'
Posted on 6 April 2026 by John Cook, BaerbelW, Doug Bostrom, dana1981
Many thanks to the 11 contributors who have offset our publication fee by some $589.25 at the time of this update, April 27!
13 years ago the Skeptical Science team ran a research project to quantify scientific consensus on global warming, finding that 97% of relevant climate papers agreed that humans were causing global warming. We put a call out for contributions to help us cover the cost of the journal publication fee. And we reached this goal within 9 hours! The paper went on to be tweeted by President Obama the day after publication, and was cited by Prime Ministers, Senators, Congresspeople, and late night TV comedians, not to mention winning awards and being downloaded over 1.5 million times. Not bad for a crowd-funded research paper!
Today in 2026 we’re now delighted to announce that the Skeptical Science team has just published our results from a new research project, in Geoscience Communication. Our culminating peer-reviewed research report (Cook et al. 2026) represents years of careful data collection and analysis, and is a critical step in providing real-world evidence for effective climate communication.
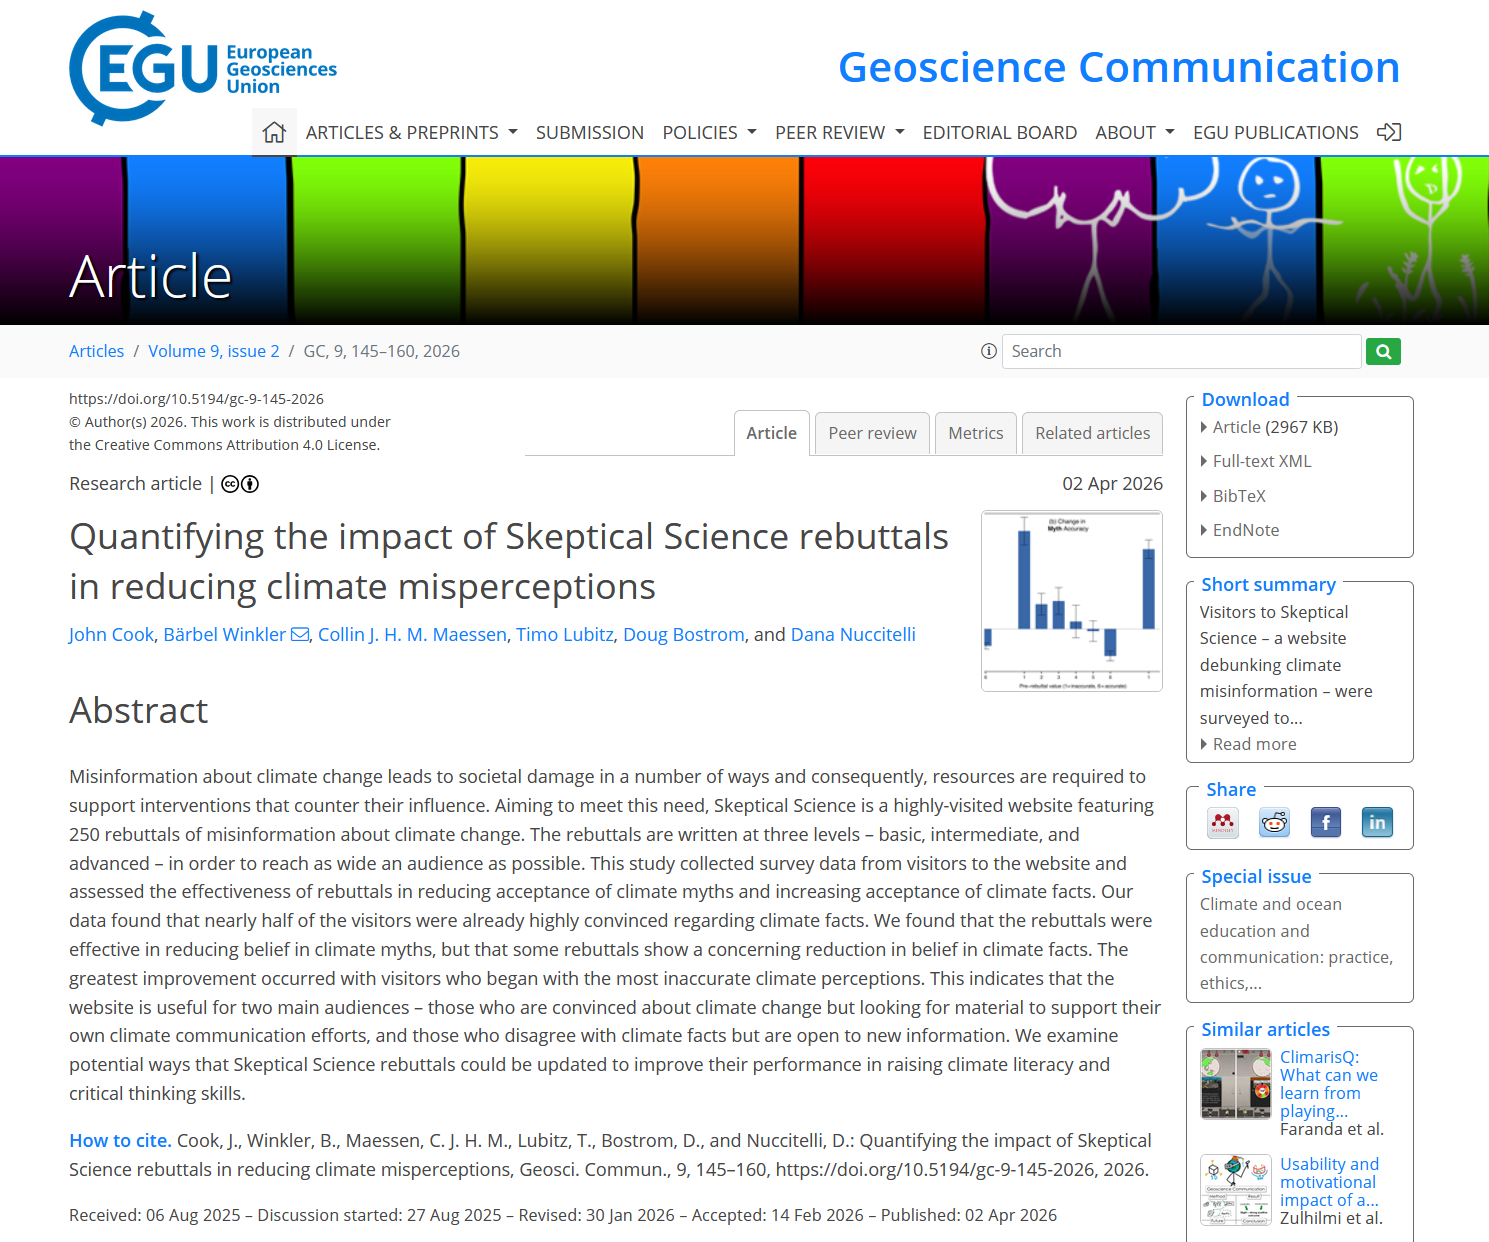
Screenshot of the abstract from our paper published in Geoscience Communication (Cook et al. 2026).
Quantifying the Impact of Skeptical Science Rebuttals in Reducing Climate Misperceptions.
We designed our study to assess the real-world effectiveness of Skeptical Science's 250+ rebuttals in reducing acceptance of climate myths and increasing acceptance of climate facts.
Over a period spanning from November 2021 to July 2025, we conducted a field experiment by collecting survey data from visitors directly on our skepticalscience.com website. Specifically, visitors who arrived at a rebuttal from a Google search in the US, UK, or Australia were invited to participate. You may even have been among readers seeing the related screens!
2026 SkS Weekly Climate Change & Global Warming News Roundup #14
Posted on 5 April 2026 by BaerbelW, John Hartz, Doug Bostrom
Stories we promoted this week, by category:
Climate Change Impacts (8 articles)
- `Very alarming` winter sees Arctic sea ice hit record-low for second year running The biggest distinctly continues to get smaller in the Arctic, as maximum ice extent for this past winter follows a downward trend caused by a warming planet. Carbon Brief, Carbon Brief Staff, Mar 27, 2026.
- Fire season fears grow amid western heat wave CNN, Andrew Freedman, Mar 27, 2026.
- As a mind-boggling heat wave begins to wrap up, we look at some initial numbers "Over 1,500 new monthly records for March and over 500 tied monthly records with virtually no modern equivalent event in any month." The Eyewall, Matt Lanza, Mar 30, 2026.
- Oceans are absorbing the Earth’s excess energy. That’s bad news for food systems. "As the planet traps more energy than it releases, the pathways for global food production are being upended." Grist, Frida Garza, Mar 31, 2026.
- How wildfires and storms drove insurance losses in 2025 – in three charts "Extreme weather events around the world, such as wildfires and storms, were the major driver behind $107bn in insured losses in 2025, according to industry data." Carbon Brief, Multiple Authors, Mar 31, 2026.
- ‘On a whole other level’: rapid snow melt-off in American west stuns scientists "Experts say brutal March heat has left critical snowpack at record-low levels – and key basins in uncharted territory" The Guardian, Gabrielle Canon, Apr 1, 2026.
- The 2026 Southwest U.S. heat wave was one of the six most astonishing weather events of the century "From the Pacific Northwest to Antarctica, it’s extraordinary warmth that’s punching through climate norms with the most force." Yale Climate Connections, Jeff Masters & Bob Henson, Apr 3, 2026.
- From early birds to emerging butterflies: UK shows signs of earliest spring on record Citizen science data reveals early flowering, nesting and insect activity as global heating accelerate seasonal change World news The Guardian, Patrick Barkham, Apr 04, 2026.
Climate Policy and Politics (5 articles)
- Vermont Hits Back at Trump’s Effort to Block ‘Climate Superfund’ Law "The law would make fuel companies help pay for damages caused by climate change. The administration argues it’s unconstitutional." The New York Times, Mar 30, 2026, Karen Zraick , Mar 30, 2026.
- The Trump Administration’s New Biofuels Targets Threaten Carbon-Rich Rainforests "The U.S. doesn’t have enough bio-based diesel to meet the administration’s new mandate, so blenders will have to import yet more foreign crop-based oils." Inside Climate News, Georgina Gustin, Mar 31, 2026.
- Trump’s Iran war and drilling push show ‘dangerous volatility’ of fossil fuel era "Critics say president is locking into 20th-century energy systems even as his ‘bet’ on oil and gas ‘isn’t going so well’ " The Guardian, Oliver Milman, Mar 31, 2026.
- What the Iran conflict means for gas prices, clean energy, and the climate "U.S. gas prices could hit $7 a gallon if the Strait of Hormuz remains restricted through June. Here’s how that could affect EVs, wind, and solar." Yale Climate Connections, Dana Nuccitelli, Apr 1, 2026.
- ‘Like relying on a drug dealer:’ The world’s dependence on oil and gas has exposed a dangerous vulnerability CNN, Laura Paddison & Ella Nilsen, Apr 2, 2026.


