


 Arguments


DMI data on Arctic temperatures: Hide the Increase?
What the science says...
| Select a level... |
 Basic
Basic
|
 Intermediate
|
 Advanced
| ||||
|
While summer maximums have showed little trend, the annual average Arctic temperature has risen sharply in recent decades. This is indicated both by the GISS, DMI data and other high latitude data sets. |
|||||||
Climate Myth...
DMI show cooling Arctic
From DMI we learn, that Arctic 80N-90N temperatures in the melt season this year is colder than average. This was the case last year too, while earlier years in the DMI analysis period (1958-2010) hardly ever shows Arctic melt season temperatures this cold (Frank Lansner)
On Misleading Comparisons between the Danish Meteorological Institute (DMI) Arctic Air Temperatures and the Goddard Institute of Space Science (GISS) Arctic Surface Temperature Anomalies, and Implications for Arctic Warming.
A recent WUWT article by Frank Lansner, August 5th 2010 has the heading “DMI polar data shows cooler Arctic temperature since 1958”. Peter Berenyi also posted a similar chart here on Skeptical Science. Frank Lansnser goes on to show data from GISS July polar views (where individual grid cells show large variability) and compares this with graphics of DMI data for July 2010 to cast doubt on the validity of the GISS gridded values in the polar regions. This follows on from similar points made by Steve Goddard, on WUWT and another article by Harold Ambler which tries to show how DMI is based on more data measurements than GISS, followed by questions and implications about the reliability of GISS gridded values in the Arctic region.
Similar claims that the DMI data shows Arctic “cooling” or highlights problems with other temperature data sets (eg from GISS, which mostly interpolates over the Arctic ice) appear on other websites. Many other articles have attempted to compare Arctic trends derived from satellite based microwave sensors with surface based (such as GISS) Arctic values, highlighting apparent differences.
This post seeks to correct the public misunderstandings that these articles may cause, primarily about the claim of Arctic “cooling” but also about comparisons between the DMI 2m Arctic absolute temperature time series and GISS Arctic temperature anomaly data. In the following analysis all data is from original sources (such as DMI) rather than data “extracted” from web page graphics.
The Danish Meteorological Institute (DMI) Arctic 2m air temperature data
The Danish Meteorological Institute (DMI) Arctic temperature data is an output of the latest operational model as used for meteorological forecasting by the European Centre for Medium-Range Weather Forecasts (ECMWF). This output is an average of all model points at 2m height, currently on a 0.5 degree grid over the most northerly part of the Arctic, above 80N. Because the number of land stations in the World Meteorological Organization (WMO) list above 80 degrees North is very small indeed (a handful), measured data inputs for the model must be supplemented by other sources for high resolution meteorological work. The models assimilate inputs from weather stations, drifting stations and buoys, radiosondes, aircraft, vessels and more recently infra-red and microwave satellite based sensors.
The data is used to create a full three dimensional deterministic model of the global atmosphere which can be run forwards in time so that dynamic atmospheric conditions (weather) and regional climate can be analysed and forecast (or reanalyzed using historical observations as inputs) to the resolution limits of the model.
The resolution of these operational models has continually increased to take advantage of increased computing power and higher spatial resolution satellite data. This means that the DMI Arctic temperature data has had several changes in its history.
Between 1958 and 2002, the output of the ECMWF 40 year reanalysis (ERA-40) is used, (approximately 120km grid horizontal resolution). The ERA-40 re-analysis itself has three main sections of assimilated data, using pre-satellite observations up to 1972, then assimilating some satellite sensor observations, starting with the Vertical Temperature Profile Radiometer (VTPR) on early NOAA satellites, up to 1987/1988, and then using more recent observation types and more satellite sensors, both Infra Red and Microwave, in combined sensor packages such as the Television Infrared Observation Satellite (TIROS) Operational Vertical Sounder (TOVS), Special Sensor Microwave/Imager (SSM/I), Advanced TIROS Operational Vertical Sounder (ATOVS) amongst others, on platforms like the ERS (European Remote Sensing Satellite) and later NOAA series of satellites from 1987 onwards. In 2002 the DMI data switches to a higher resolution T511 model (40km resolution), then in 2006 to T799, (25km) and from 26th Jan 2010, T1279 (16km). These changes could be linked to minor differences in the apparent Summer melt temperature, (there are small differences between the ERA-40 and the T511 outputs in the overlap period in 2002).
Assimilation of Satellite Sensor Surface Temperature data in the Arctic
In general the satellite data has almost full polar coverage and very high spatial resolution, but lower absolute accuracy over ice. For surface measurements Infra red satellite sensors are used as they measure the infra-red energy (Long wave radiation) emitted directly from the Earths surface (skin temperature).
Large bias differences exist in uncalibrated absolute surface temperature estimates from some of the different satellite sensors, eg Lakshmi 2002 discusses global differences between TOVS and Advanced Very High Resolution Radiometer (AVHRR) data. These longer time series from equivalent satellite sensors are themselves made up of data from several (not necessarily overlapping) satellite missions, so care must be taken when analyzing long term trends (see analysis of calibration of TOVS data for some visual representations and context).
Direct comparisons of measurements from surface based sensors and remote sensors like the more recent Moderate Resolution Imaging Spectroradiometer (MODIS) on the TERRA and AQUA satellite platforms show that cloud cover can bias infra red Arctic surface temperature measurements low, for example see Hall 2004 on MODIS Sea Ice Surface Temperature, Scambos 2006 on validation of AVHRR and MODIS ice surface temperature, Randriamampianina 2009 on assimilating ATOVs data in Polar regions, and Koenig 2010 on MODIS data compared with high accuracy surface-based thermochron sensor data on Greenland).
However, although work is always ongoing to reduce errors, the models allow this high resolution data to be used to interpolate between the sparse but very accurate observations from land stations, which form a network of absolute temperature value “tie points” - allowing bias calibration of the fine scale overall satellite derived relative changes.
In general, the skill of such high resolution models to match observations has improved incrementally with each step increase in resolution. Nevertheless DMI recommend that the 2m Arctic air temperature data should not be compared with overall Arctic temperature estimates from other data sets, which generally cover a wider area (usually above the Arctic Circle at approximately 66N) where more land station data is available. Despite this, the DMI data has been used as a reference for comparison.
Surface Air Temperatures above the Melting Ice in the Arctic Summer
Most of the area above 80N is (currently) still covered in permanent sea ice. In the Arctic Summer when the surface ice is melting, the air temperature close to the surface is limited by this ice melt temperature to just above zero degrees C (Rigor 2000). This is why the Summer air temperatures have not varied much over the entire instrumental period. This maximum temperature “clipping” effect is clearly seen on the following chart which shows measured 2m air temperature data from former USSR Polar Stations NP-6 and NP-30 from positions above 80N (see Lindsay 1998 for more detail). Data from these “North Pole” (NP) stations is considered to be the most accurate Surface Air Temperature (SAT) data from the Arctic Ocean.
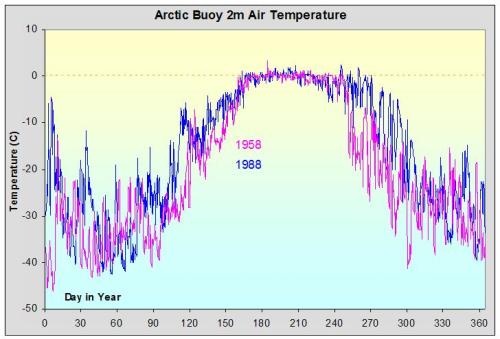
Figure 1: Former USSR Arctic Station 2m air temperature data from NP-6 and NP-30
This behavior is also clear in all other polar data sets including those from the International Arctic Buoy Programme (IABP), individual stations (such as Eureka, see Lesins 2010), Surface data AVHRR infra red sensors (carried on various satellites from TIROS-N in late 1978 to the current NOAA series of satellites), see Comiso 2006 (figure 2). The zero degrees Summer melt maximum is consistent enough to be used to calibrate Arctic temperature sensors suspected of bias (see Rigor 2000 figure 4). It is therefore not surprising that this limiting effect is also apparent on the gridded DMI data, here monthly (30 day) rolling averages, averaged decadally for clarity (the zero limit is less “flat-topped” in this case partly due to the averaging of data over 10 degrees of latitude). This pattern is likely to prevail whilst substantial permanent sea ice remains above 80N.
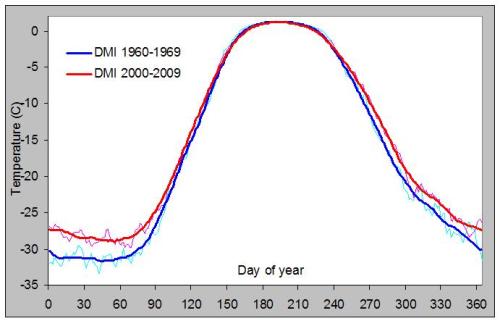
Figure 2: 30 day rolling average DMI temperatures, averaged over two decadal periods showing increasing average seasonal temperatures over the DMI record
Clearly high Arctic Summer surface temperatures just above zero are not really an indication of anything except proximity to a melting ice surface. To claim that the Arctic is cooling based on Summer surface temperature values over sea ice is to misunderstand the data.
Average Arctic Temperature Trends
It is also evident in all of these Arctic data sets that the average temperatures in Winter, Spring and Autumn have generally increased over the measurement period. It appears that the overall seasonal cycle is riding on a gradually warming average value, but peak positive excursions are being limited by the ice melt temperature in Summer.
It would be intuitive that these seasonal warming patterns would affect the overall DMI temperature anomaly trend, and this is the case. If we plot the entire daily DMI temperature data, and then a 365 day rolling average, and calculate a linear best fit, we end with a positive trend of 0.383 degrees C per decade.
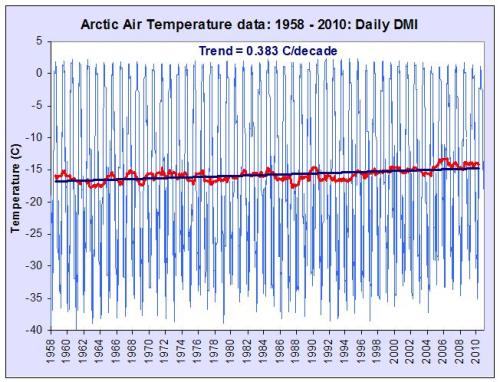
Figure 3: DMI daily temperature values, annual average and linear trend over the entire record period
Thus the reality is that the annual average temperature as indicated by DMI has risen at rates around twice the global average over the past 50 years, which is entirely consistent with other Arctic data sets, including the data from GISS. If we plot this average positive trend and five year running averages on the same vertical scale below (red) it gives clearer context to the Lansner chart of Summer melt average temperatures (green).
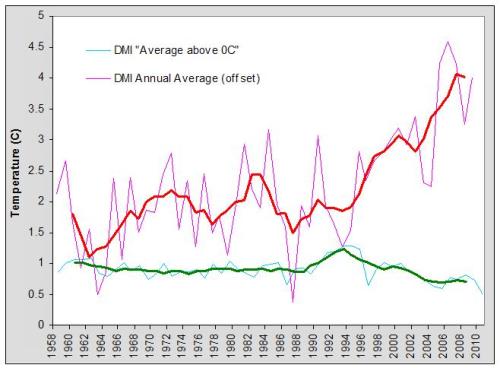
Figure 4: DMI summer melt season temperatures and annual DMI temperature anomaly as well as five year running averages
GISS data
The Goddard Institute of Space Science (GISS) global surface temperature anomaly series is based on observations rather than models. Its primary usefulness is as a constantly updated indicator of global or large scale regional surface temperature changes. It uses a publicly available global surface temperature data set of over 6000 ground stations on land, from the Global Historical Climatology Network (GHCN), and Antarctic data from Scientific Committee on Antarctic Research (SCAR), and two different publicly available SST (Sea Surface Temperature) data sets, the Met Office Hadley Centre's Sea Ice and Sea Surface Temperature data set (HadISST1) up to 1982 (vessel based) and the National Oceanographic and Atmospheric Agency (NOAA) Reynolds Optimum Interpolation Sea Surface Temperature analysis (OISSTv2) subsequently, the latter being mainly satellite based. These values are also cross checked against other available data sets and satellite data sets. The measurements used by GISS are gridded at either 1200km or 250km resolution, with appropriate weighting in grid cells containing both land and ocean. The SST data where available is used up to 100km from any coast, but data from any source is extended to a maximum radius of 1200km if no other measured data points are present within this range.
For the high Arctic, we have already noted that there are relatively few land stations, (a handful above 80N), and most of this area is currently still covered by permanent sea ice. A study using data from stations and Polar drifting ice buoys showed that near surface air temperatures over the pack ice are relatively homogenous, with a CLS (correlation length scale) of 900-1000 km (Rigor 2000). Though this can reduce slightly in the Summer between the coast and ice covered areas. Obviously SST can not be used in this region, as the sea surface is frozen. In many data sets, models and re-analyses, it is standard to set SST to freezing point of sea water (around -1.8 degrees C) where there is >90% ice cover eg HadISST1 (described in Rayner 2003) or recent NOAA SST modeling which uses fixed and drifting buoys, ship and surface station and satellite data (currently from NOAA-18 AVHRR and the European Meteorological Operational Satellite Programme (METOP-A). In open Ocean SST tracks variations in Air temperature, but this is not the case near the transitional and mobile ice “boundaries”. This is one reason why GISS does not currently use SST data in the seasonal ice region above 75N, even when this data is seasonally available, - as is increasingly the case due to diminishing trends in ice extent, and better coverage due to satellite data. See current data from the National Snow and Ice Data Centre (NSIDC). However, the data is treated consistently over the longer term, which is very important for trend analysis.
This means in the Arctic region, GISS data is relatively coarse grained, as individual grid cells above 80N may include station data interpolated out to as much as 1200km, and are likely to show the higher short term variability which is characteristic of data from individual Polar stations.
However, given all of the above, and the significant differences in horizontal resolution, and methodology, and the caveats and cautions from both DMI and GISS, how do monthly or annual time series compare?
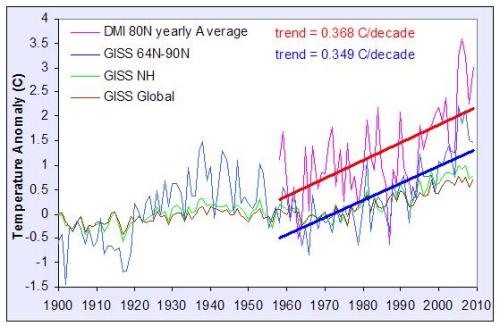
Figure 5: Annual DMI and GISS Arctic temperature anomalies and trends
Here the annual average values for each year have been plotted for both the polar “zonal” GISS data (64-90N) and the DMI Arctic data, and the trends calculated for both data sets for the full DMI period. Note the relatively high variability in both polar data sets compared with the “global” or “northern hemisphere” averages. At this resolution the correlation between DMI and GISS averages is reasonable, and the 50 year gradients are statistically indistinguishable. These trend figures are also consistent with those from a recent comprehensive surface data based study of the Arctic (Bekryaev 2010) which gives 0.364 degrees C/decade from 60-90N over this same period.
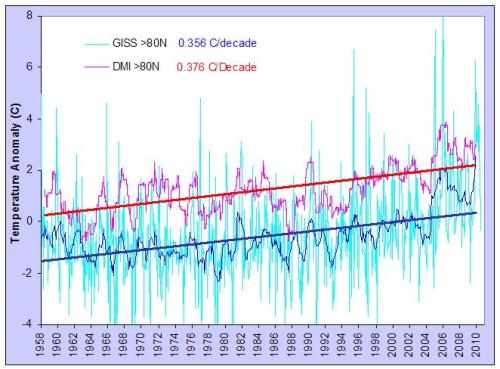
Figure 6: DMI and GISS 50 year temperature anomalies and trends, from higher resolution data
Zooming to higher resolution and using Monthly GISS average gridded values (light blue) above 80N to plot a 12 month rolling average (dark blue), and using the DMI daily values to plot an equivalent 365 day rolling average (pink), we can see that there is good correlation of the high resolution model based DMI values and the lower spatial resolution GISS data, and the significant positive temperature trends are again consistent.
What Lansner (and others) have effectively done is to pick one of the peak monthly GISS values (light blue) and compared the average DMI value for that month. Clearly this is likely to give a misleading result (as it would with any monthly sample from any Arctic data set) when compared to the overall records.
Is the GISS Arctic data consistent with other studies of Arctic temperature trends and other data sources?
The former USSR polar ice station programme and IABP programme give 2m air temperature data from the high Arctic. There are also a few other high Arctic stations with limited data. Several attempts have been made to homogenize and assimilate these data sets into a common Arctic time series. One example is Polyakov 2002. The associated data is available from the International Arctic Research Centre (IARC) at the University of Alaska Fairbanks).
It is no surprise that temperature data from before the ice buoy and drifting station programs should be consistent in both this data set and GISS, as they are based on identical station data. Comparing the results with GISS over the same grid area over dates where the recent ice station and buoy data is used, the correlation is just as high.
What about the other observation based data sets, and other independent satellite data? Monthly averaged global data sets often cited and discussed are (HadCRUT3 from the UK Met Office Hadley Centre in conjunction with the Climate Research Unit (CRU) and the Lower Troposphere weighted values from combined satellite Microwave Sounder Unit (MSU) and Advanced MSU (AMSU) time series from the teams at Remote Sensing Systems (RSS) and University of Alabama in Huntsville (UAH).
Microwave “sounders” (see Waters 1975) measure microwave radiation at multiple characteristic frequencies, each emitted from specific components (eg Oxygen molecules) of the atmosphere which are present in different relatively broad vertical “profiles” within the overall atmospheric column. They do not directly measure surface temperature. Absolute values show less seasonal variation than at the surface, whilst the annual average temperatures are a few degrees colder. The Lower Troposphere MSU time series are made up of data from several similar sensors on overlapping satellite missions. An excellent graphical overview of these missions and updated recalibrated results are given on the NOAA site for Microwave Sounding Calibration and Trend (MSCAT).
A superficial analysis of publicly available “Arctic” subsets of these data series indicates that whilst all data sets show strong warming, there are differences in positive gradient between data sets over the satellite measurement period. The interpolated GISS 64-90N product gives 0.62 degrees C/decade over the satellite period (since 1979), UAH North Polar subset is 0.47 degrees C/decade, HadCRUT3 from 65-90N gives 0.45 degrees C/decade, and RSS from 60-82.5N gives 0.34 degrees C/decade. All of these data sets should be used with caution when making comparisons at high latitudes, as they do not have identical coverage. HadCRUT3 uses a similar gridded format to GISS, but a different methodology which does not include extrapolated Arctic grid cell values. Care is also advised in the use of MSU data at high latitudes due to MSU sensor scanning geometry, for example the standard zonal “polar” data from RSS covers from 60N to 82.5N. Data above this latitude is considered unreliable, and is not available. If the data from each global data set is gridded over approximately equal Arctic areas then the differences reduce to well within the error bars of the data.
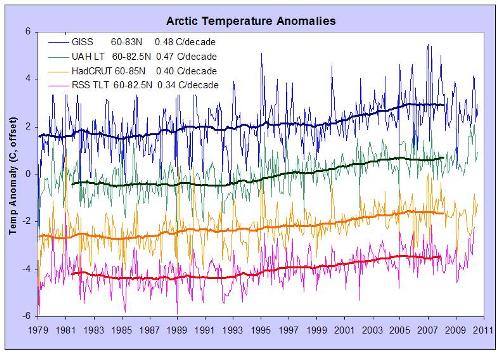
Figure 7: GISS, HadCRUT3 and MSU satellite sensor data gridded over similar areas, with linear trends and five year running averages shown
From the above discussion we see relatively small changes in latitudinal extent can significantly affect the trends of average gridded values in the polar region. This is because of the strong increase in temperature anomaly trends as we approach the poles, particularly at high Northern latitudes. This gradient (Arctic amplification) has increased in recent decades, for example see (Vinnikov 2006 and more recently Zou 2009 on ongoing MSU intercalibration efforts, where figure 9 shows the significant warming trend gradient with latitude (as measured with MSU), with temperature anomaly trends between 0.7 and 0.8 degrees C/decade above 80N for the 1987 to 2006 period. To help visualize this, the trend values for 10 degree latitudinal zones for GISS Land and Ocean, RSS Lower Troposphere and the latest ERA-Interim re-analysis surface temperature over the last thirty (where available) and last twenty years are shown below.
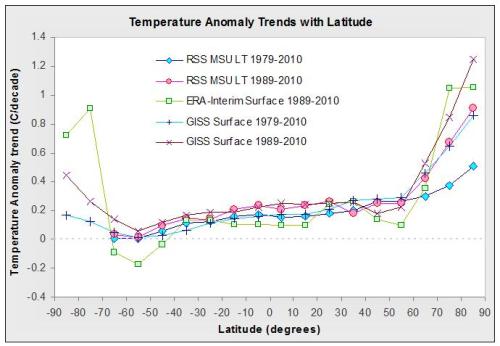
Figure 8: MSU Lower Troposphere, and GISS and ERA-Interim surface temperature trend variation with latitude for most recent 30 and 20 year periods
For context the GISS trend values for 64 to 90N are given as 0.62 degrees/decade since 1979, The DMI trend for above 80N over the same period is 0.68 degrees C/decade. The comprehensive surface station data based on Bakyraev 2010 gives 0.639 degrees C/decade for 60-90N between 1979 and 2009. The full coverage AVHRR decadal trend from 1981 to 2005 is 0.61 degrees/decade above 60 degrees N, but 0.72 degrees C/decade inside the Arctic Circle (around 66 N) whilst the IABP polar buoy data set gives 0.88 degrees C/decade between 1979 and 1999 for measurements which are (mostly) well inside 80N. The newly available (2009) and updated high resolution ERA Interim re-analysis gives even higher trend values between 70-90N of around 1.0 degrees C/decade over the twenty year 1989 to 2010 period at the surface, where warming has been shown to be strongest (see Screen and Simmonds 2010). If the ERA-interim product is spliced with ERA-40 (to minimize differences in the overlap period) the result for the surface gives 0.78 degrees C/decade between 1979 and 2010 which is consistent with the values above over the same three decade period.
Thus conclusions from an objective analysis of available data, and recent peer reviewed work, whether based on updated independent observations at various resolutions, or state of the art high resolution climate modeling using all available data sources, is that the Arctic is experiencing strong warming, roughly double the global average, and showing increasing surface temperature trends with higher latitude.
Whilst some caution is advised by GISS in using the interpolated data in the Arctic region, it appears that GISS trends in the Arctic region as a whole are consistent with other high latitude data sets, and show similar trends (in terms of annual averaged values) with other data sets which cover the region above 80N.
Last updated on 23 October 2016 by Peter Hogarth. View Archives


I think figure 1 gives the deniers some ammunition to work with.
bozzza, a little more argument would be helpful.
Ok, well i am making a general comment about the issue of document shock.
Many diagrams or charts only show a slight result. Some might show more but the point I am making is about getting to the guts of it otherwise the groupthink of democracy will never be convinced enough to vote for action.
This, I suppose, begets the idea of the necessity of responsible leadership.
Ah, OK: I suppose I am making the general point about document shock making people sick of reading documents properly.
Sorry,.(.. whoah is us!)
Please, stop measuring temperatures during the melt season! It's hidden, because it's latent heat . And the more ice melts the cooler the environment will be. Every kilo of melted ice cools 80 liter water with 1 degree C.
An, no Frank, melting ice does not cool the environment. No, melting ice does not cool water - unless you are adding ice to warmer water. In such a case (warm water + ice), the water will cool to zero in proportion to the amount of ice that melts (energy equivalence), and then the ice/water mix will remain at 0C. The ice.water proportions will then change depending on whether you are adding or removing energy from the mix.
In the natural environment, during the melt period, the ice/water mix is already at 0C, and adding energy causes the ice to turn to water - all at 0C. Once the ice melts, continued additions of energy will then warm the water.
...and during that period, knowing temperature is useful. In fact, it can tell you a lot about whether there is ice/snow or water or a mix.
You should seriously sit back and ponder the possibilty that people who have been studying these things for centuries actually might know a few things that you do not know.
Is the mean ocean temperature and/or mean air temperature at the e plat regions greater than the global mean (1.0-1.1 °C in the car of air temperature) or less than. I take it from this thread that it's the ice mass which determines the air temperature, rather than the other way around, acknowledging there must be a conservation of energy.
"e plate" → "polar"
"car" → "case"
Hi WEP,
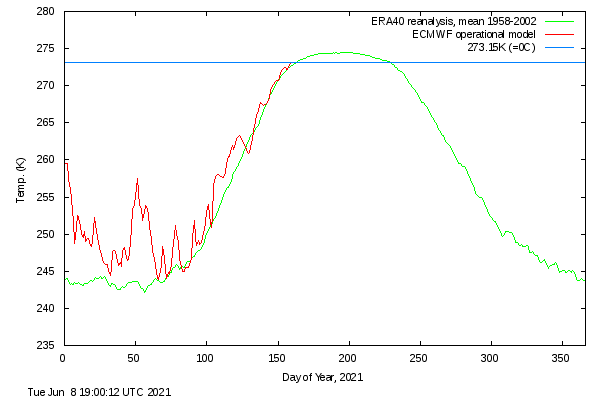
The "freezing point" of salty sea water is below 0C. As luck would have it DMI "Arctic" temperature has just surpassed that temperature for the first time in 2021, and earlier than the climatology:
https://GreatWhiteCon.info/2021/06/facts-about-the-arctic-in-june-2021/#Jun-09
Note that the blue line at 0C is therefore actually above the "melting point" of ice floating in said salty Arctic sea water. Note also that air temperature above the ice won't rise very far above that line for the rest of the brief Arctic summer.