Climate Science Glossary

Term Lookup

Enter a term in the search box to find its definition.

Settings

Use the controls in the far right panel to increase or decrease the number of terms automatically displayed (or to completely turn that feature off).

Term Lookup

Settings


All IPCC definitions taken from Climate Change 2007: The Physical Science Basis. Working Group I Contribution to the Fourth Assessment Report of the Intergovernmental Panel on Climate Change, Annex I, Glossary, pp. 941-954. Cambridge University Press.

Home Arguments Software Resources Comments The Consensus Project Translations About Support

Twitter Facebook YouTube Mastodon MeWe

RSS Posts RSS Comments Email Subscribe


Climate's changed before
It's the sun
It's not bad
There is no consensus
It's cooling
Models are unreliable
Temp record is unreliable
Animals and plants can adapt
It hasn't warmed since 1998
Antarctica is gaining ice
View All Arguments...


Username
Password
New? Register here
Forgot your password?

Latest Posts

Archives

Northern hemisphere warming rates: More than you may have heard

Posted on 14 January 2011 by muoncounter

Guest post by muoncounter

Winter is the time of year when denials of global warming seem to come from all sides.  It is therefore a useful time to determine just what our current rates of warming are.

The very thorough SkS post Assessing global surface temperature reconstructions put the average global warming trend at 0.14-0.16 deg C/decade.

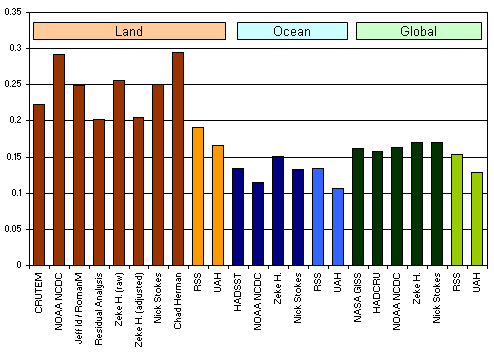
This rate is typical of the linear trend of modern temperature records which in some cases go back to 1880.  And some skeptics take comfort in this rate, claiming that it is nothing to worry about.  But is this rate of change an accurate description of what we are currently seeing?

A more in-depth look at surface temperature trends reveals obvious differences in hemispheric warming rates.


 --- NASA GISS, 7 Jan 2011

The northern latitudes (upper graph) have warmed more than the rest of the globe.  This figure also makes it clear that the rate of warming since approximately 1970 is much greater than the linear trend over the entire record.  

In his 2007 testimony to the US Senate, Dr. Kevin Trenberth described such an observable increase in warming rates in recent decades:

The 2007 Assessment of Climate Change

For the global average, warming in the last century occurred in two phases, from the 1910s to the 1940s (0.35°C or 0.63ºF), and more strongly from the 1970s to the present (0.55°C or 1.0ºF) at a rate of about 0.16ºC (0.3ºF) per decade. An increasing rate of warming has taken place over the last 25 years, and 12 of the 13 warmest years on record have occurred in the past 13 years.

The 2007 Assessment of Climate Change

A recent SkS article on Canada showed a warming trend of 0.5 degC/decade during the last 30 years.  Closely related are the 30 year warming trends (0.4 degC/decade typical) calculated for individual stations in northwestern US and southwestern Canada.


This begs the question:  What is the recent (30 or more year) warming rate in other parts of the northern hemisphere?

The 2007 Assessment of Climate Change

A surprisingly straightforward way to analyze temperature trends over large areas is by comparison of the long term (100 year) trend to the more recent (50 year) trend.  This Mapview interface to the HadCrut/GHCN data makes this task very easy.  Individual 5x5 degree grids may be selected and a linear fit applied (as shown in Figure 1a).  The time window may then be altered from this graph screen, giving a recalculated linear fit (Figure 1b) upon redraw. The slope of each linear fit in degrees C per decade, along with an estimate of statistical significance, is given in the right-hand panel of each graph.

Figure 1a.  100 year trend for 5x5 degree grid in central Europe(50-55N, 10-15E, roughly centered on Berlin)

Figure 1b, 50 year trend, same 5x5 degree grid

Table 1a shows the results of applying this process to 5x5 grids across a large part of Europe, with trends (all in deg C/decade) calculated for the interval 1910-2009.


The 2007 Assessment of Climate Change

The arithmetic average of all these 100 year trends is 0.09 degC/decade.


Table 1b shows the trends for the same grids with linear fits for the interval 1960-2009:

The 2007 Assessment of Climate Change

The average of all these 50 year trends is 0.28 degC/decade.  Red indicates greater than 0.35, yellow 0.3-0.35, green 0.25-0.3 and purple 0.2-0.25 degC/decade.


Figure 2 is a map showing the 5x5 grids color-coded according to their 50 year trends from Table 1b.


It is clear from this analysis that during the last 50 years, large parts of Europe warmed at 2-3 times the ‘average’ global rate.  This is at the high end of the 'land' warming rates shown in the bar graph above.  Some will say that this is a cherry-pick, but 50 years over an entire continent is one very large, long-lived cherry. 

We know that early 20th century warming, thought to be largely driven by increasing solar irradiance, was followed by a mid-century cooling episode thought to be due to increasing aerosols.  When we quote the hundred year linear trend, we are averaging all of those independent events together with the recent, more rapid CO2-driven warming.  We are understating the magnitude of what has actually taken place over the last 50 years. 

As we watch the snow fall this winter, it is time to stop softening our own message.  Begin with 'there is no evidence whatsoever for cooling.'  Continue by talking about what is actually happening: Large areas of the northern hemisphere are warming at twice the rate we've been quoting.

0 0

Printable Version  |  Link to this page

Comments

1  2  Next

Comments 1 to 50 out of 74:

  1. Excellent post, which I will read in more detail later. A little nit: "begging the question" (para 8) is a logical fallacy meaning to assume what you are trying to prove. It is the listener or reader who is bieng "begged". The phrase is now so often used in the sense of "inviting the question" that it is rarely queried. Begging the Question
    0 0
  2. I keep reminding people that if we don't recover soon from the current recession, we will soon be hit by the economic shock due to global warming, so that we will never recover. I can't tell if anyone is really getting the point, though.
    0 0
  3. Bit of an eye-opener that. I was aware of the Arctic warming extremely fast, but not the Northern Hemisphere as a whole.
    0 0
  4. A significant part of the rapid Northern Hemisphere warming is the high proportion of land ot ocean in the NH, mostly due to the Asian land mass. This accentuates the warming trend which is stronger towards the poles in any event, and even stronger in the arctic because of summer ice melt and albedo effects. Conversely, the relative lack of land in the Southern Hemisphere below 23.6 degrees south relative to the tropics hides the increased warming trend in southern regions. Unique circumstances in Antarctica also limit the warming trend, further weakeing the Southern Hemisphere trend so that it is approximately equal to that of the tropics. It would be interesting to see a graph of the NH, Tropics, and SH land only temperature anomalies by latitude; and also the equivalent ocean only anomalies, so that this distortion could be removed.
    0 0
  5. It would be interesting to see this globally, as a layer on google maps / earth. Good visualisation method.
    0 0
  6. great metodology and nice presentation with arguments. I had to register just to congrad.
    0 0
  7. Hey, nice post, muoncounter. (And thanks for the links to my older posts....)
    0 0
  8. So what. Tell us something we didn't know. Here is the part that makes me wonder. "We know that early 20th century warming, thought to be largely driven by increasing solar irradiance, was followed by a mid-century cooling episode thought to be due to increasing aerosols." Thought is long from proof. We are still fuzzy on drivers and their net effects historically and presently. Anyone who says they have that all figured out is full of hooey. By this you would almost think that solar irradiance had to increase to have a warm-up. Not true. In a semi closed system, like we are in, warming or cooling can occur with a relatively steady solar irradiance. About the only thing that is unlikely during fairly steady solar times is steady temps. This world just doesn't seem to like to stay the same temp for long.
    0 0
    Moderator Response: [Daniel Bailey] For someone studying climate science you demonstrate little command of the subject in your numerous postings here at Skeptical Science. Please be a positive resource to this discussion by providing links to peer-reviewed sources which support your position, rather than the dismissive handwaving which you do currently. Thanks!
  9. I can see three input boxes within the post, which cannot be clicked on or anything, and with greyed-out scroll bars. Is there meant to be anything in them, or is it just me and my computer/browser ? cruzn246, rather than constantly posting what you believe and don't believe, why not actually provide some data, evidence (whatever) so everyone can test the veracity of those beliefs ?
    0 0
  10. #8: "Tell us something we didn't know" Thanks, I take it from this remark that you are in agreement with faster than reported warming. You don't have to look far, even here on SkS, to find those who do not agree -- so 'something we didn't know' depends on what you mean by 'we'. "Thought is long from proof." Ah, that must be the sound of moving goalposts. If you have issues with either a solar cause for the early 20th century warming or the aerosol cause for mid-century cooling, see the relevant SkS posts. The rest of your last paragraph is a mass of confusion: for example, what's a 'semi-closed system'? Boil it down to the final 'world just doesn't seem to like to stay the same,' which is just another version of 'we don't know' or 'we can't know' or the usual ascientific tripe. Try harder next time. #9: JMurphy, input boxes? Don't see 'em here in Firefox.
    0 0
  11. Very interesting work. One note. Is no “real” correlation - causal association - between anthropogenic aerosols and NH temperature (it is coincidental) - Consistency of global satellite-derived aerosol and cloud data sets with recent brightening observations., Cermak et al., 2010.: “In a period from the mid-1980s to the mid-2000s, aerosol optical depth is found to have started declining in the early 1990s, while cloud data sets do not agree on trends.” Can aerosol decrease cloud lifetime?, Small et al., 2009.: “... (ii) the “lifetime effect” whereby anthropogenic aerosol suppresses precipitation and results in clouds with more liquid water, higher fractional cloudiness, and longer lifetimes. Based on new observations presented here, and supported by previous fine-scale modeling studies, we suggest that the balance of evidence shows that non-precipitating cumulus clouds can experience an evaporation-entrainment feedback, and respond to aerosol perturbations in a manner inconsistent with the traditional “lifetime effect.” It is rather a weakening of the AMOC. P.S. Newspaper in Germany, France and Britain have announced that this winter is the coldest since 327 years (in Poland at the moment is thaw ...)
    0 0
  12. "In a semi closed system, like we are in, warming or cooling can occur with a relatively steady solar irradiance." It appears that cruzn246 is unfamiliar with the basic principle of Conservation of Energy. If the amount of energy entering & leaving the system remains unchanged, then so will long-term temperature trends. However, change the amount of energy coming in-or going out-& you get a change in the long term trend. What is interesting, though, is how we continue to get a long term warming trend even though the amount of incoming energy has been dropping at an average of 0.02 Watts/meter squared over the last 30 years.
    0 0
  13. "P.S. Newspaper in Germany, France and Britain have announced that this winter is the coldest since 327 years (in Poland at the moment is thaw ...)" Factually incorrect again. Germany had its coldest *December* since 1969, the UK had its coldest December since 1979. Only France had truly *record* cold weather for December. I think you need to check your facts a little more carefully in the future. Of course, the next question is-what's your point? Since when does a single weather event constitute a trend? Was the record heat wave in Europe during the summer *proof* of global warming?
    0 0
  14. I always thought that Winter started on 21 Dec and finished on 20 Mar. Or that it is the months of Dec, Jan and Feb. How can anyone be calling this the "coldest since 327 years" when we are only about half through the current Winter ? Also, what exactly was the temperature in 1683 ?
    0 0
  15. In my mind this picture make the whole statement about the uneven temperature variation very clear.
    0 0
    Moderator Response: [Daniel Bailey] Nice chart, one of my fav's. Superbly illustrates polar amplification like no other. Thanks for sharing!
  16. @Marcus That perhaps we are at the beginning of a new trend. Perhaps the exceptionally severe winter is not only a "single weather - hot summers and a signal continentalization climate - cool. As a rule, such a unique individual events are an indicator of the coming changes.
    0 0
    Moderator Response: [Daniel Bailey] As others have pointed out already, you are speaking about weather. Climate change is about long-term variations. What may for some has been a severe winter thus far, for others has been exceptionally mild (with several months of variation yet to go). Highliting this current winter's "weather":
  17. @Arkadiusz Semczyszak Marcus has alrady responded to you, but just let me iterate: Here in Ireland we had record December snowfalls, & record low temperatures. January has been distinctly average -in fact where I live the outside temperature is 10C, and I can see grass growing already between the bricks inside my front gate! Much the same seems to be true for the UK & France. December saw a shift in the jet stream that brought Arctic air over Europe. This will no doubt be looked upon as a cold winter, but a "record"? Doubt it. If it was, why would that be significant? You should think about Marcus' comment about single weather events.
    0 0
  18. With regard to the UK figure for December, it is worth reading what the Met Office has to say : Provisional figures from the Met Office issued today reveal that December 2010 has become the coldest December across the UK since the national series began in 1910. The previous coldest December in the series was 0.1 °C, in 1981. The provisional UK, England and Wales figures for December 2010 show that the month was the coldest month since February 1986. In Scotland it was the coldest month since February 1947, and in Northern Ireland the coldest month on record. More here. It was abnormally cold weather for about a month but since then it has been very mild and approaching April temperatures.
    0 0
  19. The graph "Temperature Cahenge for three latitude bands" http://data.giss.nasa.gov/gistemp/graphs/Fig.B.pdf seems odd: 2010 is not record warm in any of the 3 latitude bands. However, it is record warm in Northern Hemisphere: http://data.giss.nasa.gov/gistemp/graphs/Fig.A3.pdf And tied with 2005 globally: http://data.giss.nasa.gov/gistemp/graphs/Fig.A2.pdf Isn't this a contradiction?
    0 0
  20. cruzn246: Anyone who says they have that all figured out is full of hooey. So if I've got this straight, your basic position seems to be: "Ignore all those scientists who've been studying these issues for their entire professional lives. Instead, listen to me, even though I present no credentials and no evidence, and routinely get basic facts wrong." Hmmm. I wonder who to believe?
    0 0
  21. I am in the middle of my regular evening consolidation of Zvon.org guide to RealClimate.org and discovered a very fitting conclusion of an article (Ocean heat content increases update): As usual, this is unlikely to be the very last word on the subject, but this is more evidence that the planet is basically behaving as the scientists think it is. And that isn’t necessarily good news.
    0 0
  22. "I always thought that Winter started on 21 Dec and finished on 20 Mar. Or that it is the months of Dec, Jan and Feb." For north america and eurasia, meteorological winter is Dec, Jan, Feb. 21 Dec marks the beginning of astronomical winter.
    0 0
  23. I like the color box graphic, as it makes very clear why denialists like to focus on UK temps as a proxy for the global record (you know, all these comments that claim that the UK historical record shows warming fears are exaggerated, etc). I pointed out recently somewhere that the UK is an island, so would be expected to show warming trends that are diminished (as is the trend for atmospheric temps over the oceans) compared to the interiors of North America and Eurasia, and was tsk-tsk'd for it by the denialist involved.
    0 0
  24. You know that the contrarians/'skeptics" etc. are getting incredibly desperate when they are having to focus on unusually cold weather on a monthly time scale, over an area that covers about 2% of the planet. Dhogaza @22, In meteorology and climate, regardless of where one lives in the N. Hemisphere, the boreal meteorological winter is officially DJF. So claims being made here and elsewhere that Europe, or even portions of Europe, are experiencing their coldest winter on record, or coldest winter in 327 years are simply ludicrous. Let has have a look at the data in March. But still, we should be looking at long-term trends in global SAT. as muoncounter has done in this excellent post.
    0 0
  25. #19: "graph "Temperature Cahenge for three latitude bands" seems odd: 2010 is not record warm" This version of the graph does not appear to the have 2010 data point posted as of yet.
    0 0
  26. I also quite like this image, from NASA GISTEMP: Zonal mean SAT anomalies by month.
    0 0
  27. Another GISSTemp shot: 1960-2010 annual trends. -- click for full scale Medium orange = 1.5 degrees in 50 years or 0.3deg/decade
    0 0
    Moderator Response: [Daniel Bailey] Link's bad. Fixed.
  28. Someone must know: Wasn’t there a paper this year that just counted new research papers to see how often the new research indicated that the problem is not quite as bad as previously thought, vs the opposite? I would appreciate a reference to this please.
    0 0
  29. "Large areas of the northern hemisphere are warming at twice the rate we've been quoting." If that's not scary enough have a read: Earth's Hot Past: Prologue to Future Climate? "The study also indicates that the planet's climate system, over long periods of times, may be at least twice as sensitive to carbon dioxide as currently projected by computer models, which have generally focused on shorter-term warming trends." In this week's journal Science "Perspectives" article.
    0 0
  30. Obviously the post I was responding to got deleted.
    0 0
    Moderator Response: (Daniel Bailey) Sorry, Ron; hacking this out on my phone; refresh is like watching paint dry...
  31. Arkadiusz Semczyszak wrote : "Newspaper in Germany, France and Britain have announced that this winter is the coldest since 327 years." Are you actually going to present any links to these claims ? While you gather them for posting, I have been doing a little search for myself and all I could come up with for the UK were the following : The savage "mini ice age" freeze has brought an average December temperature of -2.3°C - the worst since records began north of the border in 1910. But, by using official English stats dating back to the 1600s as a guide, it's shaping up to be our coldest winter in 327 years. During 1683 the River Thames was reported to be frozen under 11in of ice. Last night Net-weather's Ian Michaelwhite branded this winter "a mini ice age". The Met Office's Charlie Powell said: "It's rare to have low temperatures so prolonged." The Scottish Sun (!) Let's not quibble too much but the Met Office say the actual figure is -1.9C. But perhaps we should quibble about using CET temperatures (for Central England, of course) to determine anything about Scottish temperatures ? And the 1683 temperature I asked about earlier, seems to be based on the coldest Winter on record - in Central England - using reports of a frozen Thames. As for the "mini ice-age"... Perhaps you read the report from THE DAIL MAIL : Brace yourselves for a 'mini ice age': This winter set to be coldest in 300 YEARS Forecaster Ian Michael Waite said: ‘We expect January to be colder than average – there’s no way we’re moving out of this mini ice age any time soon.’ Whoever that Ian Michael Waite is (couldn't find anything about him from his supposed home on NetWeather) but he seems to have provided the all-important quote that the so-called skeptics and deniers can latch on to. But has he spoken too soon ? Even if he has, the so-called skeptics have their quote and they will be using it as long as they can get away with it ! In fact, the above report was so good (for so-called skepticism) that Nigel Lawson's GWPF used it in toto. (Don't worry, all the links [except the NetWeather & Met Office ones] contain "no follow" values, so I hope they work as they should do) Also, with regard to the Input Boxes I was seeing earlier, they don't appear in Google Chrome, so maybe it was Internet Explorer only...or my computer, somehow !
    0 0
  32. #30 Kids and their toys!
    0 0
  33. JMurphy, The "skeptic" rumor mill and misinformation machine seems to be working full tilt. I cannot believe, simply cannot believe that claims like this are being made: "Brace yourselves for a 'mini ice age': This winter set to be coldest in 300 YEARS" This is definitely something for the CSRRT. But the request has to come from an organization or reporter. Any takers?
    0 0
  34. #33: "rumor mill and misinformation machine" Yeah, funny how they think talking about the weather during the summer is cherry picking; but in winter, they seem to pick up every Local on the 8s. Risking John's ire, I will note one weatherman who seems to have his head on straight: Cold? This isn't cold. Forty below is cold. But we're a long way from the record-cold days our parents and grandparents experienced. Thursday was the 99th anniversary of the day in 1912 when thermometers in Oakland, out in Garrett County, registered 40 degrees below zero. That was, and still is, the record-cold reading for the state. This is by no means an invitation to play dueling weather reports here.
    0 0
  35. "In meteorology and climate, regardless of where one lives in the N. Hemisphere, the boreal meteorological winter is officially DJF." So claims being made here and elsewhere that Europe, or even portions of Europe, are experiencing their coldest winter on record, or coldest winter in 327 years are simply ludicrous." Wikipedia only says "most locations in the Northern Hemisphere". I said NA and Eurasia because I know it to be true for those two continents, and of course all the screaming of record cold centers around the eastern US and northern Europe. "So claims being made here and elsewhere that Europe, or even portions of Europe, are experiencing their coldest winter on record, or coldest winter in 327 years are simply ludicrous." Certainly true, such claims are bull, and I'm well aware that we're only about 1/2 way through meteorological winter. And where I live in NA, it's not been a cold winter at all.
    0 0
  36. Dhogaza @35, We are in agreement, on all fronts :) Just a small comms breakdown. I am surprised that the Wikipedia article says "most locations". As far as I know, all the major climate centres around the world (NOAA/NCDC, Hadley etc.) consider DJF to be the boreal winter.
    0 0
  37. Albatross, I was surprised they said "most", too. I looked to see if it was safe to say "northern hemisphere meteorological winter", saw that bit in wikipedia, and qualified my statement as a result. From others: "Forecaster Ian Michael Waite said: ‘We expect January to be colder than average – there’s no way we’re moving out of this mini ice age any time soon.’ Whoever that Ian Michael Waite is (couldn't find anything about him from his supposed home on NetWeather) but he seems to have provided the all-important quote that the so-called skeptics and deniers can latch on to. But has he spoken too soon ?" London certainly isn't experiencing a continued "mini-ice age" this first half of January, unless "more or less normal temps" qualifies.
    0 0
  38. This image is global, not NH, but it's my personal favorite for conveying the warming seen in the past century, by year and month, with the most dramatic change starting around 1980. In that period you can easily see the trend for greater warming in the winter and spring, Pinatubo, El Ninos, and more. It's also annotated for volcanic eruptions, solar minima and maxima, El Ninos and La Ninas (click the link to get to the larger image to see the annotations clearly, or go to the gistemp page itself). It's a slight modification of the GISS image from http://data.giss.nasa.gov/gistemp/graphs/Tvs.year+month.lrg.gif at http://data.giss.nasa.gov/gistemp/graphs/ (near the bottom of the page). [I just spliced the three separate segments together, and rotated it to fit neatly in a narrow column.] Click this link or the image to see a larger copy. Monthly Mean Global Land-Ocean Temperature Index
    0 0
  39. I realize now that I should have mirrored the graph horizontally... right now, the months read right to left (i.e. January is on the right, December on the left).
    0 0
  40. Sphaerica @ 38 - That really is a great graphic, Gareth Renowden over at Hot-Topic highlighted it a while back. Says it all doesn't it?.
    0 0
  41. Tom Yulsman pioneered it here. It's just a step to the left right... The Yooper
    0 0
  42. DKoD was on this 2 years ago, with some nice displays showing NH warming.
    0 0
  43. Sphaerica and Daniel, That is an awesome graph, much better than mine @26. I see that it has a problem though-- they are soon going to have to change the colour shading because the warm end of the spectrum is becoming saturated.
    0 0
    Moderator Response: [Daniel Bailey] They can always paint it black...
  44. Further insight can be gained from viewing the temperature trends by latitude bands, here both monthly anomalies for the land and sea Surface Air Temperature (Upper image, CRUTEM3+ HadSST2 plus five year trends) and Sea Surface Temperature (Lower image, NCDC ERSST V3b) have been charted for 15 degree bands from the equator to Arctic (each band anomaly is offset for clarity). Note long term SST trends are highest at the equator but SAT trends are highest at the pole. Though there are natural limits (in Polar regions there is a SST lower limit of freezing point of sea water in winter whilst SAT above any permanent ice is limited to melting point of ice in Summer) these observations are generally consistent with results from models where there is an overall net global energy imbalance with most of the excess heat energy being stored in the Ocean, and most of the additional input occurring in the tropical regions, with enhanced NH heat transport due to western boundary currents/NH land mass distribution and resultant enhanced NH Ocean/atmosphere heat exchange, as well as Arctic amplification (due to diminishing Arctic sea ice in Summer and albedo changes).
    0 0
  45. #44: Peter, Thanks, those are beautiful graphs. "enhanced NH Ocean/atmosphere heat exchange, as well as Arctic amplification" If the NH heat flow cycle is dependent on tropical heat moving north in the oceans and Arctic waters are growing steadily warmer, does this result in amplification effectively spreading into the lower latitudes? It would be interesting to know if anyone has modeled that effect.
    0 0
  46. New 2005: Arctic climate change with a 2 degC global warming The geography of the Arctic (land-sea distribution) and snow/ice albedo feedbacks, along with minor changes in cloud and ocean heat transport, lead to an amplified regional warming over the Arctic that ranges from between 3.2 and 6.6 degC for a global change of +2 degC. ... The Arctic temperature change amplification means that these rates of warming are likely to be between 0.45 deg to 0.75 degC/decade, and possibly even as large as 1.55 degC/decade. I suppose the good news is that with these rates, we won't have long to wait.
    0 0
  47. Daniel: Many thanks for crediting that graphic to me at CEJournal. Through the use of color, that modification of the NASA GISTEMP graphic dramatically conveys what's happening, at least to me.
    0 0
    Moderator Response: [Daniel Bailey] Thanks for sharing it. I've used it to great effect with several denying friends and relatives. The visual impact is staggering, once they realize what they're looking at.
  48. #38 Sphaerica "In that period you can easily see the trend for greater warming in the winter and spring" From the image you include the same phenomenon seems to be true for the ETCW period (1930s and 1940s). The stronger anomolies seem to be clustering towards the edge of the image. Yet the ETCW period is meant to be a product of solar forcing while the recent is meant to be GHG. Isn't this observation meant to be a fingerprint of GHGs?
    0 0
    Moderator Response: [muoncounter] As you well know, there's a thread for human fingerprints in the seasons.
  49. I have a question, (well actual several but let's start with this one) but please let me explain first: looking at the first graph with the temperature change per latitude band, I notice that clearly (for the NH) temperatures dropped between 1900-1910/1920 then increased until ~1940, decreased until ~1970 and have since then increased with a possible leveling off since 2000. Having a financial and trader background and a very successful long track record, I am more than tuned to recognizing patterns to predict what stock prices will do. Assuming these temperature anomalies as stock prices the general (linear) trend from 1900 to 2010 is obviously increasing. However, as I mentioned; there are clear trend-breaking moments which mean that there is no linear increase from 1900 to 2010, and any linear trend line through this data set is an error. In fact, not until ~1970 has the increase been consistent (regardless of what reason). That said, prior to ~1970 NH temperature anomalies varied between -0.6 and +0.4 (extremes), with the red line (SMA ?) between -0.35 and +0.2. Either way, from a stock-background perspective it means that there is a support at the -0.6 level and resistance at the +0.4 level, meaning that if temperatures were to drop then not until they drop below +0.4 a new negative (cooling) trend has been established, which would really set new records if it also dropped below -0.6. The same goes for when temperatures broke through the +0.4 level, which was not until the late 80ies, establishing a clear significant upward trend and clearly establishing new highs. Hence, seeing it from that perspective, I must say that temperature anomalies have only started to increased above their "long-term range" since the late 1980s and not the 1970s. If this were stock prices, I wouldn't buy the stock until it broke through that resistance level (say somewhere between +0.2 and +0.4), since it otherwise would mean it traded in between it's normal band with no real gain to make. Clearly of course this is not the case anymore. I know this is not a stock, but it provides a different way at looking at patterns. So my question is; has this been done before? Have scientists looked at this using stock/trading indicators to predict what global surface temperatures will do in the future? I'd suggest calculating EMAs, Momentum, MACDs etc and interpret this accordingly. Finally, looking at the last ten years, the temperature anomaly has fluctuated between ~0.7 and ~1.0, which is called a band, and to me it means that only when the temperature breaks through the 1.0 the warming continuing. Your thoughts? Also, how does this relate to the monoloa CO2 data set, which shows a clear steady increase in CO2 levels since 1958 but I don't see that pattern in the temperature anomalies, which didn't actually increase above their prior band until the 1908s. I'd appreciate any feed back
    0 0
  50. #49: "Assuming these temperature anomalies as stock prices" I think that's not a particularly valid assumption. Technical market analysis relies on the fact that people are looking for patterns in stock charts; once they see those patterns, they react by buying or selling, which in turn drives the price. That mechanism simply doesn't exist in nature, which is driven by fundamental physics. So while such analysis may provide a descriptive tool for the shape of curves, its not physics. Two points as far as Mauna Loa's CO2 record is concerned: 1. the rate of change in CO2 correlates well with temperature anomalies; see this discussion. 2. there is a significant time lag before the full warming effect of new CO2 is felt, so it is not valid to look at last year's delta CO2 and expect this years delta temperature to match; see this prior thread.
    0 0

1  2  Next

You need to be logged in to post a comment. Login via the left margin or if you're new, register here.


The Consensus Project Website

THE ESCALATOR

(free to republish)


© Copyright 2024 John Cook
Home | Translations | About Us | Privacy | Contact Us