Climate Science Glossary

Term Lookup

Enter a term in the search box to find its definition.

Settings

Use the controls in the far right panel to increase or decrease the number of terms automatically displayed (or to completely turn that feature off).

Term Lookup

Settings


All IPCC definitions taken from Climate Change 2007: The Physical Science Basis. Working Group I Contribution to the Fourth Assessment Report of the Intergovernmental Panel on Climate Change, Annex I, Glossary, pp. 941-954. Cambridge University Press.

Home Arguments Software Resources Comments The Consensus Project Translations About Support

Bluesky Facebook LinkedIn Mastodon MeWe

Twitter YouTube RSS Posts RSS Comments Email Subscribe


Climate's changed before
It's the sun
It's not bad
There is no consensus
It's cooling
Models are unreliable
Temp record is unreliable
Animals and plants can adapt
It hasn't warmed since 1998
Antarctica is gaining ice
View All Arguments...


Username
Password
New? Register here
Forgot your password?

Latest Posts

Archives

Twice as much Canada, same warming climate

Posted on 23 November 2010 by Ned

Guest post by Ned

Canada is the world's second-largest country, so obviously Canadian weather stations will be important in any global surface temperature reconstruction based on station data. Yet as many observers have noted, the number of Canadian weather stations included in the Global Historical Climatology Network (GHCN) database has declined since the early 1990s.

Is this decline significant?

An answer to this question has been provided by the Clear Climate Code (CCC) team. The CCC project is an independent effort to replicate NASA's global temperature reconstruction using open-source software, with all code rewritten to emphasize clarity. Having successfully duplicated the results of the official NASA GISS temperature reconstruction, CCC is now able to perform new experiments using different data or alternative processing methods.

In a particularly nifty example of what can now be done, CCC recalculated the global temperature dataset using additional data obtained directly from the Environment Canada (EC) website. This new analysis includes many stations that are not listed in the GHCN database. While there still aren't as many stations reporting as there were back in the 1960s, the new data from EC more than doubles the number of Canadian stations available after 1990.

The result? Virtually no detectable change in the observed warming trend. Figure 1, from a new post at CCC, shows the surface reconstruction for the Arctic region (64 to 90 N), before and after the addition of the new data:


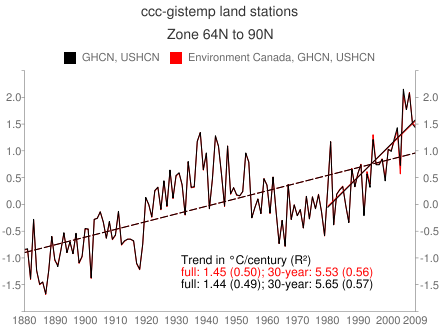
Figure 1. Surface temperature reconstruction for the Arctic, showing similarity between results with only GHCN stations (black) and with the inclusion of additional stations (red). Courtesy Clear Climate Code.

Note first the close match between the two lines -- it's almost impossible to distinguish the red line (with twice as many stations) from the black line (the original analysis using only those stations included in GHCN).

Is this result surprising? Not really. As discussed elsewhere on this site (e.g., here) previous claims of problems with global temperature reconstructions have been shown to be mistaken. Satellite measurements of atmospheric temperature and sea surface temperature all show the Earth is warming, as do analyses of weather station data by both "official" climate monitoring groups and "independent" citizen-science efforts such as CCC.

One last point from this CCC analysis of temperatures: it's also worth noting the magnitude of recent Arctic warming. The slope of the 30-year trend in this region is 5 to 6 C/century -- a rate of warming that's much higher than the rest of the world. Given the magnitude of this Arctic amplification, it's not surprising that sea ice is declining and Greenland is losing ice.

Acknowledgments: Thanks to Clear Climate Code for both the specific work discussed in this post, and for the longer-term project of providing an independent set of tools for global climate science.

0 0

Printable Version  |  Link to this page

Comments

1  2  Next

Comments 1 to 50 out of 78:

  1. Ned, I would like to say I was just about to post in the forum on this subject and opened the page and there it was haha. Yeah it's really interesting and i've looked at some of this sort of stuff in the FAR past but what I find most prominent is that the rates of warming between the two warm periods are significantly different. It really supports the conclusions identified by glaciologists about how quick ice cap and glacier recession have been in the Canadian Arctic. Great on clear climate code to have recognized this. I imagine this won't be in the newspapers back home though...
    0 0
  2. "slope of the 30-year trend in this region is 5 to 6 C/century" So that's where all the 'missing heat' has gone! Ned, you've done it again.
    0 0
  3. There is a slight disconnect in the CCC work. The station number graph is for the whole of Canada while the temp record is for just Arctic Canada. I see the whole Canada station number has doubled but there is no mention in the station number change for the Arctic.
    0 0
  4. muoncounter writes: So that's where all the 'missing heat' has gone! Ned, you've done it again. Heh. Not me! I'm just publicizing some work by CCC that I thought SkS-ers would find interesting. HumanityRules writes: I see the whole Canada station number has doubled but there is no mention in the station number change for the Arctic. Yes, that's true. At the CCC site they have links to the data and the Python code. It would be interesting to see maps of the two distributions of stations.
    0 0
  5. Also -- Thanks, Robert. Part of my haste in posting this was that I knew that you, or someone else, would beat me to it if I delayed! :-) As for rates of warming, the current 30-year trend is obviously much steeper than the century-scale trend. But you could probably cherry-pick a 30-year period during the 1920s-1940s with a slope almost as steep as this one ... maybe. I know some people will seize on the idea that this somehow casts doubt on the anthropogenic origins of the current warming, but hopefully most people here will see the logical fallacy in that line of reasoning.
    0 0
  6. "The slope of the 30-year trend" Here are some graphs from the Environment Canada data. One in particular: Looks like 2.25 degrees in 45 years or 0.5C per decade. Oh the cherry-picking, that's just winter temperature. It must be the summers that are cooling!
    0 0
  7. Not to be outdone, the Washington State Climatologist has a very slick temperature trend visualization tool covering Wash, Oregon, Idaho and a little BC. Not to mention, they have a State Climatologist! Similar in 30-50 year trends to Canada, although you'd have to convert deg F/decade to deg C/decade. And they have a State Climatologist!
    0 0
  8. muoncounter: UHI was NOT taken into account in the graphs, so the projection is right on par without adjustments.
    0 0
    Moderator Response: [Daniel Bailey] Tamino also looked at UHI recently in his post Urban Wet Island? If you still have questions on UHI, please post them on one of the threads muoncounter has kindly provided. Thanks!
  9. #8: "UHI was NOT taken into account in the graphs" Trends. If UHI wasn't taken into account, it still gets subtracted out when you look at trends. Once an area becomes urban, it can't get any more urban. And where's the UHI at a place like Libby, Montana (population 2880), with a summer min temperature increase of 0.85F (0.47C)/decade since 1958? See here and here for prior discussion and comment there if you like.
    0 0
  10. Thanks for the post and the links Ned. Readers may be interested in the map I made of the Environment Canada stations (using ScraperWiki). It's a bit slow to load, and you need to scroll North to see all the stations.
    0 0
  11. 5.Ned HumanityRules writes: I see the whole Canada station number has doubled but there is no mention in the station number change for the Arctic. Ned writes: Yes, that's true. If that's the case then your title is a little mis-leading. The doubling of Canadian sites and the result in Fig1 are two unrelated facts. (Just to clarify drj over at the CCC website has pointed out that Fig1 isn't even arctic Canada but "the entire Arctic zone")
    0 0
  12. Thank you, drj! Your blog and your work on Clear Climate Code have made an incredibly valuable contribution to people's confidence in the results of global surface temperature reconstructions.
    0 0
  13. HumanityRules writes: If that's the case then your title is a little mis-leading. The doubling of Canadian sites and the result in Fig1 are two unrelated facts. I think you're missing the point. Nobody (outside Canada) is particularly interested in a new reconstruction of Canada-only temperatures. The implied claim that people make is that the decline in the number of Canadian weather stations in GHCN is distorting temperature reconstructions like GISSTEMP or HADCRU or what have you. The region where this effect would be expected to be most extreme would be in the high latitude northern hemisphere (i.e., the Arctic). If there were any region where doubling the number of Canadian weather stations would show any effect, it would be this region. The fact that there's essentially no detectable change in Arctic temperature trends tells us that the original claim (missing Canadian weather stations are biasing GISSTEMP) is clearly mistaken.
    0 0
  14. The decline of the number of station argument is wrong per se. If the remaining stations (although gridded) are not representative of the temperature of Canada, they could be wrong either side; no one could tell if the bias would be on the high or low side before actually check the numbers. I'm sure scientists are clever enough to know and check before publishing the data. Thank you Ned for sharing these results for future reference.
    0 0
  15. Ned, I guess it should be pointed out that the warming shown is for the Arctic from 64 N to 90 N rather than for Arctic Canada. I saw on another blog that Nick Barnes posted a note about how it wasn't just Canada.
    0 0
  16. Here is the relevant comment where Nick points this out... http://clearscience.wordpress.com/2010/11/22/just-a-small-note/#comment-36
    0 0
  17. Thanks, Riccardo. Robert, thanks for the link, though I'd point people towards the actual Clear Climate Code blog rather than ClearScience. I would just reiterate this comment. The point of this post is to address the claim that commonly cited temperature reconstructions are biased due to missing stations in Canada. Clear Climate Code replicates one of the most widely used of those reconstructions (GISSTEMP). As shown at CCC and as discussed in this post, doubling the number of Canadian stations has no effect on the GISSTEMP product (high latitude northern hemisphere land temperatures) that would be most strongly affected by changes in the number of Canadian stations.
    0 0
  18. I think HR's point is that theoretically Canadian stations could have doubled in the CCC dataset, but there might only be only say one additional station in the Arctic region represented by the graph above... thus making the close correlation a result of almost no change in the data and the whole 'doubling' bit a red herring to mislead people. Remember... it's ALL a conspiracy. Is it sad that I'm starting to understand how they think? I'm vaguely worried. Any way to find out the extent of station increase for the region covered by the temp anomaly graph?
    0 0
  19. For those interested I managed to track down Environment Canada's "Climate Trends and Variations Bulletin" here. They state that: "...the 2000s was the warmest decade out of the six that are available for this national study, 1.1°C above normal. The rankings of the remaining decades, in order from warmest to coolest are: 1990s (0.7°C above normal); 1980s (0.4°C above normal); 1950s (0.1°C above normal); 1960s (0.0°C of normal); and 1970s (0.2°C below normal)." One critique is the trend in annual temperatures that they provide for the 1948-2009 period-- they sate that is +1.4 C. OK, but convention is to say per year or per decade.
    0 0
  20. Ned say: "The point of this post is to address the claim that commonly cited temperature reconstructions are biased due to missing stations in Canada." Given the rebuttal here the skeptic claim would have to be that missing Canada stations over it's whole land mass was affecting the GISSTEMP "whole arctic" trend. It seems like a curious claim. Maybe it would be clearer if you could provide the skeptic analysis that was making this claim.
    0 0
  21. 18.CBDunkerson You'll have to remind me because I can't remember the flavour of your past comments, are you a sarcastic skeptic or a dismissive alarmist?
    0 0
  22. HR, I'm a sarcastic skeptic. Which, translates into 'skeptic' as 'dismissive alarmist'.
    0 0
  23. 22.CBDunkerson erm....that's cleared things up.
    0 0
  24. Ned, I didn't notice that the author's had responded there also. Thanks for the heads up. Sorry for the misdirection.
    0 0
  25. @HumanityRules: rather than imply that the data is inaccurate, why don't you find out for yourself? Find how much more Arctic stations are added by including the Environment Canada figures, or compare other areas than the Arctic. The data is available for you to prove the author wrong.
    0 0
  26. Living in northern Canada all I can say is thank goodness its warming.33 below Celsius this morning with a wind chill of 44 below brrrrrr. That is dangerous cold. Will kill you real quick if your not dressed for it.Has anyone seen the peer reviewed study that seems to indicate that cold weather is way more life threatening than warm weather!
    0 0
  27. Goodness, adrian smits : such cold temperatures in Northern Canada in November ! Who would have thought it ? Anyone would think that Winter was coming. Never mind - weather often surprises some.
    0 0
  28. FYI: Anyone wondering about the GHCN station dropout issue and if that dropout adversely affected the accuracy and outcome of the temperature products based on it: Tamino already has done that (analyzed the station drop-out from the GHCN datasets) work for you here. The result (drumroll please, Maestro)? Dropping out of some stations introduced a slight cooling bias into the resulting temperature trend (Cha-Ching!). For a pleasant read and a ton of easy-to-digest analysis, go here wherein Tamino shares his personal analysis into, well, just about every climate-related dataset you could thing of. The Yooper
    0 0
  29. The "station drop off" that affected Canada was clearly shown in Peterson & Vose, 1997. While this paper shows the extent of the drop off it does not explain why it occurred. Last month I visited NOAA in Asheville. One of the questions I asked related to the decline in the number of stations at high latitudes. A major factor was organizational changes at Enviro Canada. I was assured that things have settled down and the number of Canadian stations reported in the GHCN is likely to rise again.
    0 0
  30. Re adrian smits (26)
    "Has anyone seen the peer reviewed study that seems to indicate that cold weather is way more life threatening than warm weather! "
    Ok, I'll bite (well, I do have an enquiring mind): What is this 'peer reviewed study' of which thou dost speaketh? Verily, dost thee haveth a link? Out with it man, forthwith! The Yooper
    0 0
  31. Christidis, N., Donaldson, G.C. and Stott, P.A. 2010. Causes for the recent changes in cold- and heat-related mortality in England and Wales. Climatic Change 102: 539-553.I got this at co2 science.
    0 0
  32. Re: adrian smits (32) Um, Adrian, you may want to take a closer read on that article (PDF here), wherein they say:
    "Adaptation measures have prevented a significant increase in heat-related mortality and considerably enhanced a significant decrease in cold-related mortality. The analysis also suggests that in the absence of any adaptive processes, the human influence on climate would have been the main contributor to both increases in heat-related mortality and decreases in cold-related mortality."
    and
    "With regard to heat-related mortality, projected future increases in the frequency and intensity of heat waves may exert a stress beyond the adaptive limits of the population."
    Seems to be another sign of a warming world: cold-related deaths decreasing and heat-related deaths flat, but that human adaptation to temperature changes currently accounts for the observed reduction in cold-related deaths and the lack of observed increase of heat-related deaths. It also signals a warning that expected increases in heat wave intensity and frequency may be too much to adapt to. Interesting report; says a lot. But nowhere in it does it say that cold kills more people than heat. [Edit: On p. 543 (Fig 1) of the study are a bunch of graphs. Cursory inspection of the graphs make it seem that cold waves kill more people than heat waves, but the graphs themselves are based on rates and say nothing of the lengths of time spent in each type of wave or the total mortalities of either. In short: the graphs are not to be used to determine if cold waves actually kill more people in England and Wales than heat waves do. Cold waves may actually kill more people than heat waves do, but determining that was not the purpose of this study. End edit] The Yooper
    0 0
  33. Why the censorship?
    0 0
    Moderator Response: [Daniel Bailey} You ended your comment with a political/ideological conspiracy theory statement. If you wish to resubmit your comment without the offending phrase/paragraph, please do so. However, you may first wish to read the comment at 28 above. Please keep the Comments Policy in mind and everything will be hunky-dory. Thanks!
  34. Daniel Bailey (#32), You don't need peer review papers to tell you that a colder climate is more dangerous than a warmer one. All you need is common sense. 20,000 years ago the temperature was just a few degrees lower than today with the result that the Laurentide glaciation reached down to where New York city is today.
    0 0
  35. Is that so gallopingcamel? From my experience, I've found that as it gets too cold, I simply wrap myself in more layers of clothing, & I know longer have a problem. When it gets too hot, though, there is a severe limit on what I can do to mitigate it. Sure you can get completely naked but, if you're still too hot, what then? Also, based on my knowledge of First Aid-& Human Physiology studies at Uni-my recollection is that the number of degrees C, below room temperature, that the human body can withstand without detrimental effects is much greater than the number of degrees C *above* room temperature. So no it isn't as "common sense" as you claim. As to what conditions were like 20,000 years ago, how is that even relevant to the conversation? Back then the planet was also further from the sun, & it will probably be many more millenia before it gets that far away again (probably another 10,000 to 20,000 years). Are you, then, suggesting that we should warm the planet so as to avoid a *highly* unlikely ice age?
    0 0
  36. Re: gallopingcamel (34) To tag onto Marcus' comment at 35, common sense tells you that people try to adapt to change; my point was that, while you could use the referenced study to say that cold kills more people than heat, that that's not why the study was done. Did you even read the study? I did, 3 times. Which is why I had to edit my comment to avoid...having to make comments like this one. Welcome back, by the way. Also, Google climate change+maximum wet bulb temperatures. Interesting report out there (2010). Aw, heck, here it is. The Yooper
    0 0
  37. #34: "a colder climate is more dangerous than a warmer one. " Spoken from one point of view. Here's another: European heatwave caused 35,000 deaths European heat wave have doubled
    0 0
  38. GC, Please read the first sentence of this NOAA article. Also, please look at this graphic
    0 0
  39. More on the differences between deaths from cold and heat : The number of extra deaths occurring in England and Wales last winter fell despite the coldest weather for 14 years. As Marcus stated, it has always seemed intuitive to me that heat is generally more dangerous than cold, not only because of the difficulty in being able to cool the body down but also because of the added diseases (malaria, etc.) that come with warmer weather. Also, many of the world's major, developed-world population centres seem to be nearer to the poles than to the equator, and most Scandinavian countries seem to be able to combine first-rate economic and social indices along with the cold, snow and ice.
    0 0
  40. During the 1970's we had some fairly serious famines around the world. Milions of people starved to death.It also happened to be the coldest decade in the last 80 or 90 years.I was a farmer back then and remember reading stories about crop failures across the northern hemisphere.Both drought and cold weather where taking there tole.I am only to happy in fact praying that the little bit of extra co2 we are putting into our atmosphere will prevent another decade like that one,although I doubt we can make that much of a differece
    0 0
  41. Adrian @40, I think it wishful thinking to hope that adding CO2 to the atmosphere will alleviate droughts. Please watch this: Source here. OK, so you say that is just a projection. But observations show that the area affected by droughts has been increasing. Anyhow, what has this got to do with the fact that the high latitudes are warming rapidly, and with the fact that the station drop out over Canada, if anything, underestimates the degree of warming?
    0 0
  42. Re: adrian smits (40) Sir, not to downplay your personal experiences nor the death of perhaps millions to various causes, but there is much in your comment that is in error. I won't delve deeply into any of them so as to not go too far off-topic, but briefly: 1. The 70's were not the coldest decade in the past 80 or 90 years. Not even close: Temperatures over a period of time are tracked via anomalies (to reduce the noise in the data to natural variability and to see the signal, if any, emerging from the background). We've experienced a 0.8 degree C rise over the past century. We're committed to about another 1.4 degree C additional rise (short term) no matter if we cut CO2 emissions to zero (which ain't happening anyway). Long term feedbacks maybe an additional 2+ degrees C beyond that (after we're both dead, so who cares exactly how much). Here's a nice graphic shows both temperatures and CO2 (in case anomalies are too funky). 2. CO2 is the most important greenhouse gas because it is the control knob for the worlds' thermostat. 3. We know it's coming from us. 4. It'll do more harm than good. The Yooper
    0 0
  43. yooper I'm not talking about the adjusted data. Just the raw please.Then you will see the 70s where very cold and there was a lot of famine.Historical fact by the way.
    0 0
  44. #43: "a lot of famine. Historical fact" Here is a database of sorts of global famines. Take your pick as to which decade was worse. As far as the 70s colder than the teens? Every climate data says not!
    0 0
  45. There were also drought-related famines across the bulk of Africa during much of the 1980's & 1990's Adrian-so what's your point? Global Warming is expected to accelerate Hydrologic Cycles-which essentially means more severe droughts & more severe flooding-neither of which spells a bright future for expanding agriculture. I also wouldn't pin much hope on the unlocking of Northern Tundra to make up for significant losses of prime agricultural land closer to the equator. Most of the Tundra regions lack sufficient soil nutrients & also don't get enough sunlight to grow the crops needed to feed 6 billion people. This suggests that future famines will make anything from the 1970's-or the 1980's-look like a walk in the park!
    0 0
  46. Muoncounter is right, Adrian. The temperature anomolies are based off the average temperatures for 1969-1990 (which includes the 1970's, obviously). Most of the 1970's were no more than -1 degree C below this average, whereas its clear that the bulk of the 1900-1930 period was closer to -1 to -2 degrees C below this average.
    0 0
  47. Adrian, Please direct us to the official data source which leads to believe that "Then you will see the 70s where very cold and there was a lot of famine." Please also provide sources to support your claim that "there was "a lot of famine" in the seventies. I found this list, and it doesn't support your claim. And agin I fail to see what any of this has to do with "Twice as much Canada, same warming climate"
    0 0
  48. adrian smits wrote : "yooper I'm not talking about the adjusted data. Just the raw please.Then you will see the 70s where very cold and there was a lot of famine.Historical fact by the way." Just in case Daniel Bailey is busy, I believe you will find raw data here. Can you use it to prove your assertion about the "very cold" 70s ? Also, as Albatross mentions, WIKIPEDIA shows that the only large famine I can see in the 70s was in Bangladesh - ranked 21 out of 22. Could you provide links to the "historical fact" you mentioned ? Generally, will you actually reply or will you divert onto something else ? I wonder...
    0 0
  49. Re: JMurphy (48) Thank you! I was having dinner with the family and then undertook the pre-Thanksgiving preparations for the big feast tomorrow. BTW, someone by the name adrian smits has been commenting on other sites (RC was one, IIRC). Same MO, starts off slow, gives the idea he is just misunderstanding things, then pulls you in. The "adjusted data/raw data" bit is the dead givaway. The Yooper
    0 0
  50. Re: adrian smits (43) Since Albatross and JMurphy have ably dealt with the majority of your comment, let me then say this: it is a matter of historical fact that I remember the specific part of the 70's that was so horribly cold that you refer to. The part called winter. ;) OK, enough of the fun stuff. Serious time. Do you have anything you'd wish to discuss on the topic of this thread? You do? Good! Tell us, what is your concern and what led you to think other than what the post shows? What was that source? If your concern was not in line with this thread, but about some other area of climate science, please use the search function in the upper left of every page to search for a more appropriate thread to submit your concern. Thank you for flying Skeptical Science Airlines, where we live to help educate the public on climate science related matters. Please make sure your tray tables are in the upright and locked position before deplaning. Have a great day! The Yooper
    0 0

1  2  Next

You need to be logged in to post a comment. Login via the left margin or if you're new, register here.


The Consensus Project Website

THE ESCALATOR

(free to republish)


© Copyright 2024 John Cook
Home | Translations | About Us | Privacy | Contact Us