Climate Science Glossary

Term Lookup

Enter a term in the search box to find its definition.

Settings

Use the controls in the far right panel to increase or decrease the number of terms automatically displayed (or to completely turn that feature off).

Term Lookup

Settings


All IPCC definitions taken from Climate Change 2007: The Physical Science Basis. Working Group I Contribution to the Fourth Assessment Report of the Intergovernmental Panel on Climate Change, Annex I, Glossary, pp. 941-954. Cambridge University Press.

Home Arguments Software Resources Comments The Consensus Project Translations About Support

Bluesky Facebook LinkedIn Mastodon MeWe

Twitter YouTube RSS Posts RSS Comments Email Subscribe


Climate's changed before
It's the sun
It's not bad
There is no consensus
It's cooling
Models are unreliable
Temp record is unreliable
Animals and plants can adapt
It hasn't warmed since 1998
Antarctica is gaining ice
View All Arguments...


Username
Password
New? Register here
Forgot your password?

Latest Posts

Archives

New temperature record for the Arctic in 2011

Posted on 27 January 2012 by Neven

NOTE: Reposted from Neven's blog post of the same name, via ClimateProgress from the WWF Climate Blog, this piece by Nick Sundt:  

Last week NASA released data showing that last year temperatures in the Arctic rose beyond the record established in 2010 -- setting a new record for 2011. News of the record Arctic temperatures follows a series of alarming developments related to the Arctic in recent months.

Click to enlarge

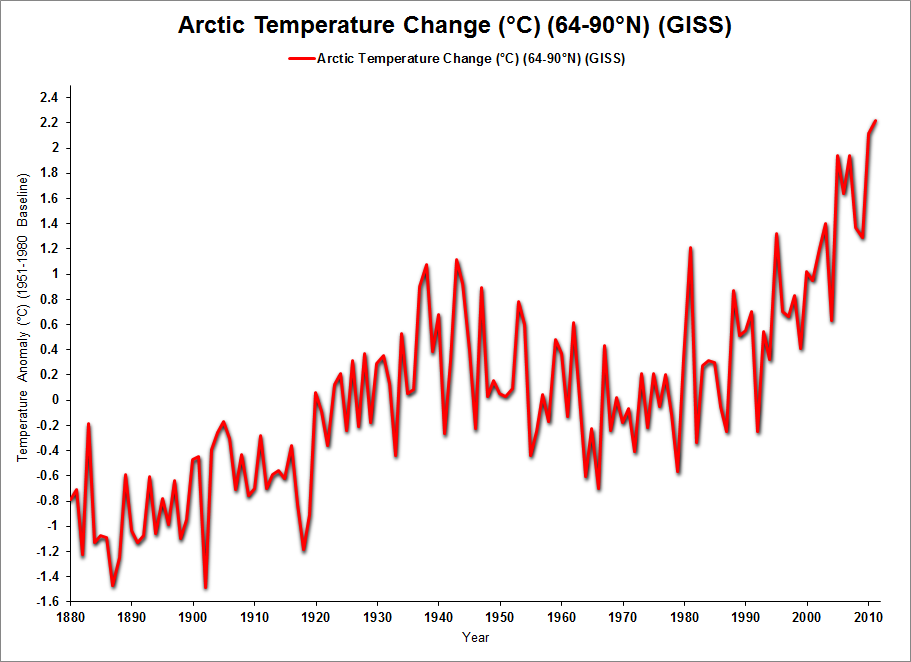
The surface temperature anomaly for the region extending from 64°N to 90°N, from 1880 through 2011, in degrees Celsius above or below the temperature during the 1951-1980 base period.  The figures shows that temperatures have risen substantially since 1880 and that the rate of increase has been especially rapid since the late 1970s. Source: data from NASA Goddard Institute for Space Studies, Combined Land-Surface Air and Sea-Surface Water Temperature Anomalies, Zonal annual means (Click for larger graphic).

According to NASA's Goddard Institute for Space Studies (GISS), the annual mean surface temperature (land and air) for the region north of 64°N (the Arctic Circle is at 66° 33'N) in 2011 was 2.28°C above that which characterized the 1951-1980 period.  Temperatures in the region have been rising rapidly since the late 1970s and have not dropped below the long term mean since 1992 -- nearly 20 years. This year's annual mean temperature broke the record that was just set in 2010, when the temperature was 2.11°C above 1951-1980 levels.

Continue reading here...

---

And as a bonus a cool video from NASA showing how that fresh water from Russian rivers got to the Beaufort Sea (a news item that popped up at several places last week):


NOTE: Researchers at Skeptical Science have audited the GISS data used to make the WWF graphic originally appearing in the source article for this blog post. The WWF graphic was found to be faithful to the source data and easily reproducible. 

0 0

Printable Version  |  Link to this page

Comments

Comments 1 to 14:

  1. I first saw this on Neven’s Arctic Sea Ice Blog and it was informative to read ClimateProgress’s further coverage. The accumulated evidence from what’s happening to the planet’s ice and the ever-worsening news coming out of the Arctic show things have reached the point of being excruciatingly obvious but the politicians just continue to stare the other way. The “political” penny should have dropped so heavily about the vanishing ice and global temperatures that it registered above eight on the Richter seismic scale and caused a tsunami of appropriate action. Instead, the denialists are reaching new heights of intentional misinformation, like this “analysis” of what’s happening in the Arctic I came across a couple of weeks ago. “-------The Arctic ice extent is almost back to average, the Arctic has been doing nothing unusual, but they continue to pretend that the Arctic ice is dwindling. I wish they would try addressing the real world rather than their politically-biased fantasies”. This beggars belief because not one single word is true, and manifestly so, starting with the absurd claim about the ice extent. As for “the real world and politically-biased fantasies”, I’ll leave you to work out who’s really off with the fairies – that shouldn’t take very long. http://nsidc.org/data/seaice_index/
    0 0
  2. Brian, I also saw it on Neven's blog too last week, and although IANACS, was immediately struck by its significance, as well as the its lack of coverage in the media. Hopefully it'll get mainstream airtime soon.
    0 0
  3. It's taken a bit of time to really filter through - the observations of the methane degassing seems to have triggered another round of attention. It's a pity that the IJIS tracking system went down last October - between its 15% baseline and DMI's 30% baseline, there was an easy way to do daily tracking of extent. Do not expect any political action. Brace yourself for the worst-case forecast being the mid-line of possible outcomes. You might as well tell the Conquistadors to stop looking for gold.
    0 0
  4. Then there was this lovely corroborative graphic derived from the BEST datasets from longtime Neven-contributor Wipneus:
    0 0
  5. DB, Yep, lovely. It appears the 'hiatus decade' started at +0.6C and ended above +1.5C. Anyone still saying warming has 'slowed down', 'paused' or whatever needs to explain this graph.
    0 0
  6. The interesting thing is that the Arctic is heating up rapidly, while spilling colder air onto the continents, like we saw during the winters of 09/10 and 10/11. The AO has now gone negative again, and we are seeing the same thing again. Due to the poor coverage of the Arctic, this puts a cool bias into the global average data that mostly ignore the Arctic, especially the CRU data. I would think some of Trenberths' "missing heat" is right there, in the Arctic, melting the sea ice, among other things. At Longyearbyen, Svalbard (close to 80 degs latitude), it is raining as we speak. On January 27th. Average temp for the last 30 days is 17F above the normal: http://www.yr.no/place/Norway/Svalbard/Longyearbyen/statistics.html Temps have been way above normal for years, pretty much without getting any media coverage whatsoever. In mainland Norway, after a very warm autumn and early winter, a few days of normal January temps was obviously sensational enough to warrant pretty much the entire frontpage of the national newspapers: http://www.yr.no/artikkel/1.7967259 Pretty much no coverage of 4 months with way above normal temps, but slightly below freezing temps at the latitude of Labrador in January is first page news. The press here is mostly run by hardcore disinformers, so not too surprising, I guess.
    0 0
  7. I am a layman - albeit one that has been following James Lovelock's writings since 1980. I hope this isn't off topic but I would appreciate being pointed at an explanation of exactly how latent heat of melting (fusion?) fits into the whole warming pattern and which models it appears in and which it doesn't. I assume that as ice melts for good and all that energy isn't 'used up' it isn't just albedo that decreases but there is a (major?) increase in the amount of heat being added to the system. Nobody seems to talk about this though. Perhaps I am at such a low level of knowledge that everyone includes it as a constant or something but I'd appreciate the pointer.
    0 0
  8. The increased open water and warmer air have sure impacted the glaciers on Arctic islands such as Svalbard and Novaya Zemyla
    0 0
  9. Peter, The amount of heat that goes into melting ice is very small compared to the amount of heat that the ocean absorbs. This graphic has a small area at the bottom that includes the latent heat. It is not discussed very often because it is not a player in the major changes. If something like ocean currents starts to transport large amounts of heat to the Antarctic it could melt ice very quickly.
    0 0
  10. Mr. Esop writes at 22:03 PM on the 27th of January, 2012: "At Longyearbyen, Svalbard (close to 80 degs latitude), it is raining as we speak. On January 27th. Average temp for the last 30 days is 17F above the normal" This has been my fear for some years, that ocean heat will rise up and rain down upon the ice sheets. Are there timely (radar?) images available showing arctic rain ? Prof. Maurice Pelto wrote at 4:18 AM on the 28th of January, 2012: "The increased open water and warmer air have sure impacted the glaciers on Arctic islands such as Svalbard and Novaya Zemyla" Thank you. I would love pointers to more reports from the northernmost land areas such Franz Josef Land, Severnaya Zemlya, Ellesmere, and Peary Land. sidd
    0 0
  11. You don't have to go so far north- here in Edmonton AB Canada, the 'normal' high for today is -7C, forecast high today is +6C, with forecast for the rest of the week all above 0C, between +1 and +6 C. We have only had 10 days of cold weather so far this year, the rest being above normal. Very low snow pack for this time of year as well.
    0 0
  12. Thanks Micheal. I assumed that with 334 kJ being absorbed by the melting of each kg of ice that will never refreeze and then the reduced albedo of open water, there would be a significant increase in energy available to be absorbed by the Arctic Ocean and permafrost in the ESAS and the adjoining land. Clearly it isn't as important as I thought!
    0 0
  13. Peter, The reduced albiedo of the water is another issue that contributes to Arctic amplification. Scientists are aware of the albeido change and it is considered in climate models. (I think the models have some trouble with this effect since they underestimate ice and snow loss). Keep reading and after a while it starts to fit together. Of course once all the Arctic ice is gone all that energy goes into the permafrost and Greenland.
    0 0
  14. Recommended reading: “Climate Change in Arctic could Trigger Domino Effect Around the World,” International Business Times, Jan 30, 2011 Click here to access. This in-depth article is based on a recently published paper by Professor Carlos Duarte, a leading scientist from The University of Western Australia.
    0 0

You need to be logged in to post a comment. Login via the left margin or if you're new, register here.


The Consensus Project Website

THE ESCALATOR

(free to republish)


© Copyright 2024 John Cook
Home | Translations | About Us | Privacy | Contact Us