Refining the remaining 1.5C ‘carbon budget’
Posted on 29 January 2021 by Guest Author
This article, guest authored by Dr Kasia Tokarska and Dr Damon Matthews was originally published on the Carbon Brief website on Jan 19, 2021. It is reposted below in its entirety. Click here to access the original article and comments posted on Carbon Brief.
The remaining “carbon budget” specifies the maximum amount of CO2 that may be emitted to stabilise warming at a particular level – such as the Paris Agreement’s 1.5C target.
Carbon budgets have played an important role in national and international climate policy – not least being a key rationale for adopting net-zero emissions targets.
Yet, there are many sources of uncertainty that make it challenging to estimate the remaining carbon budget in real-world conditions – especially for the most ambitious mitigation targets.
In our new study, published in Nature’s Communications Earth and Environment journal, we present an integrated approach to quantifying these uncertainties and incorporating them into estimates of the remaining carbon budget.
For the 1.5C target, we estimate a range of 230-440bn tonnes of CO2 (GtCO2) from 2020 onwards, which corresponds to a two-in-three to one-in-two chance of not exceeding 1.5C of global warming since pre-industrial times.
This is equivalent to between six and 11 years of global emissions, if they remain at current rates and do not start declining.
However, we emphasise that the remaining carbon budget is not a single number, but rather a distribution that reflects the probability of meeting a target – that is, the greater the chance of meeting the budget, the smaller amount of CO2 that can be emitted.
There is also an approximately one-in-six chance that the remaining carbon budget for 1.5C has already been exceeded.
If emissions decline, the budget would last longer. In the context of net-zero targets, our 230-440bn tonne range would be consistent with a scenario where CO2 emissions decrease linearly from 2019 levels to net-zero by between 2032 and 2042.
The 7% drop in emissions caused by Covid lockdowns in 2020 is in line with this rate of decrease. This emphasises that it is more important than ever that economic recovery efforts are targeted to drive emissions down further to keep the 1.5C target within reach.
Geophysical basis of the remaining carbon budget
The remaining carbon budget originates from the approximately linear relationship between cumulative CO2 emissions and the warming of the Earth that they cause. In other words, a tonne of CO2 emitted today, yesterday or 50 years ago will each lead to broadly the same amount of warming.
(Despite being expressed as the remaining amount of CO2 only, carbon budgets also take into account warming contributions from non-CO2 forcing, which this piece will explore.)
The relationship between cumulative CO2 emissions and temperature change is known as the “Transient Climate Response to Cumulative Emissions” (TCRE) and is a robust predictor of CO2-induced warming across a wide range of emissions levels and pathways.
In the chart below – from our recent Nature Geoscience perspective – TCRE is shown by the straight black line, highlighting the direct relationship between CO2 emissions and warming.
However, we do not live in a CO2-only world. There are lots of different factors that affect this relationship – shown by the coloured arrows in the chart – such as non-CO2 emissions and the response of the carbon cycle to rising CO2.
These factors make it more challenging to estimate the TCRE from observed quantities in a real-world setting.
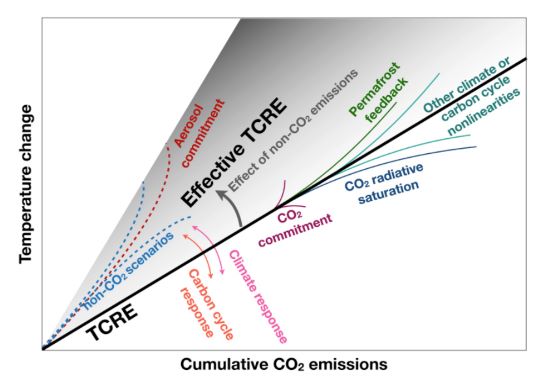
Different factors affecting the approximately linear relationship between warming and cumulative CO2 emissions: (1) physical climate and carbon cycle process that affect the slope of the TCRE line (solid coloured arrows); (2) additional geophysical processes that could cause deviations from the linear TCRE relationship (solid coloured lines); and (3) processes involving non-CO2 emissions and their effect on climate, which in general cause additional warming relative to TCRE-predicted temperature increase (dashed coloured lines). Source: Matthews et al. (2020).
As a first step in our new framework, we estimated the TCRE as a function of three quantities that describe the current state of the climate system, taking into account uncertainties in their estimates:
1. The observed human-caused warming to date;
2. Total historical CO2 emissions;
3. The fraction of observed temperature increase that is caused by CO2 compared to non-CO2 emissions.
Our best estimate of the TCRE is 0.44C per 1,000GtCO2 emitted, which is similar to the estimate used by the Intergovernmental Panel on Climate Change’s (IPCC) special report on 1.5C (SR15), which was published in 2018.
However, the range across all possible values of our TCRE estimate – known as the “uncertainty distribution” – is considerably narrower than that assessed by the IPCC in the SR15 report and the fifth assessment report (AR5), published in 2013-14. You can see this in the chart below, which shows our TCRE estimate (blue line) and that from AR5/SR15 (grey line). We are able to narrow the TCRE by making use of updated observational constraints, which are able to more clearly rule out both higher and lower TCRE values.
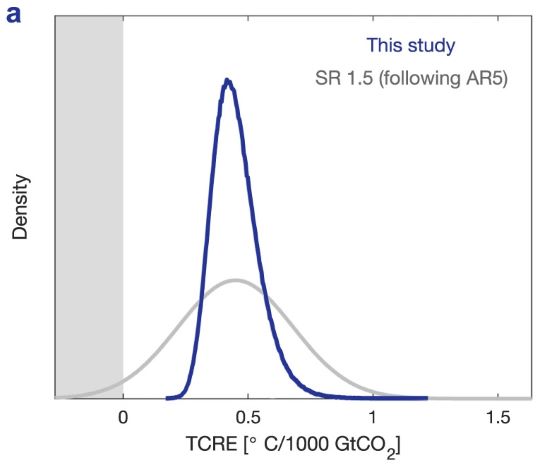
Distribution of the TCRE, reflecting uncertainty in historical warming, cumulative CO2 emissions and non-CO2 forcing. The best estimate is 0.44C per 1000 Gt CO2 emitted, with a 5-95% range of 0.32 to 0.62C per 1,000GtCO2 (blue line). The assessed TCRE distribution from AR5 is shown by the grey line. The grey shaded rectangle shows the unphysical regime of negative TCRE values (i.e. cooling per unit of carbon emitted, which is impossible). Source: Matthews et al. (2021).
Assessing the remaining carbon budget
Building on our estimate of the TCRE, we further incorporated uncertainty in two other key parameters to estimate the distribution of the remaining carbon budget:
4. The unrealised warming caused by emissions that are already in the atmosphere.
5. The uncertainty associated with the climate system’s response to non-CO2 emissions, such as methane and nitrous oxide;
Combined with the three quantities described above, these five parameters encompass all major sources of geophysical uncertainty affecting the remaining carbon budget.
Shown in the chart below, our best estimate of the remaining carbon budget for 1.5C is 440GtCO2 from 2020 onwards, with a range of 230-670GtCO2 that reflects a 67 to 33% chance of not exceeding the temperature target. The grey rectangle indicates that we find a 17% (one-in-six) chance that the remaining carbon budget for 1.5C has already been exceeded.
These values are smaller than those reported by the IPCC 1.5C report because our distribution incorporates the effect of uncertainties from non-CO2 forcing, historical warming and historical emissions that were assessed separately by SR15, and were not included in the main SR15 remaining budget estimates.
By accounting for these additional uncertainty sources, we have produced a carbon budget estimate that incorporates all of the most relevant uncertainties and is constrained by observations, and is therefore a more robust estimate of the remaining carbon budget for 1.5C.
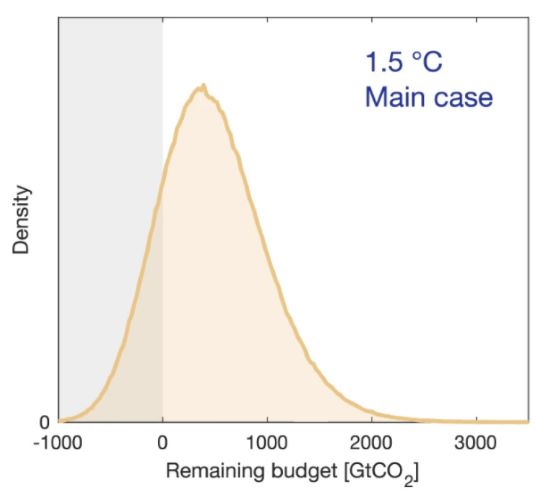
Distribution of the remaining carbon budget for 1.5C. Our best estimate is 440 GtCO2 from 2020 onwards, with a 33-67th percentile range of 230 to 670 GtCO2. The distribution incorporates geophysical uncertainty associated with historical warming and cumulative CO2 emissions, current and future non-CO2 forcing, and the unrealised warming from past emissions. Source: Matthews et al. (2021).
Accounting for socioeconomic scenario uncertainty
While the scientific uncertainty reflects incomplete understanding of physical and biological processes in the climate system, it is also necessary to consider further the different choices that society may make that affect future CO2 and other types of emissions.
For example, a key “socioeconomic” uncertainty that affects the size of the remaining carbon budget is the future pathway of non-CO2 emissions.
In our framework, we treat socioeconomic uncertainties separately. Socioeconomic uncertainties are less well suited to being quantified using a formal distribution, as we have done above, because they depend in large part on human mitigation decisions.
Instead, we use emission scenarios from the SR15 scenario database (that were specifically designed to meet the Paris Agreement target) to estimate the range of plausible combinations of CO2 vs non-CO2 forcing at the time when net-zero CO2 emissions are reached. This approach allows us to explore different non-CO2 emission trajectories for net-zero CO2 scenarios that are consistent with reaching the Paris Agreement target.
As the chart below shows, this scenario variation is enough to shift the distribution of the remaining 1.5C carbon budget (blue line) by 170GtCO2 in either direction. That is to say, high future non-CO2 emissions (purple line) could reduce the budget by 170GtCO2, while low future emissions (green line) could increase it by the same amount.

Effect of socioeconomic scenario uncertainty on the remaining carbon budget for 1.5C. Differences in future non-CO2 forcing caused by different emission scenarios have potential to shift the distribution of the remaining carbon budget by 170GtCO2 in either direction. Source: (Matthews et al. 2021).
Path to net-zero
The small size of the remaining carbon budget emphasises the need for net-zero CO2 emissions targets at the international, national and even subnational level.
This is, perhaps, the most pressing policy implication of carbon budgets – that to stabilise global temperatures at any level, the international community needs to eliminate net CO2 emissions.
The figure below, for example, illustrates how quickly global CO2 emissions need to fall in order to stay within the 1.5C (blue line) and “well below” 2C (yellow) budgets. The remaining carbon budget for 1.5C and well-below 2C are consistent with global CO2 emissions reaching net-zero before 2040 and 2060, respectively.
The dark red line shows the estimated trend of global emissions before the coronavirus crisis. However, emissions between 2019 (orange star) and 2020 (purple star) actually dropped by 7%. This is consistent with the annual rate of emission decrease required to achieve the 1.5C target.
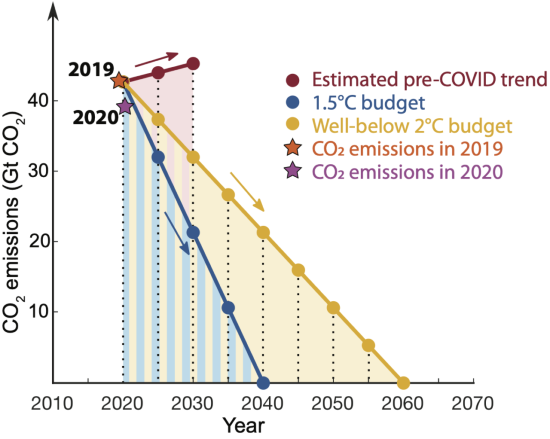
Timeline to net-zero CO2 emissions to remain within the 1.5C (blue) and “well below” 2C (yellow) carbon budgets. Stars indicate global CO2 emissions for 2019 (orange) and 2020 (purple), and the dark red line shows the expected path of global emissions before the coronavirus crisis. Source: Adapted from Matthews et al. Adapted from Matthews et al. (2020).
The way forward
To better inform this overall policy goal, scientists need to continue working to decrease the uncertainty around the remaining budgets for the most ambitious global temperature targets. This involves both improving understanding of uncertain processes, as well as reporting our choices and assumptions in order to calculate remaining carbon budgets in a consistent, clear and transparent way.
Another policy question is whether the global remaining carbon budget could – or should – be allocated to individual nations or other entities like corporations or municipalities.
“Fairness principles” – illustrated in the figure below – present a substantial challenge in allocating the (already small) remaining carbon budget among different countries in an equitable way.
For example, any national allocation of the global budget requires consideration of each country’s ability to decrease emissions and their responsibility for the past emissions – as well as the level of equity needed to justify a given allocation.
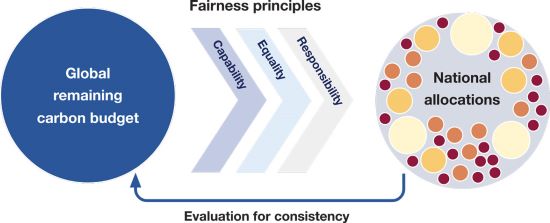
Illustration of the fairness principles required in deciding how to share the global remaining carbon budget among nations. Source: Matthews et al. (2020).
Ensuring that the sum of all national emissions targets do not exceed the remaining carbon budget will require international cooperation and oversight to strengthen existing national commitments and align future target setting with the best available science.
Thus, there is a need for scientists to work together with both social scientists and policymakers to communicate the implications of the remaining carbon budgets in a way that can help improve and strengthen national climate policies.
From a societal point of view, it is important to see the remaining carbon budget as a global limit on emissions, representing a collective effort that we all need to contribute to achieving.
All countries have a role to play in this collective goal, and only with concerted near-term effort by all of us will we retain any reasonable chance of meeting the temperature goals of the Paris Agreement.
Matthews, H. D. Tokarska, K. B. et al. (2021) An integrated approach to quantifying uncertainties in the remaining carbon budget, Communications Earth & Environment, doi:10.1038/s43247-020-00064-9
Matthews, H. D. et al. (2020) Opportunities and challenges in using remaining carbon budgets to guide climate policy, Nature Geoscience, doi:10.1038/s41561-020-00663-3
Update: This article was updated on 22/01/2021 to correct "one-in-three" chance to "two-in-three" chance in the fifth paragraph.


 Arguments


We're already pretty much a one degree and nowhere near equilibrium for current CO2 levels. The probability that warming would not exceed 1.5 degrees is likely lower than what is outlined in this article. The probability that emissions will stabilize by 2050 to levels that will allow for the atmospheric fraction to stop increasing is close enough to zero to be negligible. We should prepare for 2 degrees as minimum. The 2050 and after generations are going to have an interesting world to live in...