


 Arguments


SkS Analogy 9 - The greenhouse effect is a stack of blankets
Posted on 12 July 2023 by Evan, Bob Loblaw, jg
This is a second revision of a previous analogy. It adds an appendix with a mathematical model of the water tank example. The previous revision is here. The original version is here.
Tag Line
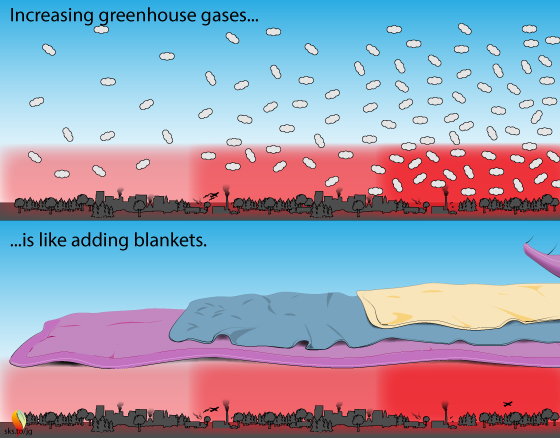
The greenhouse effect is like a stack of blankets on a winter night.
Elevator Statement
More blankets = more warmth: The greenhouse effect is like blankets warming the Earth. If it is 10°C (50°F) in your bedroom, you need a few blankets to keep yourself warm. More blankets = more warming. Too many blankets and you sweat. The greenhouse effect is a good thing, up to a point.
Climate Science
For the atmospheric temperature to be stable (i.e., no global warming nor cooling), the Earth must lose just as much energy to space as it gains from the sun. How does this work? If global warming is happening, what will ever allow it to stop and for atmospheric temperatures to stop rising?
The sun sends us more energy that we can use, in the form of a broad spectrum of light. Earth absorbs about 70% of the incident light, and reflects the rest out to space. The 70% of the suns energy that is absorbed heats the Earth. Although the energy that comes from the sun is in the form of a broad spectrum of wavelengths, things on Earth predominantly re-emit infrared radiation. Infrared radiation is emitted in all directions, including skyward. When you are sitting next to a fire, you feel the infrared heat from the fire, and some of that infrared heat moves upward, towards space. Does it make it to space?
There are many things that may prevent infrared radiation from making it to space: a passing airplane may absorb some, clouds, and some gases in the atmosphere are particularly effective at capturing infrared radiation: the so-called greenhouse gases (GHG's). The more GHG's we pump into the atmosphere, the more infrared radiation it traps, and the more the atmosphere heats up. This is global warming. But if the atmosphere warms up when we add more GHG's, what limits the amount of warming?
When things heat up they emit more infrared radiation. Compare the heat emitted from a smoldering fire to that from a roaring fire. As the atmosphere warms up, it emits more infrared radiation, some of it skyward. The warmer the atmosphere, the more infrared radiation is emitted. Although GHG's inhibit the motion of infrared radiation through the atmosphere, a warmer atmosphere forces more infrared radiation up and out into space. Eventually a balance is reached where a warmer atmosphere manages to force enough infrared radiation up and out into space to reject to space the same amount of solar energy absorbed by the Earth.
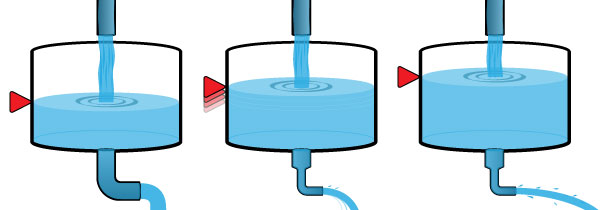
To visualize how this works, imagine a tank, with water flowing in and out. The water level is balanced when the flow rate into the tank equals the flow rate out of the tank. What happens if we restrict the outflow (middle picture above)? This is comparable to how GHG's restrict the flow of infrared radiation through the atmosphere. Initially the outflow rate decreases, causing less water to flow out than into the tank. The water level rises in response. This is comparable to atmospheric temperature increasing. But a higher water level applies more pressure to the outlet, increasing the outflow rate. As the level of water rises in the tank, the outlet flow rate increases, until a new balance is reached between inflow and outflow. The result of the restriction on the outlet is a higher water level in the tank, but otherwise the inflow and outflow rates are the same as at the beginning.
Although some of the details here might seem complicated and cause head scratching, the basic concept is simple: adding GHG's to the atmosphere is like adding more insulating blankets on top of you: you get warmer.
Historical Perspective
Replete with fancy graphics, high-tech videos, and communicated across social-media channels, it often feels as though climate science is a product of our modern age: the thing driving GHG emissions. But crack open a dusty journal from days gone by, and we soon realize that our knowledge about the "warming blankets" over Earth dates back to the dawn of the Industrial Revolution.
In 1858 a female American researcher, Eunice Foote, published the following in The American Journal of Science and Arts (Vol XXII, Nov. 1856)
“The highest effect of the sun’s rays I have found to be in carbonic acid gas [CO2]. ... An atmosphere of that gas would give to our earth a high temperature; and if as some suppose, at one period of its history, the air had mixed with it a larger proportion than at present, an increased temperature from its own action, as well as from increased weight, must have necessarily resulted.”
Five years later John Tyndall, the person generally recognized as discovering the heat-trapping characteristics of CO2 and other GHG's, wrote the following in the Philosophical Transactions of the Royal Society of London (Vol. 151 (1861), pp. 1-36)
“Now if, as the above experiments indicate, the chief influence be exercised by the aqueous vapour, every variation of this constituent must produce a change of climate. Similar remarks would apply to the carbonic acid [CO2] diffused through the air; while an almost inappreciable admixture of any of the hydrocarbon vapours would produce great effects on the terrestrial rays and produce corresponding changes of climate.”
We've known for a very long time about the heat-trapping effect of GHG's and that they act like a pile of blankets over the Earth.
Appendix (added July 2023)
The water tank example is a "descriptive model". Using plain words and a figure, it visualizes a leaky water tank and how the water level responds when the flow rate out the bottom is reduced. The water tank example can also be expressed quantitatively with a mathematical model. Such models are useful for visualizing the behavior of the water tank with graphs
Converting a verbal description into a mathematical model is done by describing the flow into/out of the tank using a series of equations. We translate the day-to-day language of the descriptive model into the language of mathematics. The net effect of these flow equations also tells us about the height of the liquid in the tank.
- The first equation describes the water flow into the top of the tank. Let's set this at a constant rate of 400 (with units of volume per unit time).
Inflow = 400
- The second equation is the pressure pushing water out of the drain at the bottom. This is zero when the bucket is empty, and increases proportional to the depth of water in the tank. This is a linear relationship, where the multiplier a (related to the liquid's density) turns height into pressure:
Pressure at drain = a*(water level)
- To translate inflow into water depth, we need the tank area. Let's make it 400 (units of area), so that the constant inflow of 400 would make the level rise by 1 height unit over one period of time.
- We also need to determine the outflow rate through the drain. We need the pressure (above), and the area of the drain, and some fluid dynamics related to how easily the liquid flows through the drain. Let's keep it simple and assume that the multiplier a and the drain characteristics all work out so that the outflow can be given by:
outflow = (area of drain)* (water level)
- ...we can combine these into our complete model:
(inflow - outflow)/(area of bucket) = (change in water level)
- ...or, by substituting the previous equations
(400 - area of drain * water level)/400 = change in water level
But how do we turn this into a graph (or set of numbers) that shows the change in water level over time? Like any journey of a thousand miles, begin with a single step. And follow that with another step. And another. And our steps will be steps in time.
- Let's start with an empty tank, and a drain with an area of 2.
1. In the first step, we add 400 from our inflow. The tank is initially empty, so outflow is initially zero. The inflow will increase the water level in the tank to 1.
2. In the second step, our inflow is again 400, but our outflow is now 2*1=2 (drain area times water level), so the net input is only 398, The level rises by 0.995, to 1.995.
3. At step 3, inflow is still 400, outflow is now 2*1.995=3.99, and the water level rises to 2.985.
...and so on.
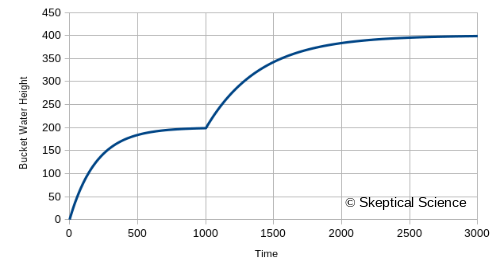
- At time 1000, our water level has risen to 198.7, We still have an input of 400, but our outflow through the drain is 397.3. The net input is only 2.7, and the water level is rising very slowly. We've reached a nearly-constant water level.
- So, now what happens if we partially close the drain at time 1000? Let's reduce its area from 2 to 1.
- The immediate effect is to reduce the outflow by half, to about 198.7
- Now the net input jumps from 2.7 to 201.3 (400 - 198.7).
- ...and the water level starts to rise quickly again.
- ..and we keep calculating new time steps moving forward with the new drain area, until things stabilize.
We can put this model into a spreadsheet, where each row represents an additional step in time, and generate the following graphs. First, the water level versus time:
And then the flow rates:
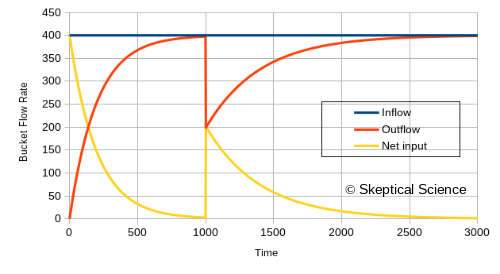
...and now we have another visual of how reducing the flow out of the bottom of the water tank leads to a rise in the water level. The numbers are also intuitive:
- To compensate for an inflow of 400, we need an outflow of 400.
The water level rises until the pressure is high enough for the drain to allow an outflow of 400.
- When we restrict the drain size at time 1000, reducing it by one half, the outflow drops by half.
The water level needs to rise to twice the height (twice the pressure) to increase the outflow to 400 again.
- If we go back to our equations, where our mathematical model is (400 - area of drain * water level)/400 = change in water level
The change in water level is zero when we have a drain area of 2 and a water level of 200, or if we have a drain area of 1 and a water level of 400.
...but the step-by-step model also shows us how we get there.
Now you have seen how a descriptive model can be translated into a mathematical model.
If you want to play with this model, Skeptical Science has provided a CSV file at this link. It can be imported into any spreadsheet program, and will give you the equations needed to generate the data. You will need to create your own graphs, though - that can't be saved in a CSV file.
Once you have this in a spreadsheet, you can change the values for the constant inflow, the initial water level, the area of the tank, the initial and final area of the drain (and the time at which the change occurs), and the size of the time step. You can explore the model to see how it behaves under different conditions - what it the water level starts at 400? what if the drain size starts at 1 and change to 2? etc.
We have intentionally avoided units in this mathematical model. It does not matter what length units or time units you use, as long as you are consistent. Length in cm, mm, m, inches, feet, or furlongs. Area in the same unit2, and volume in the same unit3. Time can be seconds, minutes, hours, etc. Tradition dictates that if you select furlongs for length, that you use fortnights for time.


There is a logical fallacy at the root of this misleading analagy. That is, if some CO2 absorbs some IR, then more CO2 will always absorb more.
But CO2 can only effectively absorb the Earth's IR in one radiation band. That of 14-16 microns wavelength.
1992 NASA data shows that at present CO2 levels, the CO2 absorbs all of the enery in this band. So more CO2 cannot absorb more energy-it is not there.
My analogy. If there is one cup of water in a bowl, and 1 sponge can absorb 1 cup. 1 sponges will not absorb 2 cups-it just isn't there.
NASA Technical Memorandum 103957. Appendix E. This has not been available until very recently. A full discussion can be found in "Carbon Dioxide-Not Guilty". Hisey, 2022. Kindle.
[BL] There is a Comments Policy here at this web site. Item #3 says:
This is the fourth time you have made the same comment. on various threads. Further attempts will be deleted in their entirety.
Final Warning
Please note that posting comments here at SkS is a privilege, not a right. This privilege can and will be rescinded if the posting individual continues to treat adherence to the Comments Policy as optional, rather than the mandatory condition of participating in this online forum.
Moderating this site is a tiresome chore, particularly when commentators repeatedly submit offensive, off-topic posts or intentionally misleading comments and graphics or simply make things up. We really appreciate people's cooperation in abiding by the Comments Policy, which is largely responsible for the quality of this site.
Finally, please understand that moderation policies are not open for discussion. If you find yourself incapable of abiding by these common set of rules that everyone else observes, then a change of venues is in the offing.
Please take the time to review the policy and ensure future comments are in full compliance with it. Thanks for your understanding and compliance in this matter, as no further warnings shall be given.
Bobhisey @1 ,
You have completely misunderstood the physics of the interaction of InfraRed radiation and CO2 (and other molecules).
Bob, you are an intelligent guy, and you have been hovering on the edges of the "climate debate" for ages now. And yet you still keep failing to grasp the basics of science in this regard. There must be some sort of mental block going on. Know Thyself !