


 Arguments


SkS Analogy 22 - Energy SeaSaw: Part III
Posted on 28 June 2021 by Evan, jg
Tag Line
Illustrating what causes complex temperature patterns.
Climate Science
What causes the complicated patterns in measured temperature anomalies from year to year? Why is there so much variation, and do you need a Ph.D. in climate science to understand what creates such erratic patterns in measured temperature anomalies, such as those shown in Fig. 1? Although the plot of temperature anomaly vs. year might appear random, there are many known processes that create the detailed, complicated structure, such as energy exchange between the oceans and the atmosphere described in Energy SeaSaw Part I.
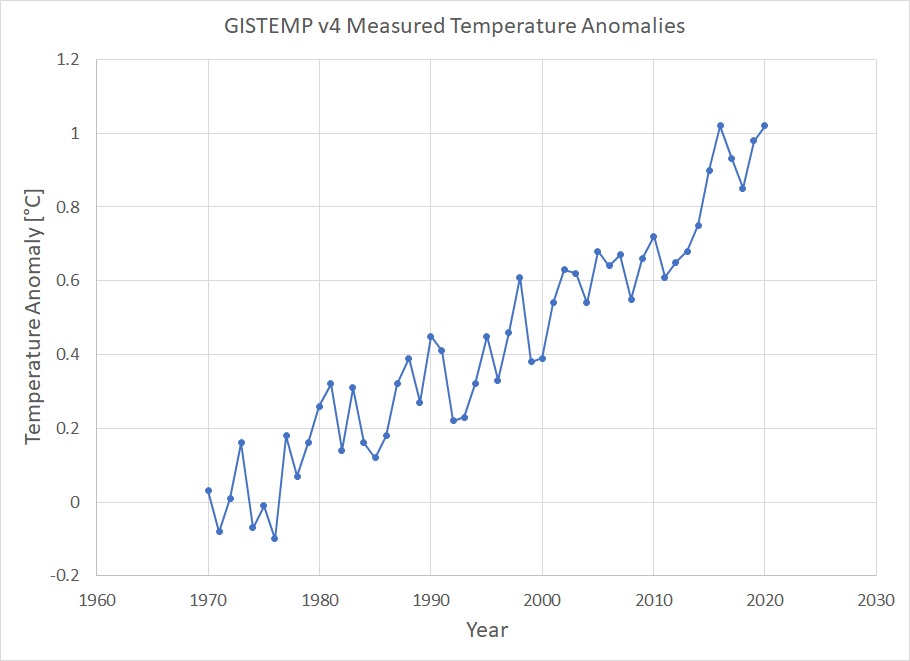
Figure 1. Temperature anomalies from 1970 to 2020 from the NASA GISTEMP v4 data set.
It is clear from Fig. 1 that temperature anomalies are increasing, but from year to year there are significant ups and downs. Another way to get a feel for how regular processes create what appears to be random variations on an otherwise increasing trend, consider the evolution of the financial assets of a typical family over a single year. Figure 2 shows the hypothetical ups and downs superimposed on top of steadily increasing assets.
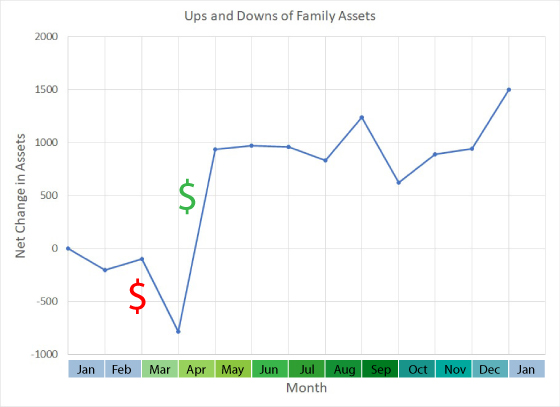
Figure 2. Net change in assets over a single year for a typical modern family.
Figure 2 indicates that over a single year the net assets increase by 1500, but with substantial month-to-month variability. Although this is a complicated monthly change in assets, it stems from expenses that are familiar to most people and include the following.
- A household income of 50,000/yr paid every two weeks. This means there are 26 payments/year. In most months there will be two income payments, but in two months there will be 3 payments.
- Taxes are paid out of every pay check. But there is a tax refund that we assume is received as a single lump-sum payment in April.
- There are total weekly expenses of 2500/yr. This includes things like gas for the car.
- Monthly expenses of 12,500/yr. This includes car payments, house payments, utilities, etc. Things you pay for once/month. Because utilities vary from month-to-month, these bills are not the same each month, and therefore introduce month-to-month variations.
- Seasonal expenses of 1500/yr. This includes things like books and participation fees for kids in school.
- Random expenses of about 7500/yr that include groceries and things like house and car repairs.
Although typical families have regular income and expenses, the month-to-month timing is variable. Although income is relatively consistent and uniform (such as energy received from the sun), expenses are, by nature, variable. When we pay taxes to the government, many people pay estimated taxes during the year that exceed the amount they owe, and then receive a single, lump-sum payment in the form of a tax return. This is similar to the rapid warming that may occur during an El-Nino year, when excess, stored energy in the oceans is released to the atmosphere as a relatively rapid burst. Understanding the underlying physics that create the seemingly complicated, measured temperature anomalies is not much different than understanding the income and expenses that create the pattern of how the assets of a typical family change over the course of a year.
Additional Reading
For a description of the effects of El-Nino/La-Nina, volcanoes, and solar insolation on observed temperature anomalies, such as those shown in Fig. 1, see Foster and Rahmstorf (2011). They demonstrate how the effects of El-Nino/La-Nina, volcanoes, and solar insolation can be removed from measured temperature data sets to reveal more clearly the underlying, consistent warming signal.
Also check out this very informative illustration by Bloomberg Businessweek. They present the individual effects of many different natural and human-induced factors, and show how together all of these natural and human-induced factors add up to give us the observed temperature history.
References
Grant Foster and Stefan Rahmstorf 2011 Environ. Res. Lett. 6 044022.


Coal Prices Hit Decade High Despite Efforts to Wean the World Off Carbon
This is the REAL result of Kyoto protocol and Paris agreement
So fairy tales from politics and others...
How many times Paris agreement was mansion here? Fairy tales and reality
[BL] Off-topic deleted.
The developing nations following the horrible development examples set by the supposedly more advanced nations will indeed be a disaster.
[BL] Response to deleted comment removed at user's request.
Agree with moderator ... delete my resposne as well.
[BL] Done.
As this is your first post, Skeptical Science respectfully reminds you to please follow our comments policy. Thank You!
Ok I will follow respectful guidlines.
To my mind having these temperatures just past when the sun was at its norther most travel across the earth is disturbing.
The temperatures once the Northern Hemisphere moves into July and the land has heated up the heat excursions one would have to assume will be once again new records.
Thank you for accepting me for comments I have followed this site for well on 10 years.