 Arguments
 Software
 Resources
Comments
 The Consensus Project
 Translations
 About
Support


Latest Posts
- Skeptical Science New Research for Week #6 2026
- The future of NCAR remains highly uncertain
- Fact brief - Can solar projects improve biodiversity?
- How the polar vortex and warm ocean intensified a major US winter storm
- 2026 SkS Weekly Climate Change & Global Warming News Roundup #05
- Help needed to get translations prepared for our website relaunch!
- Skeptical Science New Research for Week #5 2026
- Climate Variability Emerges as Both Risk and Opportunity for the Global Energy Transition
- Fact brief - Are solar projects hurting farmers and rural communities?
- Winter 2025-26 (finally) hits the U.S. with a vengeance
- 2026 SkS Weekly Climate Change & Global Warming News Roundup #04
- Skeptical Science New Research for Week #4 2026
- WMO confirms 2025 was one of warmest years on record
- Fact brief - Do solar panels release more emissions than burning fossil fuels?
- Keep it in the ground?
- 2026 SkS Weekly Climate Change & Global Warming News Roundup #03
- Skeptical Science New Research for Week #3 2026
- Climate Adam - Will 2026 Be The Hottest Year Ever Recorded?
- Fact brief - Does clearing trees for solar panels release more CO2 than the solar panels would prevent?
- Where things stand on climate change in 2026
- 2026 SkS Weekly Climate Change & Global Warming News Roundup #02
- Skeptical Science New Research for Week #2 2026
- UK renewables enjoy record year in 2025 – but gas power still rises
- Six climate stories that inspired us in 2025
- How to steer EVs towards the road of ‘mass adoption’
- 2026 SkS Weekly Climate Change & Global Warming News Roundup #01
- Skeptical Science New Research for Week #1 2026
- 2025 in review - busy in the boiler room
- Direct Air Capture
- IEA: Declining coal demand in China set to outweigh Trump’s pro-coal policies
Archived Rebuttal
This is the archived Basic rebuttal to the climate myth "It's the sun". Click here to view the latest rebuttal.
What the science says...
|
The sun's energy has decreased since the 1980s but the Earth keeps warming faster than before. |
Over the last 35 years the sun has shown a cooling trend. However global temperatures continue to increase. If the sun's energy is decreasing while the Earth is warming, then the sun can't be the main control of the temperature.
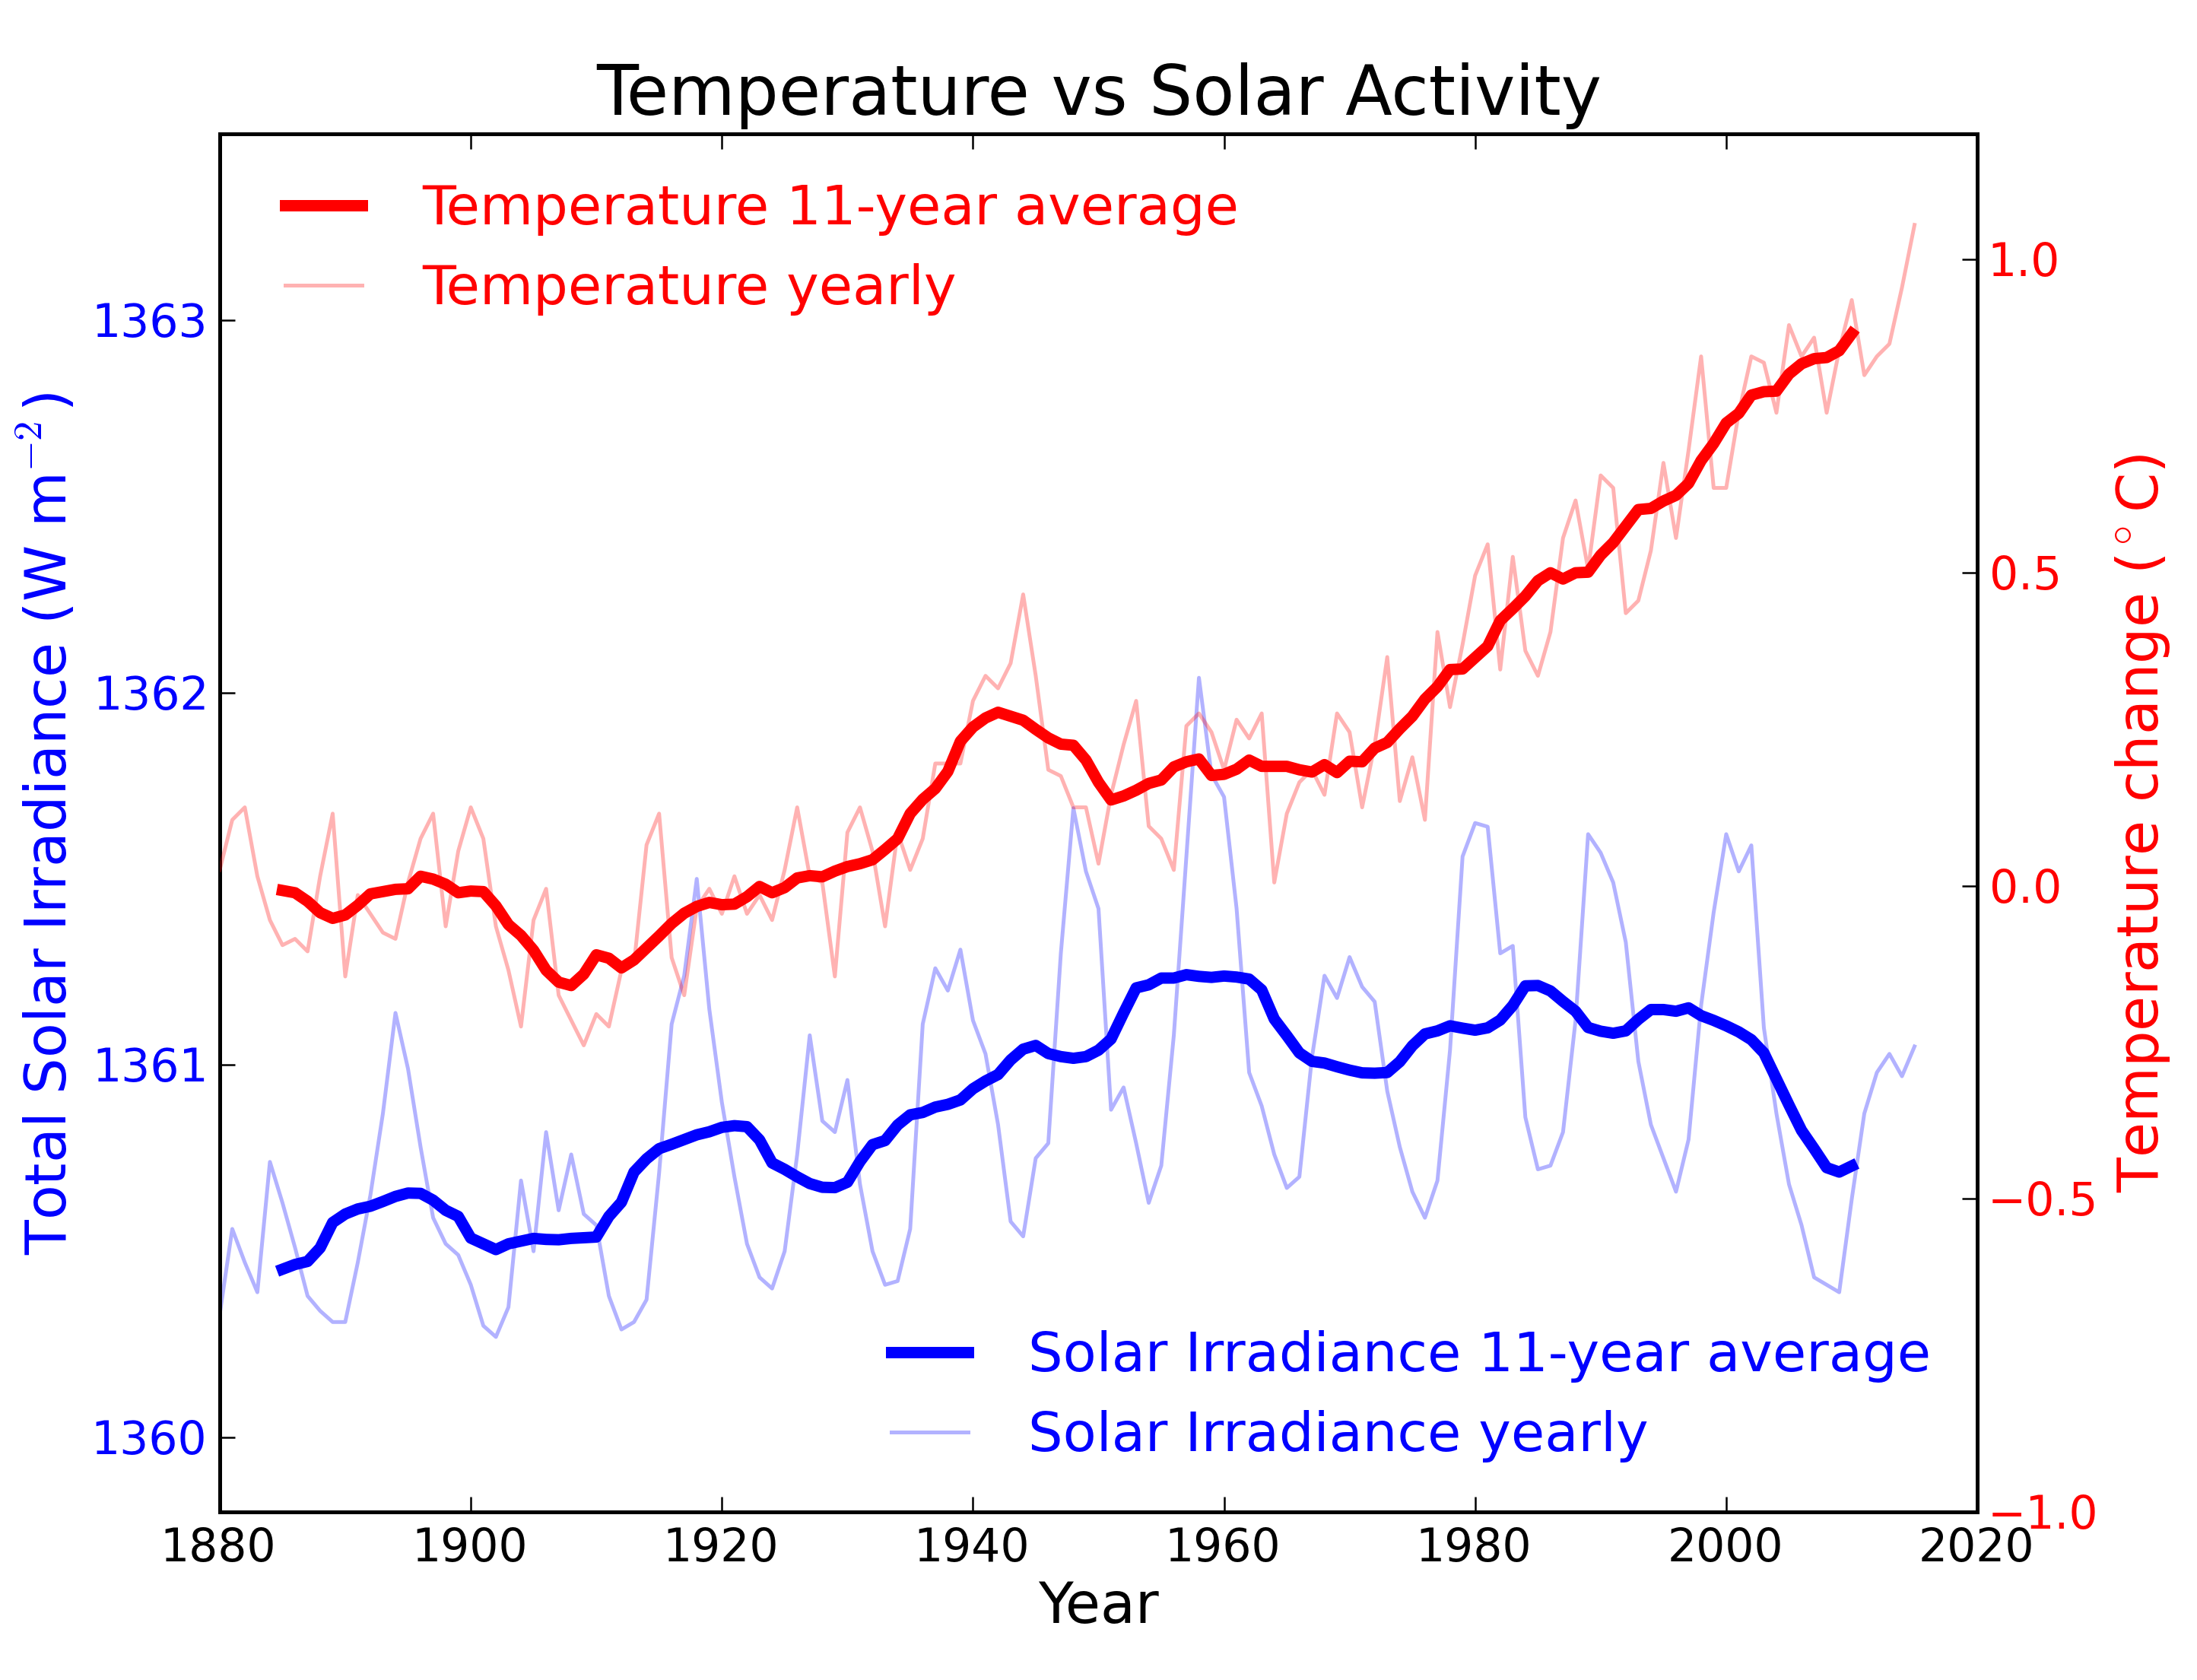
Figure 1 shows the trend in global temperature compared to changes in the amount of solar energy that hits the Earth. The sun's energy fluctuates on a cycle that's about 11 years long. The energy changes by about 0.1% on each cycle. If the Earth's temperature was controlled mainly by the sun, then it should have cooled between 2000 and 2008.

Figure 1: Annual global temperature change (thin light red) with 11 year moving average of temperature (thick dark red). Temperature from NASA GISS. Annual Total Solar Irradiance (thin light blue) with 11 year moving average of TSI (thick dark blue). TSI from 1880 to 1978 from Krivova et al 2007. TSI from 1979 to 2015 from the World Radiation Center (see their PMOD index page for data updates). Plots of the most recent solar irradiance can be found at the Laboratory for Atmospheric and Space Physics LISIRD site.
The solar fluctuations since 1870 have contributed a maximum of 0.1 °C to temperature changes. In recent times the biggest solar fluctuation happened around 1960. But the fastest global warming started in 1980.
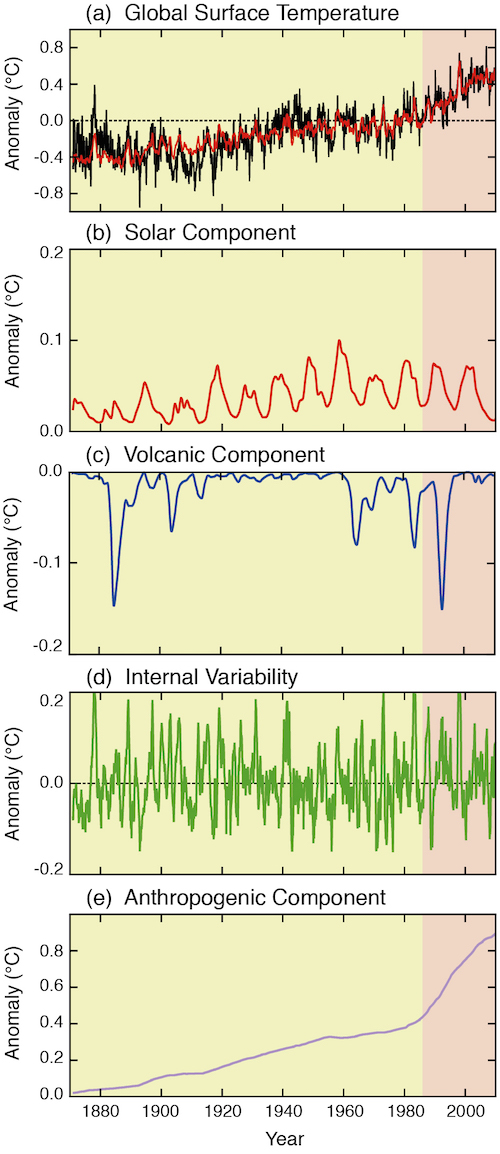
Figure 2 shows how much different factors have contributed recent warming. It compares the contributions from the sun, volcanoes, El Niño and greenhouse gases. The sun adds 0.02 to 0.1 °C. Volcanoes cool the Earth by 0.1-0.2 °C. Natural variability (like El Niño) heats or cools by about 0.1-0.2 °C. Greenhouse gases have heated the climate by over 0.8 °C.

Figure 2 Global surface temperature anomalies from 1870 to 2010, and the natural (solar, volcanic, and internal) and anthropogenic factors that influence them. (a) Global surface temperature record (1870–2010) relative to the average global surface temperature for 1961–1990 (black line). A model of global surface temperature change (a: red line) produced using the sum of the impacts on temperature of natural (b, c, d) and anthropogenic factors (e). (b) Estimated temperature response to solar forcing. (c) Estimated temperature response to volcanic eruptions. (d) Estimated temperature variability due to internal variability, here related to the El Niño-Southern Oscillation. (e) Estimated temperature response to anthropogenic forcing, consisting of a warming component from greenhouse gases, and a cooling component from most aerosols. (IPCC AR5, Chap 5)
Some people try to blame the sun for the current rise in temperatures by cherry picking the data. They only show data from periods when sun and climate data track together. They draw a false conclusion by ignoring the last few decades when the data shows the opposite result.
Basic rebuttal written by Larry M, updated by Sarah
Update July 2015:
Here is a related lecture-video from Denial101x - Making Sense of Climate Science Denial
Updated on 2017-04-02 by Sarah.
THE ESCALATOR

(free to republish)


