 Arguments
 Software
 Resources
Comments
 The Consensus Project
 Translations
 About
Support


Latest Posts
- Sea otters are California’s climate heroes
- 2026 SkS Weekly Climate Change & Global Warming News Roundup #06
- Skeptical Science New Research for Week #6 2026
- The future of NCAR remains highly uncertain
- Fact brief - Can solar projects improve biodiversity?
- How the polar vortex and warm ocean intensified a major US winter storm
- 2026 SkS Weekly Climate Change & Global Warming News Roundup #05
- Help needed to get translations prepared for our website relaunch!
- Skeptical Science New Research for Week #5 2026
- Climate Variability Emerges as Both Risk and Opportunity for the Global Energy Transition
- Fact brief - Are solar projects hurting farmers and rural communities?
- Winter 2025-26 (finally) hits the U.S. with a vengeance
- 2026 SkS Weekly Climate Change & Global Warming News Roundup #04
- Skeptical Science New Research for Week #4 2026
- WMO confirms 2025 was one of warmest years on record
- Fact brief - Do solar panels release more emissions than burning fossil fuels?
- Keep it in the ground?
- 2026 SkS Weekly Climate Change & Global Warming News Roundup #03
- Skeptical Science New Research for Week #3 2026
- Climate Adam - Will 2026 Be The Hottest Year Ever Recorded?
- Fact brief - Does clearing trees for solar panels release more CO2 than the solar panels would prevent?
- Where things stand on climate change in 2026
- 2026 SkS Weekly Climate Change & Global Warming News Roundup #02
- Skeptical Science New Research for Week #2 2026
- UK renewables enjoy record year in 2025 – but gas power still rises
- Six climate stories that inspired us in 2025
- How to steer EVs towards the road of ‘mass adoption’
- 2026 SkS Weekly Climate Change & Global Warming News Roundup #01
- Skeptical Science New Research for Week #1 2026
- 2025 in review - busy in the boiler room
Archived Rebuttal
This is the archived Intermediate rebuttal to the climate myth "Arctic sea ice loss in the 1940s was similar to today's". Click here to view the latest rebuttal.
What the science says...
|
The observational data and scientific literature show that the current Arctic sea ice decline is far greater than any decline earlier in the 20th Century. |
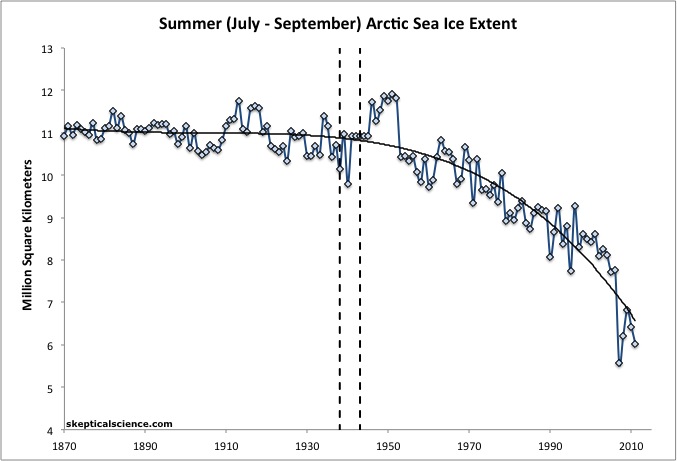
One of the most widely used long-term estimates of Arctic sea ice extent comes from Walsh and Chapman (2001), whose data are available from the University of Illinois (updated through 2008). A description of the vast array of data used by Walsh and Chapman is available via tamino here, and the data are plotted in Figure 1.
Figure 1: Average July through September Arctic sea ice extent 1870-2008 from the University of Illinois (Walsh & Chapman 2001 updated to 2008) and observational data from NSIDC for 2009-2011 (blue), with a fourth order polynomial fit (black soiid line). Black vertical dashed lines indicate the years 1938-43.
Clearly the extent of Arctic sea ice during 1938-43 was nowhere near as low as current levels, based on these data. According to this reconstruction, the minimum extent during that timeframe (9.8 million square kilometers in 1940) was higher than it has been at any time since 1979. In other words, Arctic sea ice extent has been lower than it was in 1938-43 during the entire satellite record, and the current average summer extent is approximately 4.3 million square kilometers lower than the 1940 minimum.
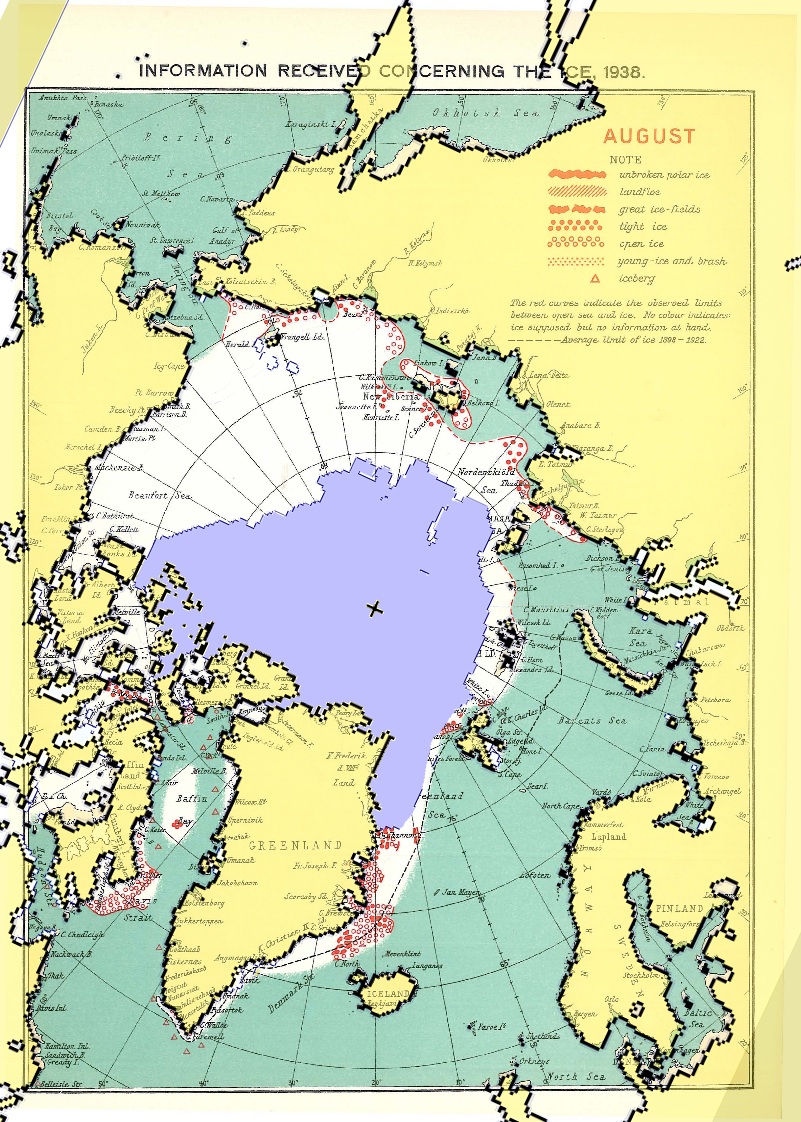
It's true that according to this dataset, 1940 was a local minimum - the lowest Arctic sea ice extent of the 20th Century up to that point, and a minimum that was not repeated again for another 20 years. In that sense one could argue that Arctic sea ice extent at least in 1940 was "very low" compared to the early and mid 20th Century, but compared to the past 20 years it was actually very high. This is also clear from a visual comparison of sea ice extents in 1938 and 2012 (Figure 2).
Figure 2: Arctic sea ice extent on 27 August 2012 from NSIDC and NASA (purple) overlaid on a map of sea ice extent in August 1938 from the Danish Meteorological Institute. Red symbols indicate direct observations in 1938.
Henry Larsen, who sailed the Arctic from 1922 to 1948 (including 12 times surviving being stuck in the Arctic ice all winter), tried to sail the St. Roch through the Northwest Passage in 1940. The voyage took more than two years to complete, as the ship struggled through the ice. Larsen gave this firsthand account of the state of Arctic ice at the time:
"The three seasons of the short Arctic Summers from 1940-42 had been extremely bad for navigation, the worst consecutive three I had experienced as far as ice and weather conditions were concerned, and in my remaining years in the Arctic I never saw their like. Without hesitation I would say that most ships encountering the conditions we faced would have failed."
On the other side of the Arctic, Russian martime operations using icebreakers on the Northern Sea Route began in 1932 and give no evidence for improving ice conditions in this period; rather the opposite, as 1937 and 1940 were noted for heavy ice in the Laptev Sea.
Greenland Temperature and Arctic Dominoes
John Christy provided two references to support his assertions of low sea ice extent in 1938-43, Box et al. (2009) and Kobashi et al. (2010). However, neither of these papers involve reconstructions of Arctic sea ice extent; rather, they deal with reconstructing Greenland temperatures, which are not necessarily representative of Arctic temperature as a whole - after all, the continent is covered in a large ice sheet, and the reconstructions are from the summit of the Greenland ice cap, not at sea level.
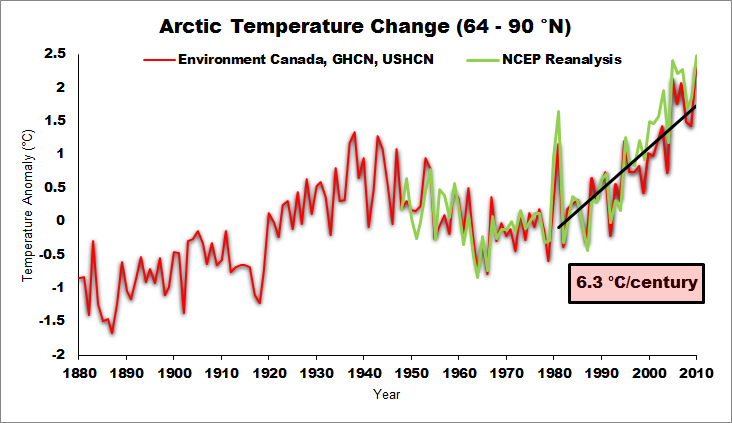
We contacted Jason Box (lead author of Box et al. 2009), who also noted that local temperatures are not the only factor at play in determining Arctic sea ice extent. During the past two decades, Greenland temperatures have climbed rather steeply, surpassing local temperatures in the 1930s (Figure 3), and even moreso over the whole Arctic (Figure 4). These rising temperatures have been accompanied by unprecedented Greenland ice sheet surface melt. Greenland glaciers have declined (Bjørk et al. 2012) as have Greenland's ice shelves (Falkner et al. 2011). For example, the Ward Hunt Ice Shelf, which was a least 3,000 years old, split off in 2002 (Mueller et al. 2003, England et al. 2008, and Antoniades et al. 2011).
All of this regional ice loss has decreased the local surface reflectivity (albedo), causing the Arctic to absorb more solar radiation, and thus we can expect that similar temperatures now will have a larger impact on sea ice extent than in the past.
Figure 3: Greenland surface air temperature anomalies relative to the 1951-1980 average (Source)
Figure 4: Temperature Anomalies (1951-1981 Baseline) for the Arctic region (64-90°N) over the past 130 years according to ccc-gistemp analysis and NCEP reanalysis data.
In other words, there is a domino effect at play. Human-caused global warming contributes to the summer Greenland warming (Figure 3), which causes snow to melt earlier, which causes decreased local albedo, which contributes to record Greeland ice sheet decline, which further decreases local albedo, which in turn contributes to the Arctic sea ice decline.
Updated on 2012-09-05 by dana1981.
THE ESCALATOR

(free to republish)


