


 Arguments
Software
Resources
Comments
The Consensus Project
Translations
About
Support
Arguments
Software
Resources
Comments
The Consensus Project
Translations
About
Support
![]()
![]()
![]()
![]()
![]()
![]()
![]()
![]()
![]()
![]()


![]()


Latest Posts
- Skeptical Science New Research for Week #29 2026
- Home batteries could become the next must-have household appliance
- Fact brief - Do electric vehicles stop working in extreme heat?
- Deadly heat wave in France shows the future of climate risk
- 2026 SkS Weekly Climate Change & Global Warming News Roundup #28
- Skeptical Science New Research for Week #28 2028
- Six charts show how clean power was world’s largest source of new energy in 2025
- Eastern U.S. broils after heat wave kills over 1,300 in Europe
- How climate change influences extreme weather
- 2026 SkS Weekly Climate Change & Global Warming News Roundup #27
- Skeptical Science New Research for Week #27 2026
- Climate Adam - Is Climate Change Ramping Up El Niño Risks?
- Fact brief - Are injuries from wind turbines common?
- How bad is AI for the environment?
- 2026 SkS Weekly Climate Change & Global Warming News Roundup #26
- Skeptical Science New Research for Week #26 2026
- What Americans can learn from London’s war on cars
- New Publication: Identifying Flawed Reasoning in Contrarian Claims about Climate Change
- The Merchants of Doubt are coming for Extreme Event Attribution science
- 2026 SkS Weekly Climate Change & Global Warming News Roundup #25
- Cooking up the Climate Stripes, with Ed Hawkins
- Skeptical Science New Research for Week #25 2026
- How ‘balcony solar’ could help fight rising utility costs
- Fact brief - Does solar energy need subsidies to compete with fossil fuels?
- Plateauing CO2 emissions have slowed atmospheric growth
- 2026 SkS Weekly Climate Change & Global Warming News Roundup #24
- Skeptical Science New Research for Week #24 2026
- June update: Help still needed to get translations prepared for our website relaunch!
- How many people does heat actually kill?
- Check out the brand-new hurricane ‘cone of uncertainty’ graphics arriving this season
Archived Rebuttal
This is the archived Advanced rebuttal to the climate myth "Scientists tried to 'hide the decline' in global temperature". Click here to view the latest rebuttal.
What the science says...
|
There are a number of misconceptions regarding 'hide the decline':
|
"Hide the decline" has become a slogan for climate skeptics. However, there are several misconceptions concerning this email that give a misleading picture of the science discussed in Phil Jones' email. When one takes the time to read the email and understand the science discussed, the misconceptions are easily put into proper context.
The decline is about northern tree-rings, not global temperature
Phil Jones' email is often cited as evidence of an attempt to "hide the decline in global temperatures". This claim is patently false and demonstrates ignorance of the science discussed. The decline actually refers to a decline in tree growth at certain high-latitude locations since 1960.
Tree-ring growth has been found to match well with temperature and hence tree-rings are used to plot temperature going back hundreds of years. However, tree-rings in some high-latitude locations diverge from modern instrumental temperature records after 1960. This is known as the "divergence problem". Consequently, tree-ring data in these high-latitude locations are not considered reliable after 1960 and should not be used to represent temperature in recent decades.
The divergence problem has been openly discussed in the peer-reviewed literature since 1995 when it was noticed that Alaskan trees were showing a weakened temperature signal in recent decades (Jacoby 1995). This work was broadened in 1998 using a network of over 300 tree-ring records across high northern latitudes (Briffa 1998). From 1880 to 1960, tree growth closely matches temperature measurements. However, the correlation drops sharply after 1960 for certain trees at high latitudes.

Figure 1: Twenty-year smoothed plots of tree-ring width (dashed line) and tree-ring density (thick solid line), averaged across a network of mid-northern latitude boreal forest sites and compared with equivalent-area averages of mean April to September temperature anomalies (thin solid line). (Briffa 1998)
Does the divergence problem mean we cannot rely on tree-ring growth as a proxy for temperature in the past? Briffa 1998 shows that tree-ring width and density show close agreement with temperature back to 1880. To examine earlier periods, one study split a network of tree sites into northern and southern groups (Cook 2004). While the northern group showed significant divergence after the 1960s, the southern group was consistent with recent warming trends.
This is a general trend with the divergence problem - trees from high northern latitudes show divergence while low latitude trees show little to no divergence. Before the 1960s, the northern and southern trees tracked each other reasonably well back to the Medieval Warm Period. This suggests the current divergence problem is unique over the past thousand years and is restricted to recent decades.
A thorough review of the many peer reviewed studies investigating possible contributing factors can be found in On the ’divergence problem’ in northern forests: A review of the tree-ring evidence and possible causes (D’Arrigo 2008). Some of the findings:
-
Various studies have noted the drop in Alaskan tree-growth coincides with warming-induced drought. By combining temperature and rainfall records, growth declines were found to be more common in the warmer, drier locations.
-
Studies in Japan and Bavaria suggest increasing sulfur dioxide emissions were responsible.
- As the divergence is widespread across high northern latitudes, Briffa 1998 suggests there may be a large scale explanation, possibly related to air pollution effects. A later study by Briffa proposed that falling stratospheric ozone concentration is a possible cause of the divergence, since this observed ozone decline has been linked to an increased incidence of ultraviolet (UV-B) radiation at the ground (Briffa 2004).
-
Connected to this is global dimming (a drop in solar radiation reaching the ground). The average amount of sunlight reaching the ground has declined by around 4 to 6% from 1961 to 1990.
-
One study suggests that microsite factors are an influence on whether individual trees are vulnerable to drought stress. Eg - the slope where the tree is located, the depth to permafrost and other localised factors (Wilmking 2008). This paper amusingly refers to the divergence problem as the "divergence effect" so as "to not convey any judgement by the wording" (you wouldn't want to offend those overly sensitive Alaskan trees).
There is evidence for both local and regional causes (e.g. drought stress) as well as global scale causes (e.g. global dimming). It's unlikely there's a single smoking gun to explain the divergence problem. More likely, it's a complex combination of various contributing factors, often unique to different regions and even individual trees.
It's worth noting that reconstructions of past temperature are based on a range of proxy data. Reconstructions of temperature made with and without the use of tree-ring data obtain essentially the same result, finding that recent warmth is unprecedented over the last 1300 years (Mann et al 2008).
The "decline" has nothing to do with "Mike's trick".
Phil Jones talks about "Mike's Nature trick" and "hide the decline" as two separate techniques. However, people often abbreviate the email, distilling it down to "Mike's trick to hide the decline". Professor Richard Muller from Berkeley commits this error in a public lecture:
"A quote came out of the emails, these leaked emails, that said "let's use Mike's trick to hide the decline". That's the words, "let's use Mike's trick to hide the decline". Mike is Michael Mann, said "hey, trick just means mathematical trick. That's all." My response is I'm not worried about the word trick. I'm worried about the decline."
Muller quotes "Mike's nature trick to hide the decline" as if its Phil Jones's actual words. However, the original text indicates otherwise:
"I’ve just completed Mike’s Nature trick of adding in the real temps to each series for the last 20 years (ie from 1981 onwards) and from 1961 for Keith’s to hide the decline."
It's clear that "Mike's Nature trick" is quite separate to Keith Briffa's "hide the decline". Somehow Jones' original email has morphed into "Mike's nature trick to hide the decline" to the point where even Professor Muller quotes this line as fact.
So what is "Mike's Nature trick"? This refers to a technique (in other words, "trick of the trade") used in a paper published in Nature by lead author Michael Mann (Mann et al 1998). The "trick" is the technique of plotting recent instrumental data along with the reconstructed data. This places recent global warming trends in the context of temperature changes over longer time scales. Here is the original hockey stick graph published in Mann et al 1998:

Figure 2: Northern Hemisphere mean temperature anomaly in °C (Mann et al 1998).
The temperature reconstruction was extended back to 1000 AD and published in Mann et al 1999 which was reproduced in the IPCC Third Assessment Report, shown below:

Figure 3: Northern Hemisphere mean temperature anomaly in °C (Mann et al 1999).
There is nothing secret about "Mike's trick". Both the instrumental and reconstructed temperature are clearly labelled in Mann's 1998 Nature article, the follow-up Mann et al 1999 and the IPCC Third Assessment Report. To claim this is some sort of secret, nefarious "trick", or worse - to confuse this with "hide the decline" - displays either ignorance or a willingness to mislead.
The "decline" has been openly and publicly discussed since 1995
While skeptics like to portray "the decline" as a phenomena that climate scientists' have tried to keep secret, the divergence problem has been publicly discussed in the peer-reviewed literature since 1995 (Jacoby 1995).
In Phil Jones' email, he was discussing a graph for the cover of an obscure 1999 World Meteorological Organisation (WMO) report, which depicted both instrumental temperature data and reconstructed temperatures based on tree rings. The Independent Climate Change Email Review examined the email and the WMO report and made the following criticism of the resulting graph (its emphasis):
[T]he figure supplied for the WMO Report was misleading. We do not find that it is misleading to curtail reconstructions at some point per se, or to splice data, but we believe that both of these procedures should have been made plain — ideally in the figure but certainly clearly described in either the caption or the text. [1.3.2]
But this was one isolated instance that occurred more than a decade ago. The Review did not find anything wrong with the overall picture painted about divergence (or uncertainties generally) in the literature and in IPCC reports. The Review notes that the WMO report in question “does not have the status or importance of the IPCC reports”, and concludes that divergence “is not hidden” and “the subject is openly and extensively discussed in the literature, including CRU papers.” [1.3.2]
How do the IPCC portray the temperature reconstructions of Mann and Briffa? In the 2001 Third Assessment Report (TAR), the Chapter 2 of Working Group 1 (WG1) presented reconstructions from Mann et al. (1999), Jones et al. (1998), and Briffa (2000) in Figure 2.21:
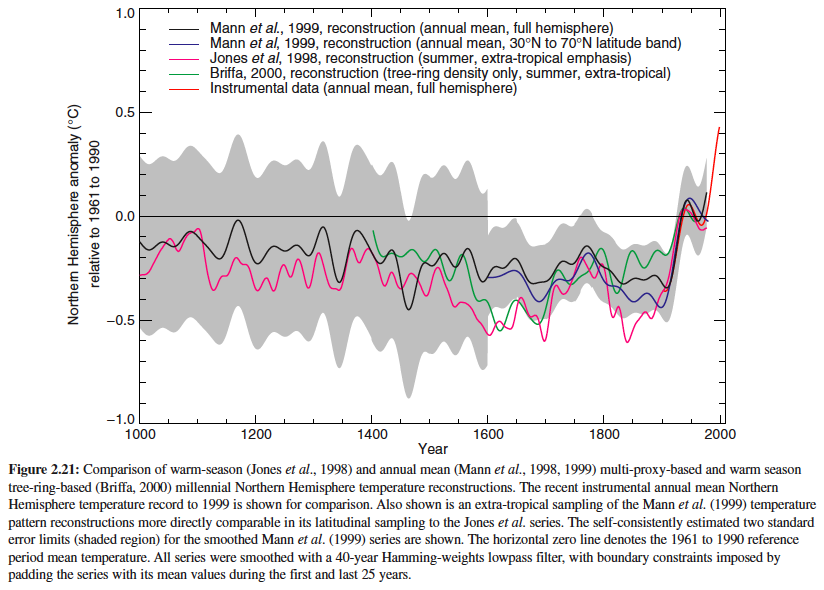
Briffa (2000) included data up to the year 2000, whereas the study's tree ring data presented in this figure is truncated at the year 1960. Section 2.3.2.1 of the IPCC TAR WG1 (Paleoclimate proxy indicators) has a sub-section devoted to a detailed discussion of tree ring data, including the following text (Page 131), emphasis added:
There is evidence, for example, that high latitude tree-ring density variations have changed in their response to temperature in recent decades, associated with possible nonclimatic factors (Briffa et al., 1998a). By contrast, Vaganov et al. (1999) have presented evidence that such changes may actually be climatic and result from the effects of increasing winter precipitation on the starting date of the growing season (see Section 2.7.2.2). Carbon dioxide fertilization may also have an influence, particularly on high-elevation drought-sensitive tree species, although attempts have been made to correct for this effect where appropriate (Mann et al., 1999). Thus climate reconstructions based entirely on tree-ring data are susceptible to several sources of contamination or non-stationarity of response. For these reasons, investigators have increasingly found tree-ring data most useful when supplemented by other types of proxy information in “multi-proxy” estimates of past temperature change (Overpeck et al., 1997; Jones et al., 1998; Mann et al., 1998; 1999; 2000a; 2000b; Crowley and Lowery, 2000).”
This seems like a very clear and explicit discussion of the shortcomings of high latitude tree rings as an accurate temperature proxy over the past several decades, some possible reasons for the divergence, and how the divergence problem should be treated (by supplementing it with other proxies).
As with the TAR, the tree ring proxy data and divergence problem discussion in the IPCC 4th Assessment Report (AR4) is quite detailed and explicit. Below is the relevant discussion from AR4 WG1 Section 6.6.1.1 (Page 472-473), emphasis added:
“Several analyses of ring width and ring density chronologies, with otherwise well-established sensitivity to temperature, have shown that they do not emulate the general warming trend evident in instrumental temperature records over recent decades, although they do track the warming that occurred during the early part of the 20th century and they continue to maintain a good correlation with observed temperatures over the full instrumental period at the interannual time scale (Briffa et al., 2004; D’Arrigo, 2006). This ‘divergence’ is apparently restricted to some northern, high latitude regions, but it is certainly not ubiquitous even there. In their large-scale reconstructions based on tree ring density data, Briffa et al. (2001) specifically excluded the post-1960 data in their calibration against instrumental records, to avoid biasing the estimation of the earlier reconstructions (hence they are not shown in Figure 6.10), implicitly assuming that the ‘divergence’ was a uniquely recent phenomenon, as has also been argued by Cook et al. (2004a). Others, however, argue for a breakdown in the assumed linear tree growth response to continued warming, invoking a possible threshold exceedance beyond which moisture stress now limits further growth (D’Arrigo et al., 2004). If true, this would imply a similar limit on the potential to reconstruct possible warm periods in earlier times at such sites. At this time there is no consensus on these issues (for further references see NRC, 2006) and the possibility of investigating them further is restricted by the lack of recent tree ring data at most of the sites from which tree ring data discussed in this chapter were acquired.”
Again, there is explicit discussion of the divergence problem (even moreso than in the TAR), of its possible causes, and how it should be dealt with scientifically. In this case, the text specifically states that the post-1960 data is excluded from the Briffa et al. (2001) data plotted in Figure 6.10:

The common misconception that scientists tried to hide a decline in global temperatures is false. The decline in tree-ring growth is plainly discussed in the publicly available scientific literature. The divergence in tree-ring growth does not change the fact that we are currently observing many lines of evidence for global warming. The obsessive focus on a short quote, often misquoted and taken out of context, doesn't change the scientific case that human-caused climate change is real.
Updated on 2011-03-15 by John Cook.


THE ESCALATOR

(free to republish)