Climate Science Glossary

Term Lookup

Enter a term in the search box to find its definition.

Settings

Use the controls in the far right panel to increase or decrease the number of terms automatically displayed (or to completely turn that feature off).

Term Lookup

Settings


All IPCC definitions taken from Climate Change 2007: The Physical Science Basis. Working Group I Contribution to the Fourth Assessment Report of the Intergovernmental Panel on Climate Change, Annex I, Glossary, pp. 941-954. Cambridge University Press.

Home Arguments Software Resources Comments The Consensus Project Translations About Support

Bluesky Facebook LinkedIn Mastodon MeWe

Twitter YouTube RSS Posts RSS Comments Email Subscribe


Climate's changed before
It's the sun
It's not bad
There is no consensus
It's cooling
Models are unreliable
Temp record is unreliable
Animals and plants can adapt
It hasn't warmed since 1998
Antarctica is gaining ice
View All Arguments...


Username
Password
New? Register here
Forgot your password?

Latest Posts

Archives

How reliable are climate models?

What the science says...

Select a level... Basic Intermediate

Models successfully reproduce temperatures since 1900 globally, by land, in the air and the ocean.

Climate Myth...

Models are unreliable

"[Models] are full of fudge factors that are fitted to the existing climate, so the models more or less agree with the observed data. But there is no reason to believe that the same fudge factors would give the right behaviour in a world with different chemistry, for example in a world with increased CO2 in the atmosphere."  (Freeman Dyson)

At a glance

So, what are computer models? Computer modelling is the simulation and study of complex physical systems using mathematics and computer science. Models can be used to explore the effects of changes to any or all of the system components. Such techniques have a wide range of applications. For example, engineering makes a lot of use of computer models, from aircraft design to dam construction and everything in between. Many aspects of our modern lives depend, one way and another, on computer modelling. If you don't trust computer models but like flying, you might want to think about that.

Computer models can be as simple or as complicated as required. It depends on what part of a system you're looking at and its complexity. A simple model might consist of a few equations on a spreadsheet. Complex models, on the other hand, can run to millions of lines of code. Designing them involves intensive collaboration between multiple specialist scientists, mathematicians and top-end coders working as a team.

Modelling of the planet's climate system dates back to the late 1960s. Climate modelling involves incorporating all the equations that describe the interactions between all the components of our climate system. Climate modelling is especially maths-heavy, requiring phenomenal computer power to run vast numbers of equations at the same time.

Climate models are designed to estimate trends rather than events. For example, a fairly simple climate model can readily tell you it will be colder in winter. However, it can’t tell you what the temperature will be on a specific day – that’s weather forecasting. Weather forecast-models rarely extend to even a fortnight ahead. Big difference. Climate trends deal with things such as temperature or sea-level changes, over multiple decades. Trends are important because they eliminate or 'smooth out' single events that may be extreme but uncommon. In other words, trends tell you which way the system's heading.

All climate models must be tested to find out if they work before they are deployed. That can be done by using the past. We know what happened back then either because we made observations or since evidence is preserved in the geological record. If a model can correctly simulate trends from a starting point somewhere in the past through to the present day, it has passed that test. We can therefore expect it to simulate what might happen in the future. And that's exactly what has happened. From early on, climate models predicted future global warming. Multiple lines of hard physical evidence now confirm the prediction was correct.

Finally, all models, weather or climate, have uncertainties associated with them. This doesn't mean scientists don't know anything - far from it. If you work in science, uncertainty is an everyday word and is to be expected. Sources of uncertainty can be identified, isolated and worked upon. As a consequence, a model's performance improves. In this way, science is a self-correcting process over time. This is quite different from climate science denial, whose practitioners speak confidently and with certainty about something they do not work on day in and day out. They don't need to fully understand the topic, since spreading confusion and doubt is their task.

Climate models are not perfect. Nothing is. But they are phenomenally useful.

Please use this form to provide feedback about this new "At a glance" section. Read a more technical version below or dig deeper via the tabs above!


Further details

Climate models are mathematical representations of the interactions between the atmosphere, oceans, land surface, ice – and the sun. This is clearly a very complex task, so models are built to estimate trends rather than events. For example, a climate model can tell you it will be cold in winter, but it can’t tell you what the temperature will be on a specific day – that’s weather forecasting. Climate trends are weather, averaged out over time - usually 30 years. Trends are important because they eliminate - or "smooth out" - single events that may be extreme, but quite rare.

Climate models have to be tested to find out if they work. We can’t wait for 30 years to see if a model is any good or not; models are tested against the past, against what we know happened. If a model can correctly predict trends from a starting point somewhere in the past, we could expect it to predict with reasonable certainty what might happen in the future.

So all models are first tested in a process called Hindcasting. The models used to predict future global warming can accurately map past climate changes. If they get the past right, there is no reason to think their predictions would be wrong. Testing models against the existing instrumental record suggested CO2 must cause global warming, because the models could not simulate what had already happened unless the extra CO2 was added to the model. All other known forcings are adequate in explaining temperature variations prior to the rise in temperature over the last thirty years, while none of them are capable of explaining the rise in the past thirty years.  CO2 does explain that rise, and explains it completely without any need for additional, as yet unknown forcings.

Where models have been running for sufficient time, they have also been shown to make accurate predictions. For example, the eruption of Mt. Pinatubo allowed modellers to test the accuracy of models by feeding in the data about the eruption. The models successfully predicted the climatic response after the eruption. Models also correctly predicted other effects subsequently confirmed by observation, including greater warming in the Arctic and over land, greater warming at night, and stratospheric cooling.

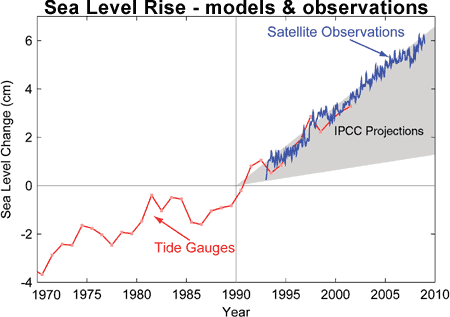
The climate models, far from being melodramatic, may be conservative in the predictions they produce. Sea level rise is a good example (fig. 1).

Fig. 1: Observed sea level rise since 1970 from tide gauge data (red) and satellite measurements (blue) compared to model projections for 1990-2010 from the IPCC Third Assessment Report (grey band).  (Source: The Copenhagen Diagnosis, 2009)

Here, the models have understated the problem. In reality, observed sea level is tracking at the upper range of the model projections. There are other examples of models being too conservative, rather than alarmist as some portray them. All models have limits - uncertainties - for they are modelling complex systems. However, all models improve over time, and with increasing sources of real-world information such as satellites, the output of climate models can be constantly refined to increase their power and usefulness.

Climate models have already predicted many of the phenomena for which we now have empirical evidence. A 2019 study led by Zeke Hausfather (Hausfather et al. 2019) evaluated 17 global surface temperature projections from climate models in studies published between 1970 and 2007.  The authors found "14 out of the 17 model projections indistinguishable from what actually occurred."

Talking of empirical evidence, you may be surprised to know that huge fossil fuels corporation Exxon's own scientists knew all about climate change, all along. A recent study of their own modelling (Supran et al. 2023 - open access) found it to be just as skillful as that developed within academia (fig. 2). We had a blog-post about this important study around the time of its publication. However, the way the corporate world's PR machine subsequently handled this information left a great deal to be desired, to put it mildly. The paper's damning final paragraph is worthy of part-quotation:

"Here, it has enabled us to conclude with precision that, decades ago, ExxonMobil understood as much about climate change as did academic and government scientists. Our analysis shows that, in private and academic circles since the late 1970s and early 1980s, ExxonMobil scientists:

(i) accurately projected and skillfully modelled global warming due to fossil fuel burning;

(ii) correctly dismissed the possibility of a coming ice age;

(iii) accurately predicted when human-caused global warming would first be detected;

(iv) reasonably estimated how much CO2 would lead to dangerous warming.

Yet, whereas academic and government scientists worked to communicate what they knew to the public, ExxonMobil worked to deny it."
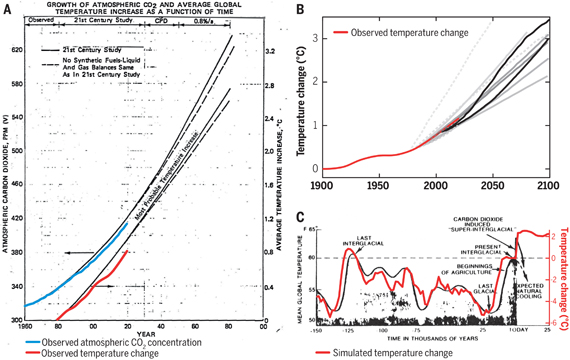

Exxon climate graphics from Supran et al 2023

Fig. 2: Historically observed temperature change (red) and atmospheric carbon dioxide concentration (blue) over time, compared against global warming projections reported by ExxonMobil scientists. (A) “Proprietary” 1982 Exxon-modeled projections. (B) Summary of projections in seven internal company memos and five peer-reviewed publications between 1977 and 2003 (gray lines). (C) A 1977 internally reported graph of the global warming “effect of CO2 on an interglacial scale.” (A) and (B) display averaged historical temperature observations, whereas the historical temperature record in (C) is a smoothed Earth system model simulation of the last 150,000 years. From Supran et al. 2023.

 Updated 30th May 2024 to include Supran et al extract.

Various global temperature projections by mainstream climate scientists and models, and by climate contrarians, compared to observations by NASA GISS. Created by Dana Nuccitelli.

Last updated on 30 May 2024 by John Mason. View Archives

Printable Version  |  Offline PDF Version  |  Link to this page

Argument Feedback

Please use this form to let us know about suggested updates to this rebuttal.

Further reading

Carbon Brief on Models

In January 2018, CarbonBrief published a series about climate models which includes the following articles:

Q&A: How do climate models work?
This indepth article explains in detail how scientists use computers to understand our changing climate.

Timeline: The history of climate modelling
Scroll through 50 key moments in the development of climate models over the last almost 100 years.

In-depth: Scientists discuss how to improve climate models
Carbon Brief asked a range of climate scientists what they think the main priorities are for improving climate models over the coming decade.

Guest post: Why clouds hold the key to better climate models
The never-ending and continuous changing nature of clouds has given rise to beautiful poetry, hours of cloud-spotting fun and decades of challenges to climate modellers as Prof Ellie Highwood explains in this article.

Explainer: What climate models tell us about future rainfall
Much of the public discussion around climate change has focused on how much the Earth will warm over the coming century. But climate change is not limited just to temperature; how precipitation – both rain and snow – changes will also have an impact on the global population.

Update

On 21 January 2012, 'the skeptic argument' was revised to correct for some small formatting errors.

Denial101x videos

Here are related lecture-videos from Denial101x - Making Sense of Climate Science Denial

Additional video from the MOOC

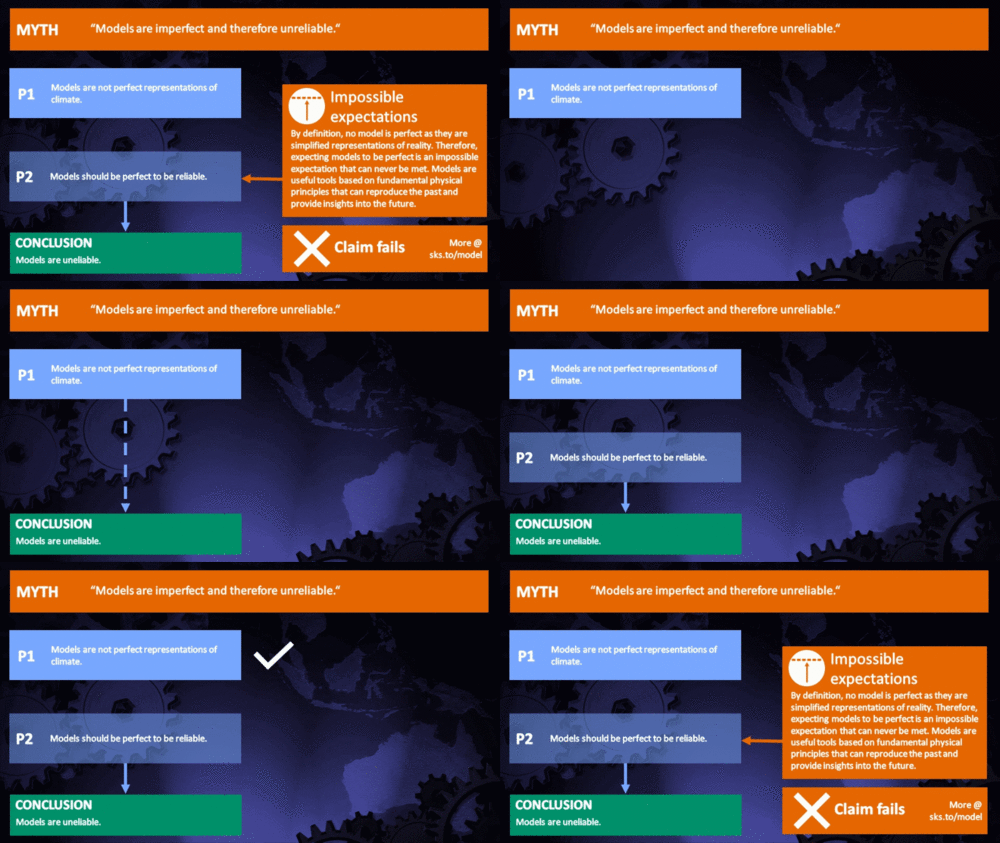
Dana Nuccitelli: Principles that models are built on.

Myth Deconstruction

Related resource: Myth Deconstruction as animated GIF

MD Model

Please check the related blog post for background information about this graphics resource.

Fact brief

Click the thumbnail for the concise fact brief version created in collaboration with Gigafact:

fact brief

Comments

Prev  1  2  3  4  5  6  7  8  9  10  11  12  13  14  15  16  17  18  19  Next

Comments 351 to 375 out of 469:

  1. #354 CBDunkerson at 19:22 PM on 1 May, 2011 we are instead currently seeing accumulation of heat in both hemispheres No, we are currently not seeing anything like that. Rate of heat accumulation in the upper 700 m of oceans in 2003-2010 (when it is measured properly by ARGO) is 5.5±6.5×10²⁰ J/year. That is, it's flat. Even if we go with the upper bound (12×1020 J/year), it takes 900 years to warm up this layer by 1°C, which is a warming rate of 0.11°C/century. However, it is entirely possible that the upper ocean is actually losing heat. Note that rate of change in surface temperatures in general can't be far removed from rate of upper ocean heating, as heat capacity of oceans is three orders of magnitude higher than that of the atmosphere. We also have (rather low quality) data for 1955-2010. If we take it on face value and believe the error bars provided by Levitus et al. are correct, average rate of heat accumulation in the upper ocean during this 56 year period is 25.3±0.5×10²⁰ J/year. At this rate it takes at least 450 years to heat it up by 1°C, which is 0.22°C/century. It is much smaller than the alleged late 20th century warming rate of the surface, so that could only be a transient phenomenon mostly due to redistribution of heat in the climate system (and also failure in properly taking into account local warming close to land based measurement sites due to land use changes - a.k.a. UHI).
  2. 353, trunkmonkey, See here and here for info on models. In particular, last section of the first link is titled "Can I use a climate model myself?".
  3. "I care deeply about this. It may be the defining issue of our time." How about reading Ch6 (Paleoclimate) of the WG1 then? I think you will find what want in the referenced papers. Nature of DO's. Well DO events appear to only have strong climatic effect when exiting a glacial. Its not the adding of CO2 that changes things but loss of the ice sheet. Candidates for Bond/Heinrich/DO events - solar and changes to thermohaline circulation. Any of those happening to explain the current warming? Nope.
  4. 354. I was rounding up. The models are initialized at 280ppm in 1750 or whatever, but humans have been burning since fire was domesticated. How much CO2 would you figure was released by the burning of the European oak forest (much of it to slake lime)? It is believed neolithic (and probably paleolithic) hunters routinely set uncontrolled fires to promote savannah at the expense of forest and chapparal. DO/Bond Don't you expect some surface cooling with the fresh meltwater that won't sink? Isn't this heat redistrubution? Why is the Atlantic deepwater way more oxygenated than the Pacific?
    Response: [DB] As for your first part, if I see where you're going with that, you should look into Ruddiman's Hypothesis. Ruddiman himself has a recent (and still active) thread over at Real Climate where Ruddiman has been answering questions.
  5. "Don't you expect some surface cooling with the fresh meltwater that won't sink? Isn't this heat redistrubution?" That would be why DO have climate effects coming out of interglacial but not now?
  6. trunkmonkey wrote: "How much CO2 would you figure was released by the burning of the European oak forest (much of it to slake lime)?" First, I don't see how this is relevant to CO2 levels in the models... given that those are based on measured atmospheric CO2 values, CO2 levels in air bubbles in ice cores, and various proxies. Second, you are ignoring the other half of the equation... when you burn down forestland you get grassland or cropland. All that new vegetation needs alot of carbon... which it gets from the atmosphere. The net effect is very little change in atmospheric CO2... though Ruddiman and others have suggested that the ~20 ppm rise over the ~8000 years prior to the industrial revolution was due to such 'land use' changes.
  7. scaddenp 359: "That would be why DO have climate effects coming out of interglacial but not now?" Does the system really care about glacial/interglacial stage? Isn't meltwater, meltwater, whenever it ocurrs? If our efforts have accelerated the melting, does it matter that the triple net Milankovitch "forcings" languish in the future? Berenyi Peter, 355., is saying that he sees no SST increase. (Alley 2005) has an interesting discussion of this. He states that several models predict meltwater, but that the results are equivocal.
  8. 360. The signature of the burning must be included in the ice cores, so I concede this, except for the possibility that the models are initialized a bit too high. Mizmi is the real expert but grasses are C4 plants adapted to the declining CO2 levels of the Pleiocene. They use less CO2 that the forest they replace.
  9. "Isn't meltwater, meltwater," Volume matters. At end of glacial, you have large amount of ice to melt below the arctic circle. The issue of interest for now wrt to sealevel rates, is that rate of warming is far higher than exiting a glacial but amount of ice available to melt is far less. As to BP, look at the data yourself. As to role of meltwater - this is unsettled science. There is good evidence of disturbance to thermahaline cycle and ditto for solar forcing. What causes the disturbance, relationships and timing is not settled. If you are really interested, read Wally Broecker on the subject. Relevance to now? Well no solar forcing and no disturbance to thermahaline cycle detected as possible causes of warming.
  10. 363. We established a while back that we know nothing at a decadal scale because the models can't resolve the irregular and powerful influenses of the ocean sloshings; ENSO, PDO, AMO, IOD (It's almost like Lake Tahoe must have a dipole as well). These influences are stronger than the expected warming so we could concievably have a decade of cooling or a decade of warming much greater than the models predict and it would mean nothing (except politically). The implication of DO/meltwater is profound, because if it is internally driven, we might not know anytinig at a centennial or millenial scale either.
  11. trunkmonkey - So, a little uncertainty, and we know nothing? That's not a reasonable statement, trunkmonkey. I don't think that's been established anywhere. Tamino has demonstrated how to look at ENSO and other local variations, and remove their influence. The results? The warming we expect from the CO2 we've added, at the trends we expect from the physics. A wee uncertainty is reason for resolving how much we know despite the uncertainty, not reason for throwing up our hands and giving up. That said, an overturning of the thermohaline circulation due to increased fresh water would be a large change in climate state. But that hasn't happened for a long time, and won't happen unless due to our influence, barring major changes in natural forcings which are well out of what we've seen in millenia.
  12. Slight difference. We can't predict ENSO, PDO,AMO in models. These internal variabilities exist in models. You can certainly run a model and get PDO index out of it. However, you cant initialise a model to predict them. I don't of any paper which puts a case for DO being internally driven. Do you? Everything has physical causes.
  13. trunkmonkey#364: "we know nothing at a decadal scale" We know this at a decadal scale: Global temperatures are increasing at ~0.15C/decade; northern hemisphere temperatures at 0.3-0.5C/decade. We know of no reasons why that will decrease anytime soon.
  14. trunkmonkey wrote: "The implication of DO/meltwater is profound, because if it is internally driven, we might not know anytinig at a centennial or millenial scale either." Again, this would be observed as a transfer of 'heat' from one hemisphere to the other. Yet all records (i.e. surface thermometers, ocean water temps, satellite readings, et cetera) show that both hemispheres have been warming. Ergo, the observed warming is unquestionably NOT D-O related. And ditto ENSO, PDO, et cetera. These are all examples of energy moving around within the climate system... whereas what we have observed over the past 100 years or so is an increase in energy throughout every part of the climate system. Essentially, your argument is the equivalent of saying that if you pour a gallon of water into multiple different containers it can turn into two gallons of water. In reality it doesn't matter how much you move the water (or heat) around... the amount doesn't change.
  15. "I have seen many projections of the models into the future. You claim that the models are hindcast, but I have never seen a graphic to demonstrate." Running a full climate model over 800,000 years or so? Um. That would be tricky so you need simplication. More common to do full runs for specific period of interest like LGM, PETM, YD etc. Again, IPCC WG1 is place for the references. You could see the Hansen and Sato for a much simpler calculation covering last 800,000 years.
  16. Here some new stuff about climate models. According a paper from J.Hansen, M.Sato and P.Kharecha most IPCC models and GISS modelE-R mix heat too efficiëntly downward through the oceans. The result is that models respond slower on forcings as the real world does. On page 18 in Hansen et al 2011 I read "Below we argue that the real world response function is faster than that of modelE-R. We also suggest that most global climate models are similarly too sluggish in their response to a climate forcing and that this has important implications for anticipated climate change." Adjustments towards less ocean heat uptake are in better agreement with observed OCH trends. Despite the slow response IPCC models do a good job in mimicing global warming. The IPCC underestimates aërosol cooling effects and some models have too large GHG forcings according Hansen. Since the oceans are NOT the favourable place for large antropogenic aërosol influences the answer may be quite more simple: Climate models are too sensitive to GHG (and other forcings) and thus OVERestimate AGW. You can read more about this in chapter 5 t/m 7 of the paper.(Excuse me if this subject is discussed before).
  17. KR 365. The models are unable to make specific predictions at a decadal scale to be contradicted or confirmed, except that it will be warmer at the end.Various alternative celestial and cyclical hypotheses are likewise untestable at a decadal scale. Those who wait breathlessly for yearly GAT data are making essentially the same mistake as one who guages global warming by his backyard thermometer.
  18. CBDunkerson 368. I don't see THC as hemispheric balancing. The Antarctic has plenty of cold salty water. Some say it even undercuts the Atlantic bottom water. I would describe the THC as an Antarctic beltway, both bottom and surface water, with three feed loops into the Pacific, Atlantic, and Inian Oceans. It balances overall ocean temperature by cooling the Pacific and Indian Oceans and warming the Atlantic, the only ocean directly connected to Arctic bttom water. I am not trying to reconstruct Singer and Avery.They have done that ably, and it is interesting, but I am tired of the notion that adding CO2 does NOTHING. It would be nice if we could get a model to reproduce the Younger Dryas or the 8.2ky event by adding meltwater. My suggestion: try it again with the CO2 knob backed off.
  19. Trunkmonkey - try Wally Was Right, Alley 2007. I have extremely limited internet access at moment, so hard to further. I dont really understand what you mean by "CO2 knob" backed off. Firstly, YD is too fast for CO2 feedback to be much of a factor. Secondly, all CO2 does in a model is change radiative forcing. I dont think there is an Ar4 model that could realistically predict CO2 change as a feedback - can only feed in what actually happened.
  20. trunkmonkey #372: There is a well documented hemispheric see-saw to DO events... whether you see it or not. In any case, your description of "cooling the Pacific and Indian Oceans and warming the Atlantic" is just fine for making my point too... because the Pacific and Indian Oceans did not cool over the course of the 20th century. They warmed. Just like every other ocean on the planet. Total ocean heat content increased. Total atmospheric heat content increased. Ergo, none of these changes can be put down to 'internal variability'... because that would require decreasing temperatures somewhere else and there just isn't any data showing that.
  21. CBDunkerson 374. Perturbing the THC by jumping on one end and finding the other end rises does not mean that DO events funtion to balance hemispheric temperatures. I see your point that universally higher SST's would contraindicate DO as an explanation for current warming. Bear in mind that the deep water now upwelling is very old. Much of it emerging now began sinking during the Medieval Warm Period as the Vikings sacked England, and some may be 1600 years old. There is a lot of cold salty water in that pipeline that is insulated from warming at the surface.
  22. scaddenp 373. Thanks for the Wally link. That is a very impressive paper. The models get the jist of the YD but they don't relicate it's full amplitude. From what little progress I have made in the decade of study you guys have prescribed I've gleaned that models have their own logic when they find a stable sweet spot. You guys know better than anyone that when you do certain things the model gets crazy and runs out of bounds like a kid who's eaten too much candy. So we have this happy model that refuses to reproduce the amplitude of YD by adding a reasonable amount of meltwater. Models have a good track record in these situations. So either the proxy data are wrong, there is anther stable point the model should be initialized at, or another unknown factor is contributing. I still do not understand exactly how CO2 works in the models. I played with the edgcm model but all it will let me do is imput a ppm for CO2. In the idealized model in my mind I would be able to right click on CO2 an pull up its properties. A screen would pop up showing all the relationships for CO2 and the values applied to these relationships. For example the absorbtion of outgoing IR would show a relationship to air temperature at 6 w/m^2 or so and there would be diminishing relationships to soil, ocean and plant sequestration, an exaggerating relation to temperature as it feeds back to increased microbial activity, etc. My suggestion on the control knob is to back off these values to bare bones. Can YD be too fast for CO2 if sucking 380 ppm of it out of the atmosphere today would drop GAT 6 degrees in a year?
  23. Truckmonkey, you are missing the CO2 handle. Firstly, in paleoclimate CO2 is ONLY a feedback. It responds to temperature and amplifies whatever else is happening to temperature by changing the radiative forcing. There are two things to note about this. 1/ The CO2 feedbacks are SLOW. They are thought to have minimal if any effect over climate in next century. This is NOT to say that the effect of CO2 forcing is slow - only that the change in concentration of CO2 in the atmosphere in response to temperature is slow. When CO2 concentration does change, then the effect in instantaneous more or less. 2/ Most AR4 models dont even consider the CO2 feedback. AR5 will, but with what skill? For paleoclimate, studies do have to consider that. However, at every time step in the model, you have to know boundary conditions. One of these is CO2 concentration in atmosphere. Now to determine climate in say 2-300 years, you would need to what the CO2 concentration is. You have do this with a combination of both scenario - how CO2 are humans likely to emit - and a carbon cycle model - how much will CO2 change due to temperature rise. For paleoclimate though, you dont have to have a carbon-cycle model at all. You can just put in the CO2 concentration at that time. Of course if you are trying to understand what happens to carbon cycle, then you need model, but my understanding is these are so far somewhat unconstrained - there are many ways to reproduce the CO2 response to temperature change without so far easy ways to favour one versus the other. You comment on models parameter implies you really need to study how these models work. The only thing in climate model that changes with CO2 concentration is the radiative forcing. There is no link in the code between that and the other factors you mention (which are mostly carbon cycle model parameters and not in models for reasons above). Climate models get complicated by feedback and this is related to temperature, not directly to CO2. There is no control knob in the model like you imply to "turn down". Alley comments are an observation about what model imply, not a description of the model.
  24. I think, many problems concerning the value of numerical prediction arise from the term "precise". It is widely used here in a binary manner as an all-or-nothing gauge. It would be much better to talk about probabilities and ranges. Concerning the comparison of complex simulation models with polynomials: it is right, that both, because of input data uncertainty ranges, have to be fitted to the past. But in the physical models is so much more information integrated about how the world works, that common sense tells us, that their result is (again probability!) most probably more reliable than a simple polynomial. I am a physicist - I don't pretend to understand every intricacy of climate science though. But that all model output is invalid because of software bugs seems (again!) improbable to me. The models deliver results with a limited precision. But their imprecision is unknown and may lie in either direction. So for me their results represent the center of probability according to the information available. All the more as they are in line with the common sense argument, that if you put in more energy than you let get out, the thing becomes warmer. (- Yes, I know, it's the degree of warming that is disputed. If you want to estimate the degree, you start calculating, and end up at - surprise - numerical models.) And a global AGW conspiracy - seems (again probability!) not very probable to me.
  25. Does anyone have any comments on the following paper? R. Fildes and N. Kourentzes, Validation and forecasting accuracy in models of climate change, Working Paper

Prev  1  2  3  4  5  6  7  8  9  10  11  12  13  14  15  16  17  18  19  Next

Post a Comment

Political, off-topic or ad hominem comments will be deleted. Comments Policy...

You need to be logged in to post a comment. Login via the left margin or if you're new, register here.

Link to this page


The Consensus Project Website

THE ESCALATOR

(free to republish)


© Copyright 2024 John Cook
Home | Translations | About Us | Privacy | Contact Us