Climate Science Glossary

Term Lookup

Enter a term in the search box to find its definition.

Settings

Use the controls in the far right panel to increase or decrease the number of terms automatically displayed (or to completely turn that feature off).

Term Lookup

Settings


All IPCC definitions taken from Climate Change 2007: The Physical Science Basis. Working Group I Contribution to the Fourth Assessment Report of the Intergovernmental Panel on Climate Change, Annex I, Glossary, pp. 941-954. Cambridge University Press.

Home Arguments Software Resources Comments The Consensus Project Translations About Support

Bluesky Facebook LinkedIn Mastodon MeWe

Twitter YouTube RSS Posts RSS Comments Email Subscribe


Climate's changed before
It's the sun
It's not bad
There is no consensus
It's cooling
Models are unreliable
Temp record is unreliable
Animals and plants can adapt
It hasn't warmed since 1998
Antarctica is gaining ice
View All Arguments...


Username
Password
New? Register here
Forgot your password?

Latest Posts

Archives

Working out climate sensitivity from satellite measurements

What the science says...

Lindzen's analysis has several flaws, such as only looking at data in the tropics. A number of independent studies using near-global satellite data find positive feedback and high climate sensitivity.

Climate Myth...

Lindzen and Choi find low climate sensitivity

Climate feedbacks are estimated from fluctuations in the outgoing radiation budget from the latest version of Earth Radiation Budget Experiment (ERBE) nonscanner data. It appears, for the entire tropics, the observed outgoing radiation fluxes increase with the increase in sea surface temperatures (SSTs). The observed behavior of radiation fluxes implies negative feedback processes associated with relatively low climate sensitivity. This is the opposite of the behavior of 11 atmospheric models forced by the same SSTs. (Lindzen & Choi 2009)

Climate sensitivity is a measure of how much our climate responds to an energy imbalance. The most common definition is the change in global temperature if the amount of atmospheric CO2 was doubled. If there were no feedbacks, climate sensitivity would be around 1°C. But we know there are a number of feedbacks, both positive and negative. So how do we determine the net feedback? An empirical solution is to observe how our climate responds to temperature change. We have satellite measurements of the radiation budget and surface measurements of temperature. Putting the two together should give us an indication of net feedback.

One paper that attempts to do this is On the determination of climate feedbacks from ERBE data (Lindzen & Choi 2009). It looks at sea surface temperature in the tropics (20° South to 20° North) from 1986 to 2000. Specifically, it looked at periods where the change in temperature was greater than 0.2°C, marked by red and blue colors (Figure 1).
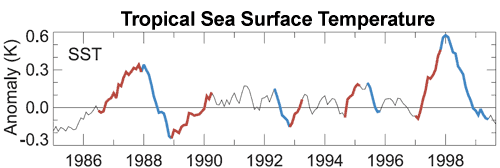

Figure 1: Monthly sea surface temperature for 20° South to 20° North. Periods of temperature change greater than 0.2°C marked by red and blue (Lindzen & Choi 2009).

Lindzen et al also analysed satellite measurements of outgoing radiation over these periods. As short-term tropical sea surface temperatures are largely driven by the El Nino Southern Oscillation, the change in outward radiation offers an insight into how climate responds to changing temperature. Their analysis found that when it gets warmer, there was more outgoing radiation escaping to space. They concluded that net feedback is negative and our planet has a low climate sensitivity of about 0.5°C.

Debunked by Trenberth

However, a response to this paper, Relationships between tropical sea surface temperature and top-of-atmosphere radiation (Trenberth et al 2010) revealed a number of flaws in Lindzen's analysis. It turns out the low climate sensitivity result is heavily dependent on the choice of start and end points in the periods they analyse. Small changes in their choice of dates entirely change the result. Essentially, one could tweak the start and end points to obtain any feedback one wishes.
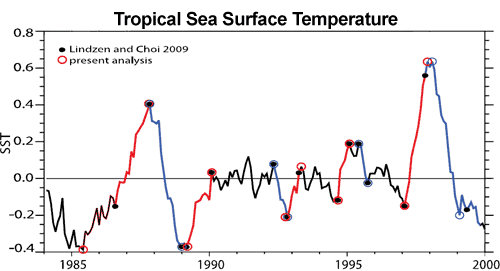

Figure 2: Warming (red) and cooling (blue) intervals of tropical SST (20°N – 20°S) used by Lindzen & Choi (2009) (solid circles) and an alternative selection proposed derived from an objective approach (open circles) (Trenberth et al 2010).

Debunked by Murphy

Another major flaw in Lindzen's analysis is that they attempt to calculate global climate sensitivity from tropical data. The tropics are not a closed system - a great deal of energy is exchanged between the tropics and subtropics. To properly calculate global climate sensitivity, global observations are required.

This is confirmed by another paper published in early May (Murphy 2010). This paper finds that small changes in the heat transport between the tropics and subtropics can swamp the tropical signal. They conclude that climate sensitivity must be calculated from global data.

Debunked by Chung

In addition, another paper reproduced the analysis from Lindzen & Choi (2009) and compared it to results using near-global data (Chung et al 2010). The near-global data find net positive feedback and the authors conclude that the tropical ocean is not an adequate region for determining global climate sensitivity.

Debunked by Dessler

Dessler (2011) found a number of errors in Lindzen and Choi (2009) (slightly revised as Lindzen & Choi (2011)).  First, Lindzen and Choi's mathematical formula  to calculate the Earth's energy budget may violate the laws of thermodynamics - allowing for the impossible situation where ocean warming is able to cause ocean warming.  Secondly, Dessler finds that the heating of the climate system through ocean heat transport is approximately 20 times larger than the change in top of the atmosphere (TOA) energy flux due to cloud cover changes.  Lindzen and Choi assumed the ratio was close to 2 - an order of magnitude too small.

Thirdly, Lindzen and Choi plot a time regression of change in TOA energy flux due to cloud cover changes vs. sea surface temperature changes.  They find larger negative slopes in their regression when cloud changes happen before surface temperature changes, vs. positive slopes when temperature changes happen first, and thus conclude that clouds must be causing global warming.

However, Dessler also plots climate model results and finds that they also simulate negative time regression slopes when cloud changes lead temperature changes.  Crucially, sea surface temperatures are specified by the models.  This means that in these models, clouds respond to sea surface temperature changes, but not vice-versa.  This suggests that the lagged result first found by Lindzen and Choi is actually a result of variations in atmospheric circulation driven by changes in sea surface temperature, and contrary to Lindzen's claims, is not evidence that clouds are causing climate change, because in the models which successfully replicate the cloud-temperature lag, temperatures cannot be driven by cloud changes.

2011 Repeat

Lindzen and Choi tried to address some of the criticisms of their 2009 paper in a new version which they submitted in 2011 (LC11), after Lindzen himself went as far as to admit that their 2009 paper contained "some stupid mistakes...It was just embarrassing."  However, LC11 did not address most of the main comments and contradictory results from their 2009 paper.

Lindzen and Choi first submitted LC11 to the Proceedings of the National Academy of Sciences (PNAS) after adding some data from the Clouds and the Earth’s Radiant Energy System (CERES).

PNAS editors sent LC11 out to four reviewers, who provided comments available here.  Two of the reviewers were selected by Lindzen, and two others by the PNAS Board.  All four reviewers were unanimous that while the subject matter of the paper was of sufficient general interest to warrant publication in PNAS, the paper was not of suitable quality, and its conclusions were not justified.  Only one of the four reviewers felt that the procedures in the paper were adequately described. 

As PNAS Reviewer 1 commented,

"The paper is based on...basic untested and fundamentally flawed assumptions about global climate sensitivity"

These remaining flaws in LC11 included:

  • Assuming that that correlations observed in the tropics reflect global climate feedbacks.
  • Focusing on short-term local tropical changes which might not be representative of equilibrium climate sensitivity, because for example the albedo feedback from melting ice at the poles is obviously not reflected in the tropics.
  • Inadequately explaining methodology in the paper in sufficient detail to reproduce their analysis and results.
  • Failing to explain the many contradictory results using the same or similar data (Trenberth, Chung, Murphy, and Dessler).
  • Treating clouds as an internal initiator of climate change, as opposed to treating cloud changes solely as a climate feedback (as most climate scientists do) without any real justification for doing so. 

As a result of these fundamental problems, PNAS rejected the paper, which Lindzen and Choi subsequently got published in a rather obscure Korean journal, the Asia-Pacific Journal of Atmospheric Science. 

Wholly Debunked

A full understanding of climate requires we take into account the full body of evidence. In the case of climate sensitivity and satellite data, it requires a global dataset, not just the tropics. Stepping back to take a broader view, a single paper must also be seen in the context of the full body of peer-reviewed research. A multitude of papers looking at different periods in Earth's history independently and empirically converge on a consistent answer - climate sensitivity is around 3°C implying net positive feedback.

Last updated on 6 July 2012 by dana1981. View Archives

Printable Version  |  Offline PDF Version  |  Link to this page

Argument Feedback

Please use this form to let us know about suggested updates to this rebuttal.

Further viewing

Andrew Dessler explains in relatively simple and short terms the results from his 2011 paper:

Comments

Prev  1  2  3  4  5  6  7  8  9  10  11  12  13  14  15  16  17  18  19  

Comments 451 to 457 out of 457:

  1. dana1981 - Yep, the reviewers (including #4, added when Lindzen complained about the others) really ripped it up. I have seen a pre-print of it from last year, and from the reviewer comments it hasn't changed much. Quite horrid, to tell the truth. Still using the x2 extension of tropical effects to global, ERBE data rather than CERES, no attention to extra-tropic heat transport, and high sensitivity to the apparently cherry-picked start/end dates. There's a thread on this at WUWT, which is where I found they had finally managed to get it published. In a Korean English language journal where it's off-topic. Sad...
  2. Peer review working properly, judging by the consistency of the four reviewers comments.
  3. Funny. I was just in a battle with some guy on one of Peter Sinclair's videos and be brought up LC09 as proof of low climate sensitivity. He's been trying to change the subject ever since. The PNAS rejection is perfect. One reviewer mentions there are two other responses to LC09 but I've never seen those. I only know Trenberth 2010.
  4. Rob H - see here for references to all three KR - since you mentioned it, I'm surprised Lindzen didn't go for E&E!
  5. Rob Honeycutt - I've also seen Chung 2010 and Murphy 2010 referred to in this context. Both are rather serious critiques of L&C 2009.
  6. dana1981 - I suspect that E & E has a sufficiently bad reputation that they didn't consider it.
  7. For completeness on the Lindzen and Choi papers: LC11 PNAS rejected submission here. LC11 APJAS (in print) here. Some small differences, an additional 3 pages in the APJAS version (it apparently hit the PNAS size limitations). IMO - Lacking in sensitivity analysis for start/end dates of their temperature changes (cf. Trenberth 2010), extratropical heat exchange armwaved and asserted to be unity, etc. It's essentially LC09 with some added (and IMO fairly weak) explanatory text, no accounting for how the critiques pointed out contradictions with actual observations.
  8. And still no one can explain why GHG ‘forcing’ will be amplified by over 400% when solar forcing is only amplified by about 60%. Yet they vehemently object to a negative feedback of about 40% from Lindzen and Choi. I think the peer review process is broken.
  9. RW1 @458 the first thing that needs explaining is that your statement is simply false. The expected change in mean global surface temperature from a 2% change in total solar irradiance (an approx 4 W/m^2 change in solar forcing) is about 3 degrees C, just as with the approx 4 W/m^2 change in forcing from doubling CO2. The second thing that needs explaining is the nature of your error. It is very simple, you are comparing the marginal climate feedback of CO2 forcing, ie, the incremental change in net Top of Atmosphere Irradiance given current temperatures and conditions with the average climate feedback of solar forcing, ie, the integral of the marginal climate feedback over the whole range of TSI values, from 0 to approx 1366. If we were to perform an impossible experiment and set TSI to zero and allow the temperature of the Earth to reach equilibrium, the equilibrium temperature would be approximately 4 degrees K. The Earth would have no atmosphere, for it would have condensed and frozen on the surface, hence it would have no greenhouse effect. Increasing TSE gradually, for a long time the surface radiation would rise proportionally to the change in TSI, as the Earth would not be warm enough for ice to melt and atmosphere to form. Hence there would be no feedbacks. After a while a thin atmosphere would form, but an atmosphere without any CO2. The albedo would probably start to rise at this time as the sun started producing visible radiation (which is reflected by ice) rather than just radio an IR radiation (which is not). Whether the net feedback would be positive (because of atmospheric redistribution of heat) or negative (because of the increasing albedo) would not be determinable without detailed modelling. Regardless. over this period the net feedback would be close to zero, so surface radiation would rise approximately with increasing TSI. As the TSI increases still further, till it approaches more modern values (and reaches values it has never been lower than in the last 4.5 billion years), CO2 will enter the atmosphere and the surface radiation will finally start increasing faster than the increase in TSI. (The OLR at the TOA of course, will continue to increase with TSI). Eventually, the equatorial snow and ice will start to melt, and with a declining albedo, surface radiation will rise still faster relative to TSI. When the Earth reaches that stage, it will flip from the snowball Earth configuration, and for the first time climate sensitivity will approximate to modern values, as it has for the last 500 million years. Because you are comparing the modern feedback factor (for both solar and GHG forcings) with the average of the solar forcings for all values of TSI, you claim an inconsistency - but the only inconsistency is yours. It is the same inconsistency found any those fool enough to claim that somebody else on the same income is getting a special deal from the tax office because that persons average tax rate is less than their own marginal tax rate.
  10. Tom, I didn't know you were still talking to me. Actually though, L&C is operating under the assumption of an 'intrinsic' 2xCO2 temperature increase of 1.1 C with the negative feedback reducing this to about 0.6-0.8 C. I was referring to the direct warming of 3.7 W/m^2 from S-B of 0.7 C, which if it were to become 3 C needs to be increased by over 400% (3.0/0.7 = 4.28).
  11. Tom, "RW1 @458 the first thing that needs explaining is that your statement is simply false. The expected change in mean global surface temperature from a 2% change in total solar irradiance (an approx 4 W/m^2 change in solar forcing) is about 3 degrees C, just as with the approx 4 W/m^2 change in forcing from doubling CO2. The second thing that needs explaining is the nature of your error. It is very simple, you are comparing the marginal climate feedback of CO2 forcing, ie, the incremental change in net Top of Atmosphere Irradiance given current temperatures and conditions with the average climate feedback of solar forcing, ie, the integral of the marginal climate feedback over the whole range of TSI values, from 0 to approx 1366." What is so unique about the next 3.7 W/m^2 that it is reasonable to think the system will respond to it so much greater than the original 342 W/m^2 from the Sun, which is only amplified by about 14% at the surface (390/342 = 1.14)? You should also explain why it doesn't take more like 1534 W/m^2 at the surface to offset the 342 W/m^2 from the Sun (16.6/3.7)*342 = 1534.
  12. RW1, 1) I really don't care what Lindzen and Choi have to say. They have amply proved that what ever it is that they are doing, it is not science. 2) The total insolation is reduced by albedo, so the "amplification factor" (aka, the greenhouse effect) is 62.5% at the surface, not 14%. 3) Given that you wish to run your specious argument, one wonders why you don't run it with regard to Lindzen and Choi's paper. On that basis you would expect a climate response to doubling of CO2 of at least 1.2 *1.625 = 1.95 degrees, which is close enough to the IPCC range, and large enough to mean that anthropogenic emissions are dangerous. In fact, that you do not apply it in that way suggest that you are either disingenuous in presenting the argument, or disingenuous in insisting on a low climate sensitivity. 4) Finally, I have already answered your question in 461, or are you also going to pretend that you cannot understand the difference between a marginal and an average rate?
  13. Tom, RE: 2) You said that a doubling of CO2 was equal to about a 4 W/m^2 increase in solar irradiance, which is why I used those numbers. I always assumed the 3.7 W/m^2 was equal to post albedo solar power, which is amplified by about 63% (390/240 = 1.63) even though the IPCC doesn't even really even make any such distinction (to my knowledge, at least). RE: 3) The 1.63 applies to the power of 3.7 W/m^2 from 2xCO2 - not the 1.1 C in temperature, which has already been multiplied by 1.63 (3.7 x 1.63 = 6 W/m^2, which equals +1.1 C). RE: 4) I'm well aware of the difference between marginal and average rate; however, neither term is dictated by the laws of physics that govern the processes of energy flow in and out of the climate system.
  14. All I'm asking is for an explaination where the additional 12.9 W/m^2 is coming from to cause the 3 C rise (16.6 - 3.7 = 12.9). If the current atmosphere only provides an additional 2.3 W/m^2 (6 - 3.7 = 2.3), where specifically is the remaining +10.6 W/m^2 incoming flux required at the surface coming from?
  15. My main point here is how can a negative feedback reduction of about 25-40% from L&C be considered so unreasonable even though it is well within the measured bounds of the system from solar forcing, yet an amplification of 300% is considered so reasonable when it is so far outside the measured bounds?
  16. RW! @463: RE 2) I used 4 as a convenient approximation. A 2% increase in TSI results in approx 4.8 increase in TSI. A 1.6% results in a 3.8 W/m^2 increase. So us 1.6% instead. Regardless, for a 3.7 W/m^2 increase in solar forcing, the expected temperature increase is within around 10% of the increase for CO2. The slight difference is because differences is the region of greatest relative warming. RE 3) The 3.7 W/m^2 increase in TOA forcing results in approximately an approximately 16.6 W/m^2 increase in surface radiation, regardless of the forcing agent. If the surface temperature were held constant, but the feedbacks still applied, the 3.7 W/m^2 increase in TOA forcing would result in a TOA energy imbalance of approximately 11 W/m^2, again regardless of the forcing agent. Of course, Earth the feedbacks are a consequence of the warming, so that 11 W/m^2 is theoretical. Another way of looking at your error is that you compared the 3.7 to the 16.6 for CO2, but the 11 to the 16.6 for Solar. (I know that is not what you did, but it is theoretically equivalent.) However, my approach in 459 is more informative about the nature of your error. RE 4) The laws of physics do not dictate any terms - they just are. We choose which terms we will use in describing them, and the difference between a marginal and average rate is a good way to understand the reason for your error. The crucial thing you need to understand is that the temperature response to an equivalent solar and GHG forcing under current circumstances are expected to be very similar in magnitude though different in spatial and temporal structure. This is easily seen in the following two modelled temperature patterns for a doubling of CO2 (first) and a 2% increase in insolation (second): There is a genuine difference between the expected climate sensitivity for marginal changes in solar and CO2 forcing, but it is small. If you look up the relevant values you can try to run your argument again in a coherent manner, but I warn you the figures won't impress anyone, including you. Alternatively you can ignore the evidence above that climate science expects similar responses for similar forcings from solar or CO2 concentrations and keep on running your apples and oranges comparison. That will convincingly show that you are only here to spread confusion. (PS: I thought I had posted this, but it has not appeared. If this is a duplicate, please remove.)
  17. Tom, I'm just asking for an explanation of where the +12.9 W/m^2 flux needed at the surface is coming from, or specifically how the 'feedback' will cause this much response? So far you haven't provided an answer to this. Now, I've also asked why the feedback doesn't cause this much response on solar forcing, but I'm willing to overlook that for now. Furthermore, I presume you understand that if the surface is to warm by 3 C then it must also emit 406.6 W/m^2 (16.6 W/m^2 more) and that COE dictates that this +16.6 flux at the surface has to be coming from somewhere? If 3.7 W/m^2 are provided directly from 2xCO2 and another 2.3 W/m^2 are provided from the atmosphere's the net transmittance of of 0.62 (3.7 x 0.62 = 2.3 W/m^2) to allow the 3.7 W/m^2 to leave the system to restore equilibrium (240 W/m^2 in and out), where is the additional 10.6 W/m^2 flux coming from? There are only two possible sources for this flux. Either from the Sun via a reduced albedo of about 6.5 W/m^2 (6.5 x 1.62 = 10.6) or from increased atmosphere absorption of about 13 W/m^2 (13/2 = 6.5; 6.5 x 1.62 = 10.6).
  18. RW1 & Tom: Very interesting. Thank you.
  19. Tom (RE: 466), "The 3.7 W/m^2 increase in TOA forcing results in approximately an approximately 16.6 W/m^2 increase in surface radiation, regardless of the forcing agent." I'm well aware that this is the claim. I'm simply asking specifically how the +3.7 W/m^2 surface flux from the 2xCO2 (or the Sun) will become a total of +16.6 W/m^2 required for a 3 C rise. If 3.7 W/m^2 only provides a direct warming of 0.7 C and the atmosphere provides an additional 0.4 C for a total of 1.1 C, how specifically does a 1.1 C rise cause an additional +10.6 W/m^2 flux at the surface? Also, keeping this in the context of L&C, how is a reduction of 25-40% considered to be so unreasonable, yet an increase of nearly 300% is considered reasonable when such an increase is so far outside the measured bounds of the atmosphere (about a 0.62 net transmittance to space)? In other words, why isn't the net transmittance to space more like 0.22 (3.7/16.6 = 0.22)???
  20. My ultimate point here is +300% amplification is a far more extraordinary claim than a 25-40% reduction. I would also argue that a 25-40% reduction is far more consistent with the system's overall behavior, which is very tightly constrained from year to year despite a significant amount of local, seasonal hemispheric and even global variability. And when global average temperature does rise by an abnormal amount (like in 1998 and 2010), it tends to revert to its pre-equilibrium state fairly quickly, which is anything but consistent with net positive feedback, let alone net positive feedback of 300%.
    Response:

    [DB] It would be better to wait for someone to get back to you with a response than to continue to run-on with suppositions.  Repetitive posting without waiting for an answer is little different than talking to oneself; little progress in understanding is achieved.

  21. DB, OK, fair enough. I'll give Tom (or anyone else) a chance to respond before I say anything else.
  22. In case someone is thinking Lindzen & Choi 2011 is an improvement, please see here
  23. I noted with interest a recent paper published in Science where a lower median sensitivity is proposed with reduced uncertainty: "Abstract Assessing impacts of future anthropogenic carbon emissions is currently impeded by uncertainties in our knowledge of equilibrium climate sensitivity to atmospheric carbon dioxide doubling. Previous studies suggest 3 K as best estimate, 2 to 4.5 K as the 66% probability range, and nonzero probabilities for much higher values, the latter implying a small but significant chance of high-impact climate changes that would be difficult to avoid. Here, combining extensive sea and land surface temperature reconstructions from the Last Glacial Maximum with climate model simulations, we estimate a lower median (2.3 K) and reduced uncertainty (1.7 to 2.6 K 66% probability). Assuming paleoclimatic constraints apply to the future as predicted by our model, these results imply lower probability of imminent extreme climatic change than previously thought." Needless to say some of the less informative news outlets are trumpeting this as "another nail in the coffin" for AGW alarmism.
  24. #473 oneiota, I think there's an SkS article in the pipeline about the relevant paper, but in this case it is intriguing to see what skeptics consider supports their position. This paper does not support their position at all, but I don't think they realise why. The paper uses a climate model to estimate a relatively low climate sensitivity - the climate model in question has a remarkably low temperature difference between LGM and present conditions (3.3C) compared to published estimates usually towards 5C or more. The consequence of this is that the paper implies a much greater impact on the climate system for every degree of warming. Although it suggests fewer degrees C per doubling CO2, we'll also need fewer observed degrees C to create a climate change as large as LGM to present. And we're already well on the way to doing that, if this paper is correct. To me, that make for particularly worrying reading, and not a cause for optimism, as various news outlets, including the BBC, have implied.
  25. I haven't still read the paper, but a 2,3 K sensitivity is among the IPCC range and three models of the IPCC AR4 find a 2,1-2,3 K sensitivity for 2xCO2. So, that one study among many others arrives to the same conclusion from a LGM reconstruction is not a surprise, and certainly not the last word in a domain where there are many publications each year. #474 skywatcher : do you think to sea level rise? If it is the case, I don't know if a 3.3 K warming on a glacial condition will have the same effect that a 3,3 K warming on an interglacial condition (like ours). Intuitively, I'd say there was much more ice to melt 20ka ago than now, at mid latitude and low altitude. We should observe what semi-empirical ice models obtain with an imposed 2,3K sensitivity.

Prev  1  2  3  4  5  6  7  8  9  10  11  12  13  14  15  16  17  18  19  

Post a Comment

Political, off-topic or ad hominem comments will be deleted. Comments Policy...

You need to be logged in to post a comment. Login via the left margin or if you're new, register here.

Link to this page


The Consensus Project Website

THE ESCALATOR

(free to republish)


© Copyright 2024 John Cook
Home | Translations | About Us | Privacy | Contact Us