Climate Science Glossary

Term Lookup

Enter a term in the search box to find its definition.

Settings

Use the controls in the far right panel to increase or decrease the number of terms automatically displayed (or to completely turn that feature off).

Term Lookup

Settings


All IPCC definitions taken from Climate Change 2007: The Physical Science Basis. Working Group I Contribution to the Fourth Assessment Report of the Intergovernmental Panel on Climate Change, Annex I, Glossary, pp. 941-954. Cambridge University Press.

Home Arguments Software Resources Comments The Consensus Project Translations About Support

Bluesky Facebook LinkedIn Mastodon MeWe

Twitter YouTube RSS Posts RSS Comments Email Subscribe


Climate's changed before
It's the sun
It's not bad
There is no consensus
It's cooling
Models are unreliable
Temp record is unreliable
Animals and plants can adapt
It hasn't warmed since 1998
Antarctica is gaining ice
View All Arguments...


Username
Password
New? Register here
Forgot your password?

Latest Posts

Archives

Working out climate sensitivity from satellite measurements

What the science says...

Lindzen's analysis has several flaws, such as only looking at data in the tropics. A number of independent studies using near-global satellite data find positive feedback and high climate sensitivity.

Climate Myth...

Lindzen and Choi find low climate sensitivity

Climate feedbacks are estimated from fluctuations in the outgoing radiation budget from the latest version of Earth Radiation Budget Experiment (ERBE) nonscanner data. It appears, for the entire tropics, the observed outgoing radiation fluxes increase with the increase in sea surface temperatures (SSTs). The observed behavior of radiation fluxes implies negative feedback processes associated with relatively low climate sensitivity. This is the opposite of the behavior of 11 atmospheric models forced by the same SSTs. (Lindzen & Choi 2009)

Climate sensitivity is a measure of how much our climate responds to an energy imbalance. The most common definition is the change in global temperature if the amount of atmospheric CO2 was doubled. If there were no feedbacks, climate sensitivity would be around 1°C. But we know there are a number of feedbacks, both positive and negative. So how do we determine the net feedback? An empirical solution is to observe how our climate responds to temperature change. We have satellite measurements of the radiation budget and surface measurements of temperature. Putting the two together should give us an indication of net feedback.

One paper that attempts to do this is On the determination of climate feedbacks from ERBE data (Lindzen & Choi 2009). It looks at sea surface temperature in the tropics (20° South to 20° North) from 1986 to 2000. Specifically, it looked at periods where the change in temperature was greater than 0.2°C, marked by red and blue colors (Figure 1).
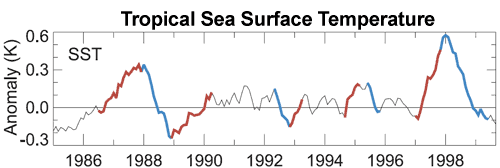

Figure 1: Monthly sea surface temperature for 20° South to 20° North. Periods of temperature change greater than 0.2°C marked by red and blue (Lindzen & Choi 2009).

Lindzen et al also analysed satellite measurements of outgoing radiation over these periods. As short-term tropical sea surface temperatures are largely driven by the El Nino Southern Oscillation, the change in outward radiation offers an insight into how climate responds to changing temperature. Their analysis found that when it gets warmer, there was more outgoing radiation escaping to space. They concluded that net feedback is negative and our planet has a low climate sensitivity of about 0.5°C.

Debunked by Trenberth

However, a response to this paper, Relationships between tropical sea surface temperature and top-of-atmosphere radiation (Trenberth et al 2010) revealed a number of flaws in Lindzen's analysis. It turns out the low climate sensitivity result is heavily dependent on the choice of start and end points in the periods they analyse. Small changes in their choice of dates entirely change the result. Essentially, one could tweak the start and end points to obtain any feedback one wishes.
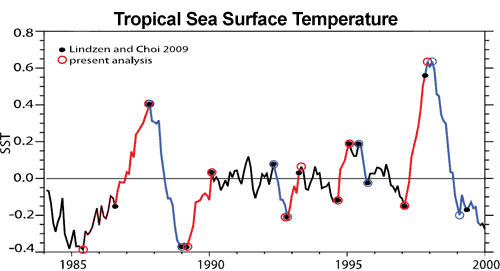

Figure 2: Warming (red) and cooling (blue) intervals of tropical SST (20°N – 20°S) used by Lindzen & Choi (2009) (solid circles) and an alternative selection proposed derived from an objective approach (open circles) (Trenberth et al 2010).

Debunked by Murphy

Another major flaw in Lindzen's analysis is that they attempt to calculate global climate sensitivity from tropical data. The tropics are not a closed system - a great deal of energy is exchanged between the tropics and subtropics. To properly calculate global climate sensitivity, global observations are required.

This is confirmed by another paper published in early May (Murphy 2010). This paper finds that small changes in the heat transport between the tropics and subtropics can swamp the tropical signal. They conclude that climate sensitivity must be calculated from global data.

Debunked by Chung

In addition, another paper reproduced the analysis from Lindzen & Choi (2009) and compared it to results using near-global data (Chung et al 2010). The near-global data find net positive feedback and the authors conclude that the tropical ocean is not an adequate region for determining global climate sensitivity.

Debunked by Dessler

Dessler (2011) found a number of errors in Lindzen and Choi (2009) (slightly revised as Lindzen & Choi (2011)).  First, Lindzen and Choi's mathematical formula  to calculate the Earth's energy budget may violate the laws of thermodynamics - allowing for the impossible situation where ocean warming is able to cause ocean warming.  Secondly, Dessler finds that the heating of the climate system through ocean heat transport is approximately 20 times larger than the change in top of the atmosphere (TOA) energy flux due to cloud cover changes.  Lindzen and Choi assumed the ratio was close to 2 - an order of magnitude too small.

Thirdly, Lindzen and Choi plot a time regression of change in TOA energy flux due to cloud cover changes vs. sea surface temperature changes.  They find larger negative slopes in their regression when cloud changes happen before surface temperature changes, vs. positive slopes when temperature changes happen first, and thus conclude that clouds must be causing global warming.

However, Dessler also plots climate model results and finds that they also simulate negative time regression slopes when cloud changes lead temperature changes.  Crucially, sea surface temperatures are specified by the models.  This means that in these models, clouds respond to sea surface temperature changes, but not vice-versa.  This suggests that the lagged result first found by Lindzen and Choi is actually a result of variations in atmospheric circulation driven by changes in sea surface temperature, and contrary to Lindzen's claims, is not evidence that clouds are causing climate change, because in the models which successfully replicate the cloud-temperature lag, temperatures cannot be driven by cloud changes.

2011 Repeat

Lindzen and Choi tried to address some of the criticisms of their 2009 paper in a new version which they submitted in 2011 (LC11), after Lindzen himself went as far as to admit that their 2009 paper contained "some stupid mistakes...It was just embarrassing."  However, LC11 did not address most of the main comments and contradictory results from their 2009 paper.

Lindzen and Choi first submitted LC11 to the Proceedings of the National Academy of Sciences (PNAS) after adding some data from the Clouds and the Earth’s Radiant Energy System (CERES).

PNAS editors sent LC11 out to four reviewers, who provided comments available here.  Two of the reviewers were selected by Lindzen, and two others by the PNAS Board.  All four reviewers were unanimous that while the subject matter of the paper was of sufficient general interest to warrant publication in PNAS, the paper was not of suitable quality, and its conclusions were not justified.  Only one of the four reviewers felt that the procedures in the paper were adequately described. 

As PNAS Reviewer 1 commented,

"The paper is based on...basic untested and fundamentally flawed assumptions about global climate sensitivity"

These remaining flaws in LC11 included:

  • Assuming that that correlations observed in the tropics reflect global climate feedbacks.
  • Focusing on short-term local tropical changes which might not be representative of equilibrium climate sensitivity, because for example the albedo feedback from melting ice at the poles is obviously not reflected in the tropics.
  • Inadequately explaining methodology in the paper in sufficient detail to reproduce their analysis and results.
  • Failing to explain the many contradictory results using the same or similar data (Trenberth, Chung, Murphy, and Dessler).
  • Treating clouds as an internal initiator of climate change, as opposed to treating cloud changes solely as a climate feedback (as most climate scientists do) without any real justification for doing so. 

As a result of these fundamental problems, PNAS rejected the paper, which Lindzen and Choi subsequently got published in a rather obscure Korean journal, the Asia-Pacific Journal of Atmospheric Science. 

Wholly Debunked

A full understanding of climate requires we take into account the full body of evidence. In the case of climate sensitivity and satellite data, it requires a global dataset, not just the tropics. Stepping back to take a broader view, a single paper must also be seen in the context of the full body of peer-reviewed research. A multitude of papers looking at different periods in Earth's history independently and empirically converge on a consistent answer - climate sensitivity is around 3°C implying net positive feedback.

Last updated on 6 July 2012 by dana1981. View Archives

Printable Version  |  Offline PDF Version  |  Link to this page

Argument Feedback

Please use this form to let us know about suggested updates to this rebuttal.

Further viewing

Andrew Dessler explains in relatively simple and short terms the results from his 2011 paper:

Comments

Prev  1  2  3  4  5  6  Next

Comments 101 to 125 out of 130:

  1. #96: "I mean only the intrinsic radiative forcing response - not any theoretical increase in temperature" In reality, isn't it the temperature increase that matters? The fact is that we have already observed more warming than your albedo-adjusted model predicts. In essence, you call for 0.3deg warming due to CO2 radiative forcing. To account for the observed 0.8deg global (1.0deg in the northern hemisphere), you must therefore invoke 'unknown forces' or 'natural causes' for more of an effect (0.8 observed - 0.3 CO2 = 0.5 unknown) than you calculate. I would be deeply troubled if that is where my calculations left me.
  2. KR (RE: Post 100), @KR: "Please keep in mind that the perihelion/aphelion cycle is just that - a cycle. Which means it goes down as well as up." I know. @KR: "The added greenhouse effect, on the other hand, is a long term increase in both perihelion and aphelion irradiance, a long term uncompensated change in total irradiance. And hence an energy imbalance." I also know. @KR: "The climate response to shifts in overall irradiance appears to be (including ocean responses) at least 40 years for mid-length feedbacks, centuries for long-term (weathering) feedbacks." How can the response time be 40+ years globally but only be about one month seasonally and/or hemispherically?
  3. RW1 - "How can the response time be 40+ years globally but only be about one month seasonally and/or hemispherically?" By actually considering the separation between short term seasonal feedbacks and long term heat content (Figure 4).
  4. RW1 - also Figure 5 from that last posting.
  5. KR (RE: Post 103), That's my point, why are they separate? Why are they different. What specifically is physically different about increased radiative forcing on a seasonal/hemispheric basis and increased radiative forcing globally? And don't point me to some graph. Even if I assume the information in that graph is correct, it doesn't mean the rise is from increased CO2 radiative forcing. What I mean is explain the physics in detail.
  6. RW1 - In detail? Nothing much to say other than 'time constants'. It takes time to change ocean heat content, which drives much of global weather. It takes time to melt or freeze the Arctic and Antarctic, to change the state of glaciers and Greenland, to change the distribution of plant zones. And seasonal changes, unlike CO2 forcings, happen too fast to make those long term changes. They cycle up and down (like weather) too fast to affect long term issues like those. There's nothing mysterious about that. It's all a matter of thermal inertia.
  7. KR (RE: Post 106), Apparently, it doesn't take much time at all to change ocean heat content. If it did, we wouldn't see anywhere near the seasonal variability each year, nor especially would we see anywhere near the change in ocean temperatures the occur each year. I'm not saying the seasons make any long term changes, as they do average out globally. I'm saying there is no physical reason why the globe as a whole would respond any slower than the individual hemispheres do to increases in radiative forcing. Ocean water is ocean water - whether it's in one specific hemisphere or the whole globe. Or are you saying the fundamental physics of ocean water is different hemispherically than it is globally?
  8. #107: "it doesn't take much time at all to change ocean heat content" Do you have any documentation for that? Again, credibility comes from being able to substantiate of your claims - preferably with reference to actual scientific literature. We're not talking about the surface temperature, despite your (similarly unsupported) claims to the contrary. Looks like a long, slow, but steady climb to me. No hint of seasonal variability.
  9. @RW1: "I'm well aware that any CO2 warming will be in addition to, or on top of, the normal variations. I don't dispute this, and nothing I've written disputes it." Then why do you act as if that wasn't the case? It matters little that CO2's additional forcing is 30% of the seasonal variation. What matters is that the average global temperatures go up. "I'm saying there is no physical reason why the globe as a whole would respond any slower than the individual hemispheres do to increases in radiative forcing." Actually, there is a very simple reason. The cyclical changes revert back and forth too quickly to trigger any feedback. On the other hand, increasing global temperatures nudges the cycle out of its rut, triggering feedbacks. Anyway, the point is moot. You have failed to come up with any credible alternatives to CO2 for the current warming. I don't understand why you continue to act as if you had a leg to stand on, because you don't.
  10. Seriously, not only do you have the same writing patterns as damorbel, you seem hell-bent on using the same tactic: repeat your erroneous ideas over and over again, ignoring rebuttals, in order to waste everyone's time. Put up or shut up: provide concrete evidence that the current warming *isn't* caused by CO2, or go do something else with your precious Internet time. Whatever you do, *don't* start over with another user name - we can see right through that.
  11. RW1 @39 (in reply to my 38) You completely fail to understand what the 4W/m2 represents. Your point 5 implies that 4W/m2 is the upwards flux from the surface absorbed in the atmosphere, some of which goes up and some down. This is mistaken. 4W/m2 is the net change in power emitted at the top of the atmosphere. The number is the result of a stepwise line by line heat balance; your point that CO2 radiates in all directions equally has already been taken care of in the calculation. Repeating this ad nauseum does not make it correct. You cannot halve it just to make your calculation yield the result you want it to.
  12. Oh, and here's a way to think about the 14W/m2 perihelion point you made to start with. 4W/m2 over (say) 100 years = 400 year watts/m2 energy change 14 W/m2 over 6 months = 7 year watts/m2 energy change So the effect of doubling CO2 over a century is 57x larger than the energy imbalance during the year. Assuming your unreferenced 14 W/m2 is correct - I haven't checked it and you haven't provided a reference.
  13. VeryTallGuy it's even worse than that. The climate system does not have time to fully respond to a 6 months forcing; also, 14 W/m2 is the maximum peak-to-peak value and it should be average over half a cycle. You badly exagerated the response to the annual cycle :) Anyways, it's true that the NH winter would be a little worse if it occured at the aphelion.
  14. Riccardo yes, I agree with everyrthing you say. Just thought the rough calc might help to explain.
  15. #108 muoncounter, the plot in 108 does not show annual cycles. This paper does ftp://ftp.nodc.noaa.gov/pub/data.nodc/woa/PUBLICATIONS/grlheat04.pdf and shows a 3 x 10^22 J annual fluctuation (zero to peak) or about 3 times the average annual rise of the plot in #108
  16. #112 VeryTallGuy, if we said 1000 years that would give us 4000 year watts / m^2. I don't think year watts has any physical meaning. #105 RW1, I don't think there is any other explanation of the year-to-year rise in OHC other than CO2 forcing despite the annual fluctuation due to app/peri. It is the same idea as the steady rise in atmospheric CO2 despite the seasonal fluctuation which exceeds that rise. The only explanation of the year-to-year increase is man-made CO2 in the atmosphere being only about 1/2 absorbed over the year and the other 1/2 remaining.
  17. #115: Thank you, Eric. Figure 4 in Antonov 2004 shows the nearly sinusoidal annual variation, which averages over the year to very nearly 0. Taken over the long term, oscillations don't add anything. That would also be the case for +/- orbital heat flux differences. However, we have other ongoing discussions of OHC here and here.
  18. RW1 writes: "logarithmic, which means each additional amount added only has about half of the effect of the previous amount" The man has his own (false) definition of 'logarithmic'. What more need be said?
  19. VeryTallGuy (RE: Post 111), I think I have an idea what you're trying to say, but I'm not sure. I'm getting the impression you're repeating things you've read or been told without fully understanding them. Can you take me through step by step how a doubling of CO2 will increase the surface temperature by solely the intrinsic amount (before any feedbacks)? And/or present a series of separate "Do you agree...." questions and break it down like I did.
  20. @RW1: "I think I have an idea what you're trying to say, but I'm not sure." Strange, because he was quite clear. In fact, many people here have offered solid rebuttals to your wild theories, and the fact you are not offering counter-arguments but simply restating your original position is telling. "I'm getting the impression you're repeating things you've read or been told without fully understanding them." I believe this is a textbook case of psychological projection. In fact, there is nothing wrong with VTG's argument - it is yours that seems to betray a profound misunderstanding of the science. Whether this is on purpose or not remains to be seen...
  21. archiesteel (RE: Post 120), I think VeryTallGuy can respond for himself.
  22. RW1, Regarding your questions in #61 above, can you ask them in terms of the diagram shown here Has-the-greenhouse-effect-been-falsified.html#14266? Or specifically I am wondering where the numbers in "390 divided by 238" come from?
  23. Eric (RE: Post 122), 390 W/m^2 is the surface emitted power for an average global temperature of 288K calculated from Stefan-Boltzman. The power in W/m^2 is directed tied to temperature via S-B because the surface of the earth is considered to be very close to a perfect black body radiator, so an emissivity of 1 can be used. 238 W/m^2 is net amount of solar power that isn't albedo reflected, or it is the amount of solar power that hits the surface and is re-radiated as LW infrared. In essence, it's the amount of solar power that has the potential to be absorbed and re-radiated by GHGs and/or clouds - it is the amount of incoming power that can contribute to the energy balance and the greenhouse effect. As far as that diagram, I'm not sure - I need specific questions.
  24. RW1 - I still think there is a problem of definition here. "Radiative Forcing" is a concept to put all forcings on an equivalent basis. Ie in terms of net downward energy flux measured at top of tropopause. So calculation of extra energy at the surface from GHG is recast so that it is equivalent to say extra solar but measured at top of tropopause (NOT the TOA). Thus 3.7W/m2 is the what the recalculation of energy flux works out to for a doubling of CO2. There is no feedbacks etc which affect the climate sensitivity involved in this calculation beyond dealing with overlaps in the water vapour spectrum. So an average, annual increase in energy of 3.7W/m2 at the top of the tropopause is surely going to warm the planet from 1st law consideration. If the 3.7W/m2 was from the sun, then you would expect warming surely? Well this is the equivalent. Day to night, season to season, solar flux certainly changes but the average annual change is small (or slightly decreasing).
  25. RW1, thanks. So your 390 seems to correspond with the 396 surface radiation in the Trenberth diagram. Your 238, which you describe as solar hitting the surface is listed as 184 in Trenberth (161 absorbed plus 23 reflected) That is a discrepancy I can't explain. What is odd is that Trenberth shows 239 outgoing LW at TOA which is very close to your 238 number. So my question boils down to: how is your 238 number derived?

Prev  1  2  3  4  5  6  Next

Post a Comment

Political, off-topic or ad hominem comments will be deleted. Comments Policy...

You need to be logged in to post a comment. Login via the left margin or if you're new, register here.

Link to this page


The Consensus Project Website

THE ESCALATOR

(free to republish)


© Copyright 2024 John Cook
Home | Translations | About Us | Privacy | Contact Us