Climate Science Glossary

Term Lookup

Enter a term in the search box to find its definition.

Settings

Use the controls in the far right panel to increase or decrease the number of terms automatically displayed (or to completely turn that feature off).

Term Lookup

Settings


All IPCC definitions taken from Climate Change 2007: The Physical Science Basis. Working Group I Contribution to the Fourth Assessment Report of the Intergovernmental Panel on Climate Change, Annex I, Glossary, pp. 941-954. Cambridge University Press.

Home Arguments Software Resources Comments The Consensus Project Translations About Support

Bluesky Facebook LinkedIn Mastodon MeWe

Twitter YouTube RSS Posts RSS Comments Email Subscribe


Climate's changed before
It's the sun
It's not bad
There is no consensus
It's cooling
Models are unreliable
Temp record is unreliable
Animals and plants can adapt
It hasn't warmed since 1998
Antarctica is gaining ice
View All Arguments...


Username
Password
New? Register here
Forgot your password?

Latest Posts

Archives

Working out climate sensitivity from satellite measurements

What the science says...

Lindzen's analysis has several flaws, such as only looking at data in the tropics. A number of independent studies using near-global satellite data find positive feedback and high climate sensitivity.

Climate Myth...

Lindzen and Choi find low climate sensitivity

Climate feedbacks are estimated from fluctuations in the outgoing radiation budget from the latest version of Earth Radiation Budget Experiment (ERBE) nonscanner data. It appears, for the entire tropics, the observed outgoing radiation fluxes increase with the increase in sea surface temperatures (SSTs). The observed behavior of radiation fluxes implies negative feedback processes associated with relatively low climate sensitivity. This is the opposite of the behavior of 11 atmospheric models forced by the same SSTs. (Lindzen & Choi 2009)

Climate sensitivity is a measure of how much our climate responds to an energy imbalance. The most common definition is the change in global temperature if the amount of atmospheric CO2 was doubled. If there were no feedbacks, climate sensitivity would be around 1°C. But we know there are a number of feedbacks, both positive and negative. So how do we determine the net feedback? An empirical solution is to observe how our climate responds to temperature change. We have satellite measurements of the radiation budget and surface measurements of temperature. Putting the two together should give us an indication of net feedback.

One paper that attempts to do this is On the determination of climate feedbacks from ERBE data (Lindzen & Choi 2009). It looks at sea surface temperature in the tropics (20° South to 20° North) from 1986 to 2000. Specifically, it looked at periods where the change in temperature was greater than 0.2°C, marked by red and blue colors (Figure 1).
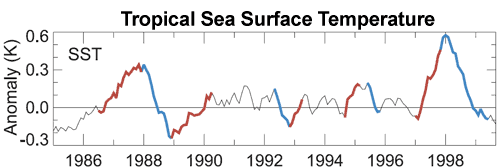

Figure 1: Monthly sea surface temperature for 20° South to 20° North. Periods of temperature change greater than 0.2°C marked by red and blue (Lindzen & Choi 2009).

Lindzen et al also analysed satellite measurements of outgoing radiation over these periods. As short-term tropical sea surface temperatures are largely driven by the El Nino Southern Oscillation, the change in outward radiation offers an insight into how climate responds to changing temperature. Their analysis found that when it gets warmer, there was more outgoing radiation escaping to space. They concluded that net feedback is negative and our planet has a low climate sensitivity of about 0.5°C.

Debunked by Trenberth

However, a response to this paper, Relationships between tropical sea surface temperature and top-of-atmosphere radiation (Trenberth et al 2010) revealed a number of flaws in Lindzen's analysis. It turns out the low climate sensitivity result is heavily dependent on the choice of start and end points in the periods they analyse. Small changes in their choice of dates entirely change the result. Essentially, one could tweak the start and end points to obtain any feedback one wishes.
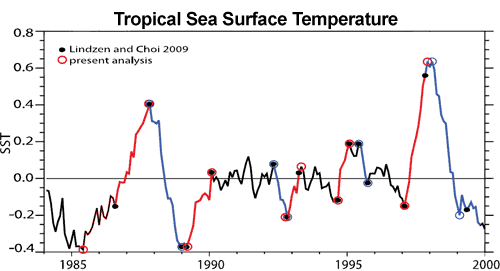

Figure 2: Warming (red) and cooling (blue) intervals of tropical SST (20°N – 20°S) used by Lindzen & Choi (2009) (solid circles) and an alternative selection proposed derived from an objective approach (open circles) (Trenberth et al 2010).

Debunked by Murphy

Another major flaw in Lindzen's analysis is that they attempt to calculate global climate sensitivity from tropical data. The tropics are not a closed system - a great deal of energy is exchanged between the tropics and subtropics. To properly calculate global climate sensitivity, global observations are required.

This is confirmed by another paper published in early May (Murphy 2010). This paper finds that small changes in the heat transport between the tropics and subtropics can swamp the tropical signal. They conclude that climate sensitivity must be calculated from global data.

Debunked by Chung

In addition, another paper reproduced the analysis from Lindzen & Choi (2009) and compared it to results using near-global data (Chung et al 2010). The near-global data find net positive feedback and the authors conclude that the tropical ocean is not an adequate region for determining global climate sensitivity.

Debunked by Dessler

Dessler (2011) found a number of errors in Lindzen and Choi (2009) (slightly revised as Lindzen & Choi (2011)).  First, Lindzen and Choi's mathematical formula  to calculate the Earth's energy budget may violate the laws of thermodynamics - allowing for the impossible situation where ocean warming is able to cause ocean warming.  Secondly, Dessler finds that the heating of the climate system through ocean heat transport is approximately 20 times larger than the change in top of the atmosphere (TOA) energy flux due to cloud cover changes.  Lindzen and Choi assumed the ratio was close to 2 - an order of magnitude too small.

Thirdly, Lindzen and Choi plot a time regression of change in TOA energy flux due to cloud cover changes vs. sea surface temperature changes.  They find larger negative slopes in their regression when cloud changes happen before surface temperature changes, vs. positive slopes when temperature changes happen first, and thus conclude that clouds must be causing global warming.

However, Dessler also plots climate model results and finds that they also simulate negative time regression slopes when cloud changes lead temperature changes.  Crucially, sea surface temperatures are specified by the models.  This means that in these models, clouds respond to sea surface temperature changes, but not vice-versa.  This suggests that the lagged result first found by Lindzen and Choi is actually a result of variations in atmospheric circulation driven by changes in sea surface temperature, and contrary to Lindzen's claims, is not evidence that clouds are causing climate change, because in the models which successfully replicate the cloud-temperature lag, temperatures cannot be driven by cloud changes.

2011 Repeat

Lindzen and Choi tried to address some of the criticisms of their 2009 paper in a new version which they submitted in 2011 (LC11), after Lindzen himself went as far as to admit that their 2009 paper contained "some stupid mistakes...It was just embarrassing."  However, LC11 did not address most of the main comments and contradictory results from their 2009 paper.

Lindzen and Choi first submitted LC11 to the Proceedings of the National Academy of Sciences (PNAS) after adding some data from the Clouds and the Earth’s Radiant Energy System (CERES).

PNAS editors sent LC11 out to four reviewers, who provided comments available here.  Two of the reviewers were selected by Lindzen, and two others by the PNAS Board.  All four reviewers were unanimous that while the subject matter of the paper was of sufficient general interest to warrant publication in PNAS, the paper was not of suitable quality, and its conclusions were not justified.  Only one of the four reviewers felt that the procedures in the paper were adequately described. 

As PNAS Reviewer 1 commented,

"The paper is based on...basic untested and fundamentally flawed assumptions about global climate sensitivity"

These remaining flaws in LC11 included:

  • Assuming that that correlations observed in the tropics reflect global climate feedbacks.
  • Focusing on short-term local tropical changes which might not be representative of equilibrium climate sensitivity, because for example the albedo feedback from melting ice at the poles is obviously not reflected in the tropics.
  • Inadequately explaining methodology in the paper in sufficient detail to reproduce their analysis and results.
  • Failing to explain the many contradictory results using the same or similar data (Trenberth, Chung, Murphy, and Dessler).
  • Treating clouds as an internal initiator of climate change, as opposed to treating cloud changes solely as a climate feedback (as most climate scientists do) without any real justification for doing so. 

As a result of these fundamental problems, PNAS rejected the paper, which Lindzen and Choi subsequently got published in a rather obscure Korean journal, the Asia-Pacific Journal of Atmospheric Science. 

Wholly Debunked

A full understanding of climate requires we take into account the full body of evidence. In the case of climate sensitivity and satellite data, it requires a global dataset, not just the tropics. Stepping back to take a broader view, a single paper must also be seen in the context of the full body of peer-reviewed research. A multitude of papers looking at different periods in Earth's history independently and empirically converge on a consistent answer - climate sensitivity is around 3°C implying net positive feedback.

Last updated on 6 July 2012 by dana1981. View Archives

Printable Version  |  Offline PDF Version  |  Link to this page

Argument Feedback

Please use this form to let us know about suggested updates to this rebuttal.

Further viewing

Andrew Dessler explains in relatively simple and short terms the results from his 2011 paper:

Comments

Prev  1  2  3  4  5  6  7  8  9  Next

Comments 176 to 200 out of 211:

  1. KR (RE: Post 174), KR: "The 3.7 W/m^2 forcing for a doubling of CO2 leads to a 1.2°C warming without considering feedbacks. That means 3.7 W/m^2 less IR radiation leaves the atmosphere. That number is the result of a considerable amount of computation, more than I can fit on the back of an envelope, working from basic physics to find how much energy is retained by GHG's." I want to see the details and computations, or at least point me to a source that lays them out. The "basic physics" dictate it should be half up and half down. For a 3.7 W/m^2 net toward the surface, that means a total of 7.4 W/m^2 has to be the amount additional infrared power absorbed and re-radiated from a doubling of CO2. BTW, I'm well aware that the calculation of 3.7 W/m^2 involves the things you're mentioning and it not a simple straightforward calculation.
  2. KR (RE: Post 174), KR: "Seasonal changes are cyclic, which means they average out to a trend of zero (0°C) over time. Seasonal variability is quite large - but the trend over time (30 years for statistical significance) is non-zero, indicating global warming." I totally know all of this. How are you interpreting what I've said as being in conflict with this?
  3. KR (RE: Post 174), KR: "Your 1.6 gain makes absolutely no sense to me, nor to any number of other posters. You appear to be dividing apples by oranges." In what way, specifically? How am I dividing apples by oranges? What are you referring to exactly?
  4. RW1, I don't think you are going to find a calculation of 7.4 W/m^2 absorbed, because like 3.7 radiative equivalent, it is not a physical quantity. The 3.7 is an effective forcing that can be used for comparison purposes with other forcings. The 7.4 would thus be an "effective absorption" but the physical reality is that the atmosphere absorbs and reradiates with decreasing absorption coefficients at every level as you go up. It can estimated with some granularity in the simulations, but certainly not with a granularity of one (layer).
  5. KR (RE: Post 174), KR: "Your raw number calculations for insolation do not include sun angle; that will change those raw numbers considerably." Please explain and give specifics. I'm using global average numbers for insolation. I'm well aware that the angle of the sun varies dramatically dependent on latitude.
  6. KR (RE: Post 174), KR: "Your peak-to-peak insolation numbers are meaningless without averaging them over the season; they should be ~50-60% of the peak-peak values (off the top of my head) for seasonal averages." What do you mean by "50-60% of the peak-peak values"?
  7. RW1 and KR, the 1.6 gain is simply comparing two power fluxes in different locations. By comparing incoming and outgoing solar, for example, the albedo is determined linearly. The 1.6 would appear to also be linear, but it is not. For example if we only had a very small quantity of unreflected solar forcing (say 10 W/m^2), the surface would have no water vapor and no gaseous CO2 and the gain would pretty much be zero.
  8. #181: "~50-60% of the peak-peak values" Surely you are aware that the rms average of a pure sinusoid is .707 of the peak. Some asymmetry may produce an rms average that is somewhat less. The objections to your calculations have been made clear. It is useless to continue insisting that they have not and to pick one point for each posting and ask for details. You need to review this entire thread from post #2 on, as a whole, without asking for line-by-line explanations. We are far off the topic of this thread; IMHO its time to move on.
  9. KR (RE: Post 174), KR: "Evaporation and convection in the Trenberth numbers count; very much so. The Trenberth 2009 energy budget is essentially a 3-layer layout: 3-way exchanges between outer space, the surface of the Earth (water and soil), and the atmosphere. All numbers are important. You've indicated that you feel Trenberth was just presenting ad hoc numbers, as I indicated in this post, you're going to have to demonstrate your objections to specific numbers in those budgets to be taken seriously." No, I think some of Trenberth's numbers were determined ad hoc, but the diagram is confusing. Also, I did point out that his 70 W/m^2 for the transparent part of the atmosphere was likely too low. It's probably more like 80 W/m^2, because that yields 50/50 up/down for the portion of the atmosphere that is absorbed and re-radiated. What would like to know specifically?
  10. RW1, I can't answer all your specific questions tonight, but I would note that the comparison between the paper you linked in #150 and the Collins paper I linked in #175 is quite dramatic. The author in your link has no representation of atmosphere except the flux-derived "gain" and the borrowed 3.7 number. It appears to be a case partly of misinterpretation and partly oversimplification, but I obviously need to figure out exactly what is wrong.
  11. RW1, I think Eric (skeptic) has hit dead-on one of the problems with your approach, though other commentators I think have mentioned it: "but certainly not with a granularity of one (layer)." Each layer (really, each molecule) radiates half up and half down. The entire atmosphere is not a single layer that radiates half up and half down. There are many layers (molecules stacked on top of each other). Worse, the different layers have different characteristics. David Archer's book "Global Warming: Understanding the Forecast" devotes its Chapter 3 to such a simple layer model, but only as an introduction to the concepts. Even that single-layer model shows heating of the surface. One of the "Projects" at the end of that chapter is to have the student extend that one-layer model to two layers (page 27), which still is far simpler than the real models that climatologists use. I think that chapter is your best way of understanding this topic.
  12. Eric (RE: 182), Eric: "the 1.6 gain is simply comparing two power fluxes in different locations." No, the gain of 1.6 is a global average calculation. It is simply the global average emitted surface power divided by the global average albedo adjusted solar power.
  13. Tom Dayton (RE: 186), Tom: "Each layer (really, each molecule) radiates half up and half down. The entire atmosphere is not a single layer that radiates half up and half down. There are many layers (molecules stacked on top of each other). Worse, the different layers have different characteristics." I know.
  14. Eric (RE: 182), Eric: "The 7.4 would thus be an "effective absorption" but the physical reality is that the atmosphere absorbs and reradiates with decreasing absorption coefficients at every level as you go up. It can estimated with some granularity in the simulations, but certainly not with a granularity of one (layer)." OK, show me the power in = power out radiative budget calculations that prove this. I already showed that for power in = power out, almost exactly half the the power absorbed by the atmosphere (for GHGs and clouds) is radiated up out to space and the other half is radiated down. I know.
  15. Eric (RE: 182), Disregard the "I know" at the end of post 189 - it was leftover from 188.
  16. RW1 - First, I'm glad you're responding. You did not to the last 2-3 posts I made on this thread. - Please point out which Trenberth numbers you disagree with, and why. With some evidence - measurements, physics, etc. I think the burden of proof is on you for whatever disagreement you have. I have no idea which 70 W/m^2 you are referring to - there's 40 in the "IR window" from the surface (no GHG absorption) and 30 from clouds, but otherwise... - Your 1.6 'gain factor' makes no sense to me whatsoever. If you feel that there is a 'gain factor' that makes one type of energy forcing different than another, please explain it clearly. And why. I can't figure it out from your postings so far. Visible light albedo directly affects solar forcing (79 W/m^2 reflected from clouds, 23 W/m^2 reflected from surface, 78 absorbed by atmosphere, 161 absorbed by surface), and is irrelevant to all other aspects of the energy balance which involve IR rather than visible light (emissivity/absorptivity in IR ~95% for the surface, not 0.875 or cloud 0.5). What counts is the energy transferred into the system, not the ratio of what gets reflected. - 3.7 W/m^2 change in top of atmosphere (TOA) forcing per doubling of CO2. Yes, in a single layer model (not realistic) that's 7.4 watts absorbed in surface layers. If you want details, follow the multiple links to MODTRAN models folks have pointed you towards - which you have apparently not followed. If you won't, and haven't done the work, well then, don't argue with it. - You have repeatedly asserted that cyclic variations (orbital distances, seasons) somehow affect the global energy balance differently than CO2 forcings. You are incorrect - they all affect the global energy in the same fashion. It's just that long term trends in averages will change global climate, whereas balanced cycles will not. - muoncounter - Thanks, a sinusoid does average to 0.707 peak to peak values. I'm not sure that it's a pure sinusoid; given that perihelion orbital velocities are higher than aphelion, but that sounds about right. It's certainly not the peak-to-peak values RW1 asserts. - If you know that lower atmosphere absorption is ~twice what gets blocked at TOA, why are you claiming that the 3.7 gets halved?!? That's halving twice!
  17. #189: "I already showed that for power in = power out, almost exactly half ..." No, you didn't show it, you decreed it. Refer to comment #7 for the first time someone said 'not'. We are going in circles over this. You've made your point to the best of your ability. As others have made theirs. Perhaps you could contact Dr. Trenberth directly and demonstrate to him exactly how he is incorrect.
  18. muoncounter (RE: 192), I used Trenberth's number of 70 W/m^2 for the transparent portion of the atmosphere and got 52.5% up and 47.5% down for the absorbed portion of the atmosphere. That's pretty close to 50/50. That it's over 50% going up with his 70 W/m^2 suggests the actual transparency number is higher (more like a little over 80 W/m^2 for 50/50 up/down). If you missed it, here it is again: At a temperature of 288K, the surface emits 390 W/m^2. With a gain of 1.6 at the surface, the amount of power absorbed by the atmosphere and sent back toward the surface is 152 W/m^2 (238 W/m^2 from the Sun + 152 W/m^2 from atmosphere = 390 W/m^2 at the surface). To calculate the amount of power absorbed by the atmosphere and directed up out to space, we need to know how much of the surface power passes through the transparent window of the atmosphere totally unabsorbed. If we use Trenberth's 70 W/m^2, we get a total of 320 W/m^2 absorbed by the atmosphere (390 - 70 = 320 W/m^2). 320 W/m^2 total absorbed - 152 W/m^2 directed downward back toward the surface = 168 W/m^2 upward out to space, which using Trenberth's numbers at least, is actually about 52.5% up and 47.5% down. 168 W/m^2 + 70 W/m^2 going up = 238 W/m^2 leaving and 238 W/m^2 arriving. Do you see how that for power in = power out, half of what the atmosphere absorbs has to be directed out to space?
  19. KR (RE: 191), KR: "Please point out which Trenberth numbers you disagree with, and why. With some evidence - measurements, physics, etc. I think the burden of proof is on you for whatever disagreement you have. I have no idea which 70 W/m^2 you are referring to - there's 40 in the "IR window" from the surface (no GHG absorption) and 30 from clouds, but otherwise." Again, the diagram is confusing. In his diagram he is denoting that 40 W/m^2 is the amount passing through the clear sky unabsorbed and 30 W/m^2 is passing through cloudy sky unabsorbed for a total atmospheric window of 70 W/m^2.
  20. KR (RE: 191), KR: "Your 1.6 'gain factor' makes no sense to me whatsoever. If you feel that there is a 'gain factor' that makes one type of energy forcing different than another, please explain it clearly. And why. I can't figure it out from your postings so far. Visible light albedo directly affects solar forcing (79 W/m^2 reflected from clouds, 23 W/m^2 reflected from surface, 78 absorbed by atmosphere, 161 absorbed by surface), and is irrelevant to all other aspects of the energy balance which involve IR rather than visible light (emissivity/absorptivity in IR ~95% for the surface, not 0.875 or cloud 0.5). What counts is the energy transferred into the system, not the ratio of what gets reflected." Forget about the gain for a minute. Do you notice that 161 + 78 = 239W/m^2 and not the 396 W/m^2 power at the surface? Using Trenberth's diagram and numbers, tell me where the 396 W/m^2 of power at the surface is coming from? Do you see what I mean about the diagram being very ambiguous and hard to follow? This can't be derived from information provided in the diagram. Do you also notice that 239 W/m^2 (161 + 78) is the albedo adjusted energy coming in from the Sun?
  21. RW1 - Let's see. Surface incoming: 161 solar, 333 backradiation. 494 total. Surface outgoing: 17 thermals, 80 latent heat, 396 IR. 493 total. Difference: 1 W/m^2 imbalance, leading to global warming. This adds up to me. This is extremely clear.
    Response: [Daniel Bailey] Fixed text.
  22. RW1 - Yes, I do notice that 161 is the incoming energy from the sun. Once it arrives, however, we're in the thermal IR realm, not the visible light realm, and the visible light albedo is no longer relevant to IR.
  23. RW1 - 40 W/m^2 passes straight through the atmosphere in the 'IR window'. 30 W/m^2 is thermally emitted by clouds. Your statement "30 W/m^2 is passing through cloudy sky unabsorbed" (emphasis added) indicates to me that you do not understand Trenberth's diagrams.
  24. KR, Can you give me the power in = power out relationship between the numbers in your post #196.
  25. KR (RE: 197), Are you saying that 239 W/m^2 is not the albedo adjusted input power? The diagram shows the albedo being 102 W/m^2.

Prev  1  2  3  4  5  6  7  8  9  Next

Post a Comment

Political, off-topic or ad hominem comments will be deleted. Comments Policy...

You need to be logged in to post a comment. Login via the left margin or if you're new, register here.

Link to this page


The Consensus Project Website

THE ESCALATOR

(free to republish)


© Copyright 2024 John Cook
Home | Translations | About Us | Privacy | Contact Us