


 Arguments


Has Arctic sea ice returned to normal?
What the science says...
| Select a level... |
 Basic
Basic
|
 Intermediate
| |||
|
Thick arctic sea ice is in rapid retreat. |
|||||
Climate Myth...
Arctic sea ice has recovered
"Those who have been following NSIDC and JAXA sea ice plots have noted that this has been an extraordinary year so far, with Arctic sea ice hitting the “normal” line on some datasets. ...
As of today, JAXA shows that we have more ice than any time on this date for the past 8 years of Aqua satellite measurement for this AMSRE dataset." (Anthony Watts, 22 April 2010)
At a glance
One of the great metrics of climate change, because it is easy to visualise, is sea-ice in the Arctic. Every year, the ice margins retreat in the northern summer, reaching a minimum extent some time in September. It then refreezes through the long, dark cold winter months, until its maximum extent is reached in March.
Arctic sea-ice has a seasonal component - so-called 'first year ice' - and the more perennial 'multi-year ice'. First-year ice is relatively thin - 30-40 centimetres is typical. Multi-year stuff is thicker - 2-4 metres and much of it is situated between the north coast of Greenland and the North Pole.
Most of the annual, seasonal decline in ice extent, observed by satellites for more than 40 years, is due to first-year ice melting: the more robust multi-year ice takes more energy to remove, but nevertheless it is in decline, too. Calculations of sea-ice volume reveal that trend.
How does sea-ice form? We all know the freezing temperature of saltwater is lower than that of freshwater, hence the spreading of rock salt on the roads on frosty winter nights. Similarly, the ocean temperature needs to fall below -1.8°C (28.8°F) for sea-ice to form. In the freezing season it starts freezing over once the upper 150 metres or so of the ocean are close to that temperature.
Melt varies a lot from one year to another. This should come as no surprise: sea-ice, being on an ocean, moves about a fair amount. Variations in ocean-currents are particularly important since if sea-ice can be 'exported' out of the Arctic, it enters what is basically a hostile environment, where it melts away to nothing. Incidentally, such floes are a lot smaller than icebergs like the one that famously destroyed the Titanic in April 1912. Such ice behemoths originate where glaciers 'calve' upon reaching the sea.
Weather is a highly variable driver of sea-ice melt. Prolonged strong winds from the right direction can cause mass-export of ice into warmer waters. Then again, winds from the south transport warm air over the Arctic Ocean, causing the melting to intensify. But they may also bring in extensive cloud-decks, blocking a lot of incoming Solar energy. No surprise then that melt seasons vary a lot from one season to another.
As in most things related to climate change, it's the multidecadal trend that is key and that is unequivocally downwards, both in terms of extent and volume. Sudden spurts of growth are interesting, as are record meltdowns such as that in 2012. But that's it. Trend is the critical bit. The data clearly show that since 2010, when the statement in the box above originated, eight out of the ten lowest Arctic sea-ice minima have occurred. The only two melt-seasons outside of that time-frame were in 2007 and 2008. For the big picture regarding Arctic sea-ice, ignore the noise from one year to the next and look at all the data. It's heading one way - down.
Please use this form to provide feedback about this new "At a glance" section. Read a more technical version below or dig deeper via the tabs above!
Further details
Discussions about the amount of sea ice in the Arctic often confuse two very different measures of how much ice there is. One measure is sea-ice extent which, as the name implies, is a measure of coverage of the ocean where ice covers 15% or more of the surface. It is a two-dimensional measurement; extent does not tell us how thick the ice is. The other measure of Arctic ice, using all three dimensions, is volume, the measure of how much ice there really is.
Sea-ice consists of first-year ice, which is thin, and older ice that has survived one or more melt seasons, so that it has accumulated volume. This thicker multi-year ice is particularly important because it makes up most of the volume of the sea-ice. Volume is also the important measure when it comes to climate change, because it is the volume of the ice – the sheer amount of the stuff – that science is concerned about, rather than how much of the sea is covered in a thin layer of ice*.
Over time, sea ice reflects the fast-changing circumstances of weather. It is driven principally by changes in surface temperature, forming and melting according to the seasons, the winds, cloud cover and ocean currents. In 2010, for example, sea ice extent recovered dramatically in March, only to melt again by May.
Because sea-ice is subject to such powerful short-term effects, we cannot conclude anything about the health of the ice from just a single year’s data. It is over multiple decades that an obvious trend emerges. According to the National Snow and Ice Data Center, the overall trend in Arctic sea-ice minimum extent from 1979 to 2022 is down - by 12.6 percent per decade, relative to the 1981 to 2010 average (fig. 1). The average loss of sea ice works out at about 78,500 square kilometres per year. That's like losing an area the size of the state of South Carolina or the country of Austria - every year!
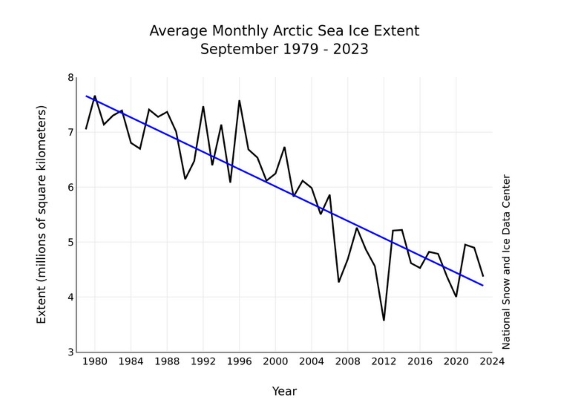
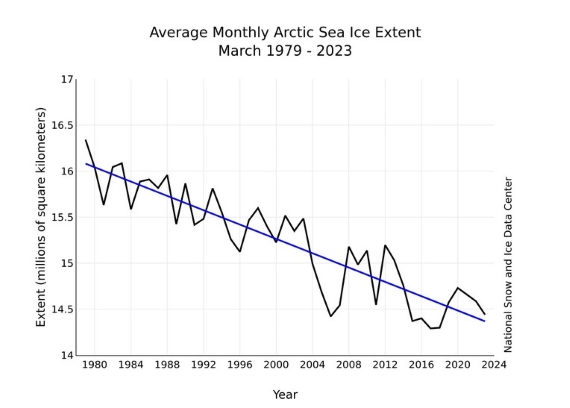
Fig. 1: Sea-ice extent in a) September, at the seasonal minimum (top panel) and b) March, at the annual maximum (bottom panel), for the period 1979-2023, . The trend is clear. Source: NSIDC
Multi-year ice volume is in steep decline. As you might imagine, thick ice takes a lot more heat to melt, so the fact that it is disappearing so fast is of great concern (fig. 2).
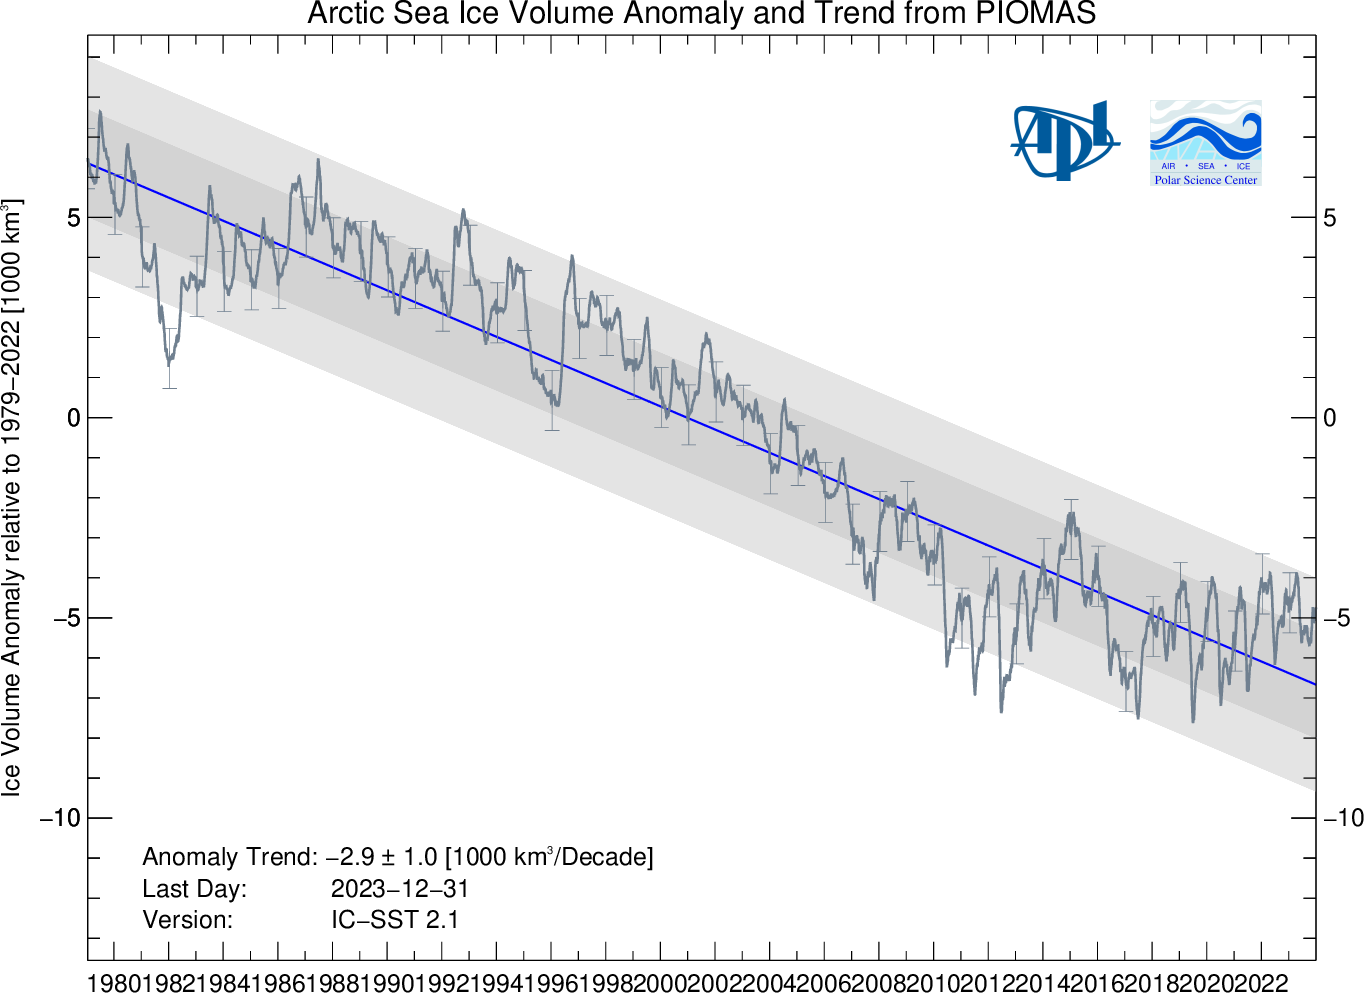
Fig. 2: Arctic sea-ice volume anomaly from PIOMAS. Daily sea-ice volume anomalies for each day, computed relative to the 1979 to 2022 average for that day of the year. Tick–marks on the time axis refer to the first day of each year. The trend for the period 1979- present is shown in blue. Shaded areas show one and two standard deviations from the trend. Error bars indicate the uncertainty of the monthly anomaly plotted once per year. Source: Polar Science Center, University of Washington.
It is clear from the various data sets, terrestrial and satellite, that both the sea ice extent and multi-year ice volume are reducing decade by decade. The full extent of annual ice reduction is seen in September of each year, at the end of the Arctic summer, and is on a long-term downward path. Multi-year ice volume has not recovered at all, and is showing a steeply negative multidecadal trend.
* Footnote: Although a thin layer of ice doesn’t tell us much about the overall state of ice loss at the Arctic, it does tell us a great deal about Albedo, the property of ice to reflect heat back into space. When the sea ice diminishes, more heat passes into the oceans. That heat melts the thick ice and speeds up the melting of thinner sea ice, which in turns allows more heat to accumulate in the oceans. This is an example of positive feedback.
Last updated on 4 February 2024 by John Mason. View Archives


MA Rodger @ 74, How strong is the trend toward a later maximum freeze?
bozzza @76.
I think the 'trend' is probably very small, far less than those weilding mention of it appear to imply, as I was myself doing @74. It is probably used more a cautionary note that there can be a very late daily maximum.
The daily data from JAXA fails to give a statistically significat trend (and I use 9-day averages to reduce the noise), yielding a rather large +7days per decade +/-15 days. The average for the JAXA data (2003-14) is day 72.4. The climatology from NSIDC (1981-2010) gives the maximum 9-day period as day 70. These two suggest a trend of 1.8 days per decade.
That said, I have elsewhere now bravely called this years maximum as having happened in February (coz I hate faffing about) which would put the 2015 maximum as a very early day 55.
Further to #77, it occurred to me that the Feb & Mar SIE data would allow this "late maximum trend" to be examined all the way back to 1979. Plotting SIE(Feb)-SIE(Mar) shows a trend for a freezier March beginning about 20 years ago (1995-2014). That period does yield a statistically significant trend, but not as a date of maximum SIE. Over that period March is getting icier compared with February by 24,000 sq km per year +/-10,000(2sd).
Continuing an (off topic!) conversation from elsewhere, Cryosphere Today is finally back to normal after its long "hiatus". The "homebrew" calculation from the Arctic Sea Ice Forum was in error by 0.3k.
The official CT Arctic sea ice area is currently 11,796,725 km2 for day 124 of 2015.
jetfuel:
You forgot to mention that the NSID also qualified their multi-year ice reporting comment with the following very relevant facts:
• During the summer of 2013, a larger fraction of first-year ice survived compared to recent years. This ice has now become second-year ice. (i.e. your multi-year ice thus keeping the 7% you tried to dismiss, very relevant.)
• The percentage of the Arctic Ocean consisting of ice at least five years or older remains at only 7%, half of what it was in February 2007. Moreover, a large area of the multiyear ice has drifted to the southern Beaufort Sea and East Siberian Sea (north of Alaska and the Lena River delta), where warm conditions are likely to exist later in the year.
The Arctic sea ice extent as of December 2014 does not show any significant recovery. It appears to be 2% above the long term downward trend line.
Extent coverage in January 2015 is showing a downward trend.
Maximum extant coverage in February 2015 not only occurred early; it is also the lowest maximum in the satellite record.
Maximum extant coverage in march 2015 is the lowest March ice extant in the satellite record.
Extent coverage in April 2015 is the second lowest April ice extant in the satellite record: http://nsidc.org/arcticseaicenews/
I remember when a science denier used to use 2007 as the year he demanded that people compare every year after 2007 to for the lowest Arctic sea ice extant coverage trying to claim that because 2007 was the new low point that the Arctic was recovering. That alleged recovery also ended up, in 2012 I think, according to NASA’s measurements, on the trash heap of history.
With NOAA releasing a 2014 Artic report card that some people have used to claim that AGW is real: I can see NOAA being called to the carpet by Republicans in Congress like NASA was over its climate research.
The only upside will be the entertainment value of look on the NOAA’s officials faces when they are instructed by Republicans to stop wasting their budget on AGW and use the money to find their Ark, which they, because they are laze unionized government employees, misplaced on mount Ararat in order to prove to the world that sea levels will not rise.
Arctic sea-ice for July 19, 2015 seems to be taking a big dive again. Having recovered to near normal conditions I would be very interested to see if it once again goes below the 2 standard deviation level it was just over a month ago.
I am thinking of the multi-year ice/thickness of it's current state... has anyone got any ideas about the latest multi-year ice/thickness data of the arctic with links?
[JH] Check out:
Arctic Sea Ice Volume Rebounds, But Not Recovering by Andrea Thompson, Climate Central, July 20, 2015
Si Senor, am doing that now!
Keenly watching the Arctic sea extent graphs dipping down toward 2 standard deviations again, however... I don't like the angle on that graphology...
Tieing the two sources together(...without having finished reading the article yet because I'm a betting man..) I am glad to be empowered by the knowledge that whilst 3 metre plus ice recovered in a big way in 2013 it fell back again in 2014.
This is exactly what I needed, thanx!!! Are we witnessing disintegration? I won't be sleeping for approximately 7 days I'm telling you now!!
Interesting. Looking at this figure:
arctic.atmos.uiuc.edu/cryosphere/IMAGES/seaice.area.arctic.png
Northern sea ice is down about 2 million square kilometers since 1979....
Okay, this post just went completely off of the rails. I read in Forbes that total polar ice extent has decreased by less than 10% since 1979. Of course, we are talking about Arctic ice here, and the Antarctic is completely different.
I guess it is correct to say that sea ice area and extent are far less sensitive to changes in temperature than is sea ice volume. That sets up an insidious tipping point, doesn't it? We've lost maybe half of the Arctic's ice volume, but that change in albedo has hardly begun to take effect.
Then again, Antarctica is gaining ice which will make it more reflective. How does that affect the overall balance?
If we have a much less reflective Arctic, but a more reflective antarctic, what are the implications of the uneven heating of the planet?
Hi folks. I'm trying to get my head around the climate change science. I tend towards being sceptical, I am open to updating and correcting mu opinions. There's been a lot of sensationalism about this topic, and the reporting has flip-flopped all over the place for years. So I ran across this video on youtube that seems worthy of consideration. If any of you have some time to have a look and share your thooughts, I'd be grateful. Thanks.
mobile.wnd.com/2015/08/mankind-threatened-by-global-cooling-not-warming/#ooid=MzYmo2dzpIBBM5k69b8gzRMIrdpIrtFQ
ringingrocks... This is probably not the appropriate thread to be asking general questions about climate change. This thread is specific to Arctic sea ice. I will post a response on the "Empirical evidence" thread.
Rovinpiper - Look at this figure from http://nsidc.org/arcticseaicenews/charctic-interactive-sea-ice-graph/
Arctic sea ice extent is currently over two standard deviations below "normal". Now click the "Antarctic" tab and take a look at this one:
Antarctic sea ice extent is currently below "normal". Now consider the respective locations of all that sea ice when the sun is shining on it. The ice at the South Pole is more than a meter thick on midsummer's day!
Can anyone comment on this:
http://www.climatedepot.com/?mc_cid=b0364d923e&mc_eid=1bbdb183a9
Based on MASIE data, they claim not much decline recently.
Multisensor Analyzed Sea Ice
See here for discussion of this. In particular, check the MASIE documentation page and what it has to say about the applicability of the data sets for analyzing trends. Then look at some datasets that are fit for purpose and draw the obvious conclusions about reliability of climatedepot.
So, many people think that the ice has recovered because of the extent of the ice without considering about the volume. The point is that we need to look at the volume to measure how much there really is. According to the thick ice graph, it is great concern that thick ice takes a lot more heat to melt and it is disappearing so fast.
“Although a thin layer of ice doesn’t tell us much about the overall state of ice loss at the Arctic, it does tell us a great deal about Albedo, the property of ice to reflect heat back into space. When the sea ice diminishes, more heat passes into the oceans. That heat melts the thick ice and speeds up the melting of thinner sea ice, which in turns allows more heat to accumulate in the oceans.” My question is that, does the thickness of the ice really matter to how well it can reflect the heat? If it is thicker will it be better to reflect the heat or not so much difference?
Bearling, the sea ice extent has not recovered at all. Although your remark about volume does have some validity, anyone attempting to argue that see ice extent has "recovered" is taking you for a ride. See NSIDC for the latest news.
bearling, that's right. No, the thickness of sea ice doesn't affect its ability to reflect heat very much, it affects its ability to melt.
I've seen a few mentions elsewhere that arctic ice volume is at near record highs for last 15 years.
Does anyone know what has triggered the change from being well below 2004-2013 average in May to now being well above average?
I'm a complete amateur so I was making guesses of cloud cover (I beleive there was an unusual weather system in may) or volcanic activity (Kilauea, vanuatu or fuego eruptions) but it would be nice to have a clearer idea of what is happening.
BeesKnees - I dont where you are getting your "elsewhere" information on arctic ice volume, but I would suggest that it is either extremely unreliable or you have misinterpreted.
Here is the arctic ice volume from PIOMAS.
Source: Polar Science Center
It is higher than 2016, 2017, 2012, but weather causes year to year variability. The trend in ice volume is pretty clear in picture:
Well below 2003 level.
Note that BeesKnees said "arctic ice volume", not sea ice volume. Scaddenp has illustrated how BeesKnees statement about the past 15 years is not true with respect to sea ice.
Someone may be tempted to say "what about Greenland?" You can use the search tool (top left) to find SkS articles on "Greenland Ice". BeesKnees statement is also not true for Greenland ice.
The next stop on the denial train would be to shift the goalposts to snow cover. You can search for northern hemisphere snow, too. Turns out that it also is decreasing.
For more up to date figure on Greenland Ice volume, try this
Source NSIDC.
We could have greater clarity if BeesKnees would give more detail on his/her source.
Sorry I wasnt clear, I meant sea Ice.
this is the source I have been using
http://polarportal.dk/en/sea-ice-and-icebergs/sea-ice-thickness-and-volume/
My concern is that this information is being misused to deny climate change and wondered if the reason for the difference this year was easily explained.
[DB] In addition to Scaddenp's comment earlier, Arctic sea ice volume continues its long-term decline in both minima and maxima:
While year-to-year variations exist, the long-term trend in volume and extent nevertheless continues to decline, despite the focus by some on those short-term periods:
BeesKnees,
I looked at your reference. They provide this graph:
The Danish Polar Portal is a legitimate science data source. It seems to me that there are several issues with using their graph.
Ice volume is very difficult to measure. The PIOMAS model is generally considered the best. It agrees fairly well with satalite measurements of sea ice volume. While the Danish site is OK, it seems to me that the people you are talking with selected it thinking that it supported their point. That is cherry picking.
Reading the tags I see that the baseline volume is the average from 2004 to 2013. I see from the PIOMAS graph that the sea ice volume started decreasing before 1980. If you go to the Arctic Sea Ice Graphs page, they have this graph:
Close examination of this graph shows that sea ice extent started to decrease in about 1950 when it was 8 million km2 and in 2000 was about 6 million km2. The thickness and volume would also have decreased over that time period but I could not find any data. Current forecasts suggest a minimum of about 4.6 million km2 this year.
The baseline your graph uses of 2004-2013 includes the record setting low years. It is really not much of a claim that the sea ice has returned to the level it was at 8 years ago when it has been in a long term decline for 70 years.
Even accepting that the current volume is similar to the average from 2004-2013, the PIOMAS data shows that from 1980 to 2017 volume at the minimum decreased from 17 million km3 to 4.5 million km3. This year is similar to last year so it is about 1/3 of the volume from 1980 which was lower than 1950.
I would like to say that I am in the best physical shape of my life because my average weight for the past 10 years is 8 pounds more than I weigh today. Unfortunately, 35 years ago, when I was in good shape, I weighed 40 pounds less than I do now.
In summary, your source data is OK but PIOMAS is usually used. The baseline is not the "long term average", it is a recent average. Sea ice volume has been decreasing for 70 years, a little noise does not mean a recovery.
Bees Knees:
Neven at the Arctic Sea Ice Blog discusses PIOMAS sea ice volume every month when the data comes out (link is to a discussion of the May data). Neven is not a scientist but is very well informed. His posts are easy to read and generally even handed. See if his post answers your questions about why the ice melt has been below average this year.
At the Sea Ice Forum there is a free wheeling discussion of sea ice data.
Bees Knees @97,
The lack of rogour encompassed by the DMI modelling is perhaps best seen in that they wind-the-handle once a day to update their results while PIOMAS (who are ever conscious that their modelling could be deficient and thus checking for corroberating data from the likes of CryoSAT) run a monthly update. And in that regard, this means we cannot yet compare the DMI 2018 results that hae "crossed the line" with their PIOMAS equivalent as this "crossing the line" has only occurred through June.
However we can compare the June to August 2014 DMI graphed results with the equivalent PIOMAS results, this relative to a 2004-13 mean. The DMI graph shows June 2014 somewhat icier than the 2004-13 average and July & August both some 2,000 cu km icier. PIOMAS shows a meltier 2014 relative to the 2004-13 average with only August 2014 marginally icier than that 2004-13 average. Jun -1,500 cu km, Jul -600 cu km, Aug +100 cu km.
So the upshot is we have a situation handed the denialists by DMI's light-weight modelling (who won't be the least bothered) providing a less-embarassing-than-normal excuse for them to troll their nonsense through the media. Yet denialists are not shaken by the embarassment of being continually wrong so it isn't something to be too exercised about.