Comparing past climate change to recent global warming
What the science says...
Climate Myth...
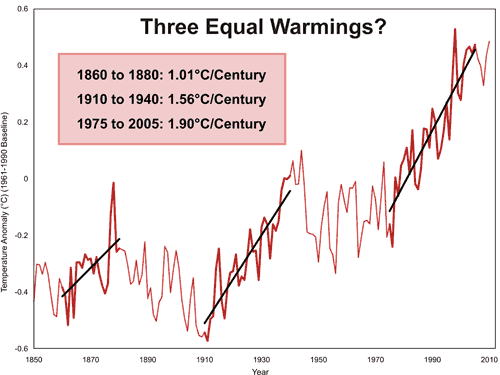
It warmed just as fast in 1860-1880 and 1910-1940
“In fact, the rate of warming from 1975-2001, at 0.16 °C per decade, was the fastest rate to be sustained for more than a decade in the 160-year record, but exactly the same rate occurred from 1860-1880 and again from 1910-1940, when we could not possibly have had anything to do with it.” (Christopher Monckton)Let’s have a look at some warming rates of the periods of interest from several different temperature records:

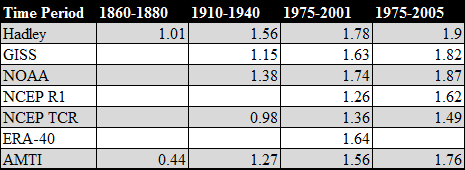
Table 1: Rate of warming for given indices in °C/century.
First we can conclude that Monckton's statement that 1975-2001 was the fastest warming rate for longer than a decade is absolutely wrong as a much higher rate is demonstrated for 1975-2005 in row 5. Secondly, to compare the three periods in Table 2, the only index which covers that period is Hadley, making his 1.6°C per century number wrong for 1975-2001 as it is actually much higher at 1.78°C per century.

Based upon the evidence presented here, he cannot support his statement that 1860-1880 had a similar warming rate as it was demonstratively lower than the 1975-2001 warming rate and nearly half the 1975-2005 rate. Finally, regarding the 1910 to 1940 warm period, evidence presented here suggests that only 1 out of the 4 major indices indicates a rate of warming within 0.25°C per century and none within 0.2°C. His claim that the rates are similar is dubious at best.
Last updated on 31 January 2011 by robert way.


 Arguments


Which shows a discontinuity in the temperatures that coincides with the scrapping of a number of stations, most of which were apparently in Northerly locations. Looks convincing doesn't it, until you plot the actual annual surface temperature record for the same period
Hey, what happened to the huge leap in 1990? The answer is simple, the temperature plot used by McKitterick is merely an unweighted average of all of the station data, whereas climatologists use an area weighted average in order to avoid the bias that would otherwise be caused by the fact that there are many more stations in the industrialised north than elsewhere. So although the number of northerly stations was cut in the 80s/90s, it doesn't introduce a warm bias, because of the way the averaging of stations is done by the climatologists who do actually know about these things.
McKitterick's plot is a good indication that most of the stations that were dropped were in colder locations and that is about it. But we knew that anyway as we knew where they were already!
This was one of the things that tripped my trollometer, this particular canard was was flambéd long ago.
[DB] Nice teaching moment. Since this is clearly a demonstration, Alec has changed his IP address from his home country in South America to this:
IP Address Location
IP Address 122.85.40.120
City Beijing
State or Region Beijing
Country China
ISP China Tietong Telecommunications Corporation.
Latitude & Longitude 39.900000 116.413000 MapG MapV
Domain CHINATIETONG.COM
So the moral is this: If it acts like, Poptech, sounds like Poptech and argues like Poptech, it could be Poptech. I will confer with John on this.
N.B. note that I have just argued against a point that would have strengthened my argument (had I though it was correct). When did you last see that from the "skeptics" here. ;o)