


 Arguments


Water levels and solar activity
What the science says...
There seems to be evidence for a link between solar activity and water levels. However, more direct comparisons between solar activity and global temperature finds that as the sun grew hotter or cooler, Earth's climate followed it with a 10 year lag - presumably due to the dampening effect of the ocean. Also found was that the correlation between solar activity and global temperatures ended around 1975, hence recent warming must have some other cause than solar variations.
Water levels correlate with sunspots
Several studies have found a link between solar activity and water levels. A South African paper has found a 21 year cycle synchronous with the solar cycle (Alexander et al. 2007). Another paper finds a link between galactic cosmic rays and precipitation in the Midwestern USA (Perry 2007).
There is no denying there's a strong link between solar activity and climate - both with the short term (eg - the 11 year cycle) and long term (eg - decadal changes in solar activity). In fact, the close correlation between sun and temperature is what tells us the sun can't be causing recent global warming as solar activity has been steady since the 50's. So what do studies into precipitation tell us?
Solar cycles and South African water levels
Alexander et al. 2007 finds a strong correlation between water levels and sunspot numbers. But the correlation is short term - there is little to no correlation in the long term trends.
For example, there is no long term trend in Lake Victoria's levels from 1900 to 1940 when solar activity showed long term increase. Any short or long term correlation breaks down between 1930 to 1970. Next, to obtain correlation over 1968 to 2005, they filter out a 29mm per year trend where there's been no long term solar trend.
In fact, all the case studies show short term correlation with solar cycles but no long term correlation with decadal solar trends. There's so much noise due to tributary inflows, outflows, sluicing, rainfall and evaporation that while short term correlations with the solar cycle are useful, determining or finding meaning in long term trends is problematic. In short, measuring water levels is a roundabout way of determing the sun's effect on long term global warming.
Galactic cosmic rays and Mississippi River streamflow
Perry 2007 purports to link solar activity and Mississippi River flow. The physical process is as follows - the 11 year solar cycle causes a cycle of ocean heat somewhere between the western Pacific Ocean and the Indian Ocean. The heat cycle is transported via the ocean conveyor system, emerging 3 decades later in the North Pacific Ocean. Sea surface temperatures pick up the cycle which travels via a low-level atmospheric vorticity, affecting regional rainfall in the US midwest.
What is the evidence to suggest the solar signal has emerged intact through this decades long process? The authors discovered a high correlation between Total Solar Irradiance (TSI) and river flow - the correlation is highest when TSI was offset 33 years.
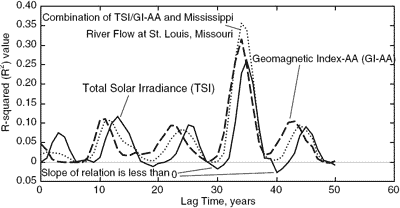
Correlation for different lag times between TSI, Geomagnetic Index-AA and Mississippi River flow
The idea that the amplitude and phasing of the solar signal is preserved throughout a 33 year, multi-step process sounds far-fetched. Even the author concedes "This lag time was unexpected, and its validity questioned." This is especially the case when you consider correlation breaks down along the way - amplitudes don't correlate between tropical Pacific ocean temperatures and North Pacific ocean temperatures.
It's no coincidence that the correlation peaks occur at 11 year intervals - the same period as the solar cycle. As time lag increases, the solar cycle synchronises with the river flow cycle every 11 years. As for the high correlation at the 33 year mark, this may be a statistical anomaly or there may be a physical link. Perhaps the dampening effect of the ocean smoothed out the 11 year signal but retains the long term trends. If so, the basic thesis if not the specifics of the paper may be true - the ocean absorbs heat then releases it again 30 years later.
What does this mean for the global warming debate? The answer is to look for a correlation between solar activity and global temperature and if so, is there a lag? In fact, such a study has been done.
The link between solar activity and global temperature
In 2005, scientists from Finland and Germany compared solar activity & temperatures over the past 1150 years and found a strong correlation between solar activity and global temperature (Usoskin et al. 2005). They found the correlation was highest when temperature lagged solar activity by 10 years.
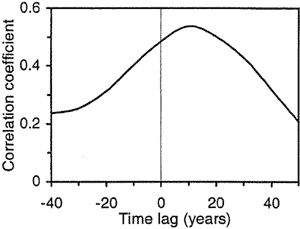
Correlation between TSI and temperature for different time lags
In other words, as the sun grew hotter or cooler, Earth's climate followed it with a 10 year lag - presumably due to the dampening effect of the ocean. The other crucial discovery was the correlation between solar activity and global temperatures ended around 1975. At that point, temperatures started rising while solar activity stayed level. This led them to conclude "during these last 30 years the solar total irradiance, solar UV irradiance and cosmic ray flux has not shown any significant secular trend, so that at least this most recent warming episode must have another source." More on the sun...
Last updated on 26 June 2010 by John Cook. View Archives


Climate Myth...