


 Arguments


Climate choice: stable or disrupted climate
What the science says...
Continued greenhouse gas emissions at or above current rates would cause further warming and induce many changes in the global climate system during the 21st century that would very likely be larger than those observed during the 20th century. (source: IPCC 2007)
Climate Myth...
CO2 limits won't cool the planet
"[CO2 limits] will not make a difference for 1000 years. So this is a government which is proposing to put at risk our manufacturing industry, to penalise struggling families, to make a tough situation worse for millions of households right around Australia. And for what? To make not a scrap of difference to the environment any time in the next 1000 years." (Tony Abbott)
Skeptics have argued that if reductions in CO2 will not cool the planet for hundreds of years, then it is not prudent to cut emissions and put any burden on a fossil-fuel-driven economy. But does this make sense?
A choice between sustained temperature increase and doing nothing is not, unfortunately, the choice we are facing. The real choice we face is between decreasing CO2 emissions (in which case temperatures will still warm a bit more and then stabilize), and letting CO2 emissions go and and on (in which case temperatures will continue to rise and rise). In the future, when technologically and economically feasible, it may be possible to withdraw carbon from the atmosphere, perhaps with increasing tree growth or chemical "scrubbing". But this is just a goal for the future.
According the IPCC, from the Summary for Policy Makers:
- Continued greenhouse gas emissions at or above current rates would cause further warming and induce many changes in the global climate system during the 21st century that would very likely be larger than those observed during the 20th century.
- Anthropogenic warming and sea level rise would continue for centuries due to the time scales associated with climate processes and feedbacks, even if greenhouse gas concentrations were to be stabilised.
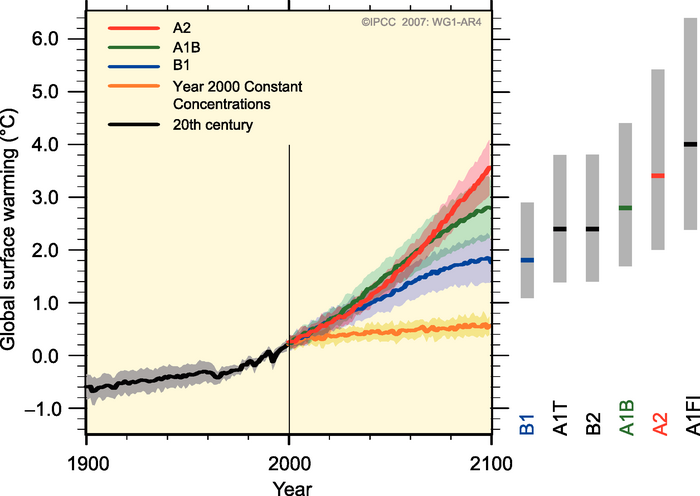
Figure: Global surface temperature projections for IPCC Scenarios. Shading denotes the ±1 standard deviation range of individual model annual averages. The orange line is constant CO2 concentrations at year 2000 values. The grey bars at right indicate the best estimate (solid line within each bar) and the likely range. (Source: IPCC). Emissions scenarios
This is one skeptic argument where one must wonder if some of those who wish to prevent action on climate change really understand what the argument is about.
Basic rebuttal written by grypo
Update July 2015:
Here is a related lecture-video from Denial101x - Making Sense of Climate Science Denial
Last updated on 19 July 2015 by MichaelK. View Archives


Aaron Davis @25,
If you are minded to continue with this farce, you may find this web utility from NASA useful. It will show you that over the period of reduced arctic CO2 which would impact the region perhaps 9e18j, your grand analysis would in "removing confounding effects," fails to tackle some 2,700e18j of confounding insolation. While this value will be reduced due to albedo (which itself will not be consistent for the comparisons you attempt), it might be worth noting that it will not just be the average insolation over the period 1979-2017 confounding your analysis but even the variation in insolation over the period 1979-2017 will have greater magnitude than the effect you attempt to analyse.
MA Rodger @26
Albedo is something I have data for [Kukla_and_Robinson_1980 table 2]. I've calculated the average albedo from
While the Cold months (in the dark mostly have high Albedo about the same from North to South, the Warm months have actually higher albedo in the North (35 vs 21%). Since this is also when CO2 is low due to plant uptake in the North compared with the South where CO2 is at baseline changes onlt 1 ppm, a higher Nothern albedo would move the temperature in the same lower direction as the lower Northern CO2. So, if anything albedo and CO2 combination, should overstate the seasonal effect over CO2 alone.
I am not familiar with how you arrived at the 9e18 Joules corresponding to 15 ppm change in CO2 figure. It is quite low compared to the total annual global heat accumulation figure I've been using (12.5e21 Joules per year). If that's all we would get out of all the cost and effort to reduce CO2 over the next 5-10 years by 15 ppm, it appears you would agree it's hardly worth the effort.
If the variations in the amount of energy reaching the ground (insolation) varies over periods more than a year, the analysis should still be good, as I am comparing differences over the same year, but that is something I'd like to verify as well. The idea here is not to get a 15 ppm sensitivity. It's hard enough to justify the utility of the low confidence ECS analysis. My point here is to support the principle hypothesis of this section "CO2 limits won't cool the planet", which I gather from your remarks you agree with, to at least some extent.
I appreciate your interest and share your objective to seek the truth.
Aaron Davis @27,
I assume you have not carried out even the most simplistic of calculations to support you assertion "So, if anything albedo and CO2 combination, should overstate the seasonal effect over CO2 alone." If you had, you would have noticed that, while the impact of surface albedo will accentuate your elusive little CO2 effect, if you calculated it properly even for that pair of two-month-periods, you would see that during the periods and zones in question, insolation & albedo are far bigger effects than your teeny weeny dip in CO2. The insolation works against the CO2 effect and is about 100 x bigger (+13Wm^-2 compared with -0.14Wm^-2). The Surface Albedo effect is bigger still being about 300 x teeny weeny CO2 effect but additional to it. So the combination of Insolation and Surface Albedo sits 200 x bigger than the teeny weeny effect you attempt to measure (-27Wm^-2). Of course the atmospheric albedo is still to be accounted as has the imbalances in preceeding months. And there is still a whole pile of other factors beyond solar energy input.
I must stress that the reason your teeny weeny CO2 effect is so insignificant is not because CO2 forcing is insignificant or even that 15ppm CO2 is entirely insignificant. It is because the 15ppm CO2 dip you attempt to measure is only operating for a couple of months before you attempt to measure its impact.
The 9e18j value you ask about reflects the size of the zone impacted by the dip and its accumulative impact by the time of your temperature measurement. It is not a global figure. Why would it be? (The annual global forcing from -15ppm ΔCO2 would today amount to 2,250e18j, an effect that is far from insignificant.) That you apparently see some notion mirroring your own denialism in my comments is entirely illusory on your part.
Yes, I have not carried out the simplistic calculations you allude to. Please tell me where I can find acceptable, relevant and sufficient data to support the notion that 2.250e18j per year of energy accumulation is attributed to CO2 concentrations since before the industrial revolution. Is this a simplistic calculation as you state as fact, or an artifact of a chaotic climate model, or an artifact from removing all other reasonable causes? Please be precise in your answer.
Regarding Insolation, we both have access to Monthly Latitude Insolation and a simplistic excel program you can use to reproduce the following assessment of the Other Effects (Aaron Davis @16). The Other Effect of Insolation increases from -4.308 Wm-2 in 1979 to +2.43 Wm-2 in 2017. This is the difference bewteen Antarctic Warm less Artic Warn, less the difference Antarctic Cold less Arctic Cold months. The positive slope of 0.18 Wm-2 is due principally to the 0.2% increase in spatial angle between vernal equinox and perihelion of the orbit, as you will see from the headings on the 2 tables. One way to remove this effect would be to limit the data to 2003 +/- 13 years.
Thank you for your continued interest and insight.
[TD] Read the Intermediate tabbed pane, then the Advanced tabbed pane, here. Then read this post by Dana. Then this post by Michael Tobis. Then for details, read IPCC's AR5, Working Group 1, Chapter 10, Attribution.
"The annual global forcing from -15ppm ΔCO2 would today amount to 2,250e18j, an effect that is far from insignificant." Sorry I have again miss-read your statement. What is the source of this rather impressive figure. Is that per year over the entire globe? Would 15 ppm ΔCO2 be responsible for 18% of the entire annual global accumulation of energy of 12.5 ZJ/yr? That would be a remarkable result if it were true.
Aaron Davis @30.
The climate forcing from ΔCO2 is in no way contentious. It is a matter fo physics.
A doubling of CO2 will result in a forcing of 3.7Wm^-2. Thus a ΔCO2 equal to 15ppm/400ppm = 3.75% would result in a forcing of 3.7 x 0.0375 = 0.139 WM^-2. The globe has an area of 510e12 m^2. A year comprises 8766hrs x 3600sec. Thus a forcing of 1.139 WM^-2 will result in an annual Δenergy of 0.139 x 510e12 x 8766 x 3600 = 2,237e18j/yr. (This assumes my abacus has retained all its beads which is not something I can always gaurantee but in these circumstances I am confident that I am correnct even though I have just returned from the pub.)
MA Rogers @28 For the 15+/-1 ppm chage the dF=-0.2 Wm-2, the change in temperature I am looking for in the seasonal analysis is between -0.11 and -0.24 oC based on the 0.54/ to 1.2oC/ due to doubling CO2. Actually the global warming by year 2017 figure shows just a 0.027oC/year from 1980 to 2017. If I use 26 occurences of the seasonal effect the error in the mean is reduced by a factor of 5, so if the monthly averages are accurate to 0.01oC, a the seasonal effect should be well above the noise. As further confirmation consider
Observational determination of surface radiative forcing by CO2 from 2000 to 2010
"Here we present observationally based evidence of clear-sky CO2 surface radiative forcing that is directly attributable to the increase, between 2000 and 2010, of 22 parts per million atmospheric CO2. The time series both show statistically significant trends of 0.2 W m−2 per decade "
Please consider that if 22 ppm difference in this paper yields a 'statistically significant result of 0.2 W m-2' over a decade, it may possible a 15 ppm seasonal variation between Arctic CO2 concentration could also be significant.
[TD] It doesn't seem possibile that decades of model based analysis of radiative forcing could not be validated by some clear and reasonable approach like a standard prediction error technique, but it seems like this is the case. Every article you suggest has as a basis a model manipulated to fit historical data, but seems to ignore how these models performs 10-20 years later. This whole argument reminds me of my work with ephemerides when I worked with Lockheed. For years we lived with a repeating range error of 30 ft. bulge in the range error. When I found and corrected the screwed up the polar wander transformation, the one rev prediction error did not change much because they recalibrated each rev, but try to predict 3 or 4 revs into the future and the calibrated model produced huge errors. The lesson learned is that fitting the data to an incorrect model can work for a while, but then diverges. Please provide a reference where the authors, rather than refit the model parameters to new data, really went back and fundamentally changed the model to predict 10 years out. To correct errors that far out it may be necessary to consider at least some of the a few serious "deniers" like The Atmospheric Thermal Enhancement - Dr. Ned Nikolov who establishes a pressure component to atmospheric model for global warming.
[TD] Wow, you're a fast reader, especially for someone who just a few days ago misunderstood the second law of thermodynamics! That IPCC chapter I pointed you to has a lot of journal article references you say you've read, plus you had to take a bunch of basic classes so you could understand those articles. I'm really, really impressed.
Funny how all your sudden expertise in physics failed to help you recognize that Nikolov's articles are gibberish. Not just wrong, but gibberish. Even actual serious fake skeptic Roy Spencer acknowledges they are gibberish. Eli Rabbett also disassembled Nikolov's claims. And there are two posts at the aptly named And Then There's Physics. David Appell added another reason Nikolov is wrong. The bottom line: Your car's tires are not warmer than their surrounding air merely because the air pressure inside them is higher than the air pressure outside. That would violate the first law of thermodynamics. Oh, but maybe that's okay with you since that would fit your understanding of the second law of thermodynamics.
Aaron Davis @32.
You suggest "it may possible a 15 ppm seasonal variation between Arctic CO2 concentration could also be significant. " A look at the lower graph @19 suggests the Arctic experiences an effective 8ppm drop in CO2 over a six month period. In terms of long-term energy budgets that is equal to 4ppm permanently. As the cycle would have existed before AGW (being a natural phenomenon), such a reduction in CO2 globally would amount to a temperature change of 0.04ºC with today's CO2 level & ECS=3. (As you appear to grasp the concept, I here adjust for the logarithmic nature of CO2 forcing.) Due to the increase in CO2 since 1979, today's 0.04ºC has reduced from 1979's 0.05ºC.
The problem we face Aaron Davis is that this 0.04ºC (which will require some adjustment as it is not global) is not what you are attempting to measure.
Consider the following.
A row of seven stout wooden chalets are heated by identical electric fires 24-7-365. But an electrical fault results in all chalets losing power for a portion of the time. In the first chalet it is 1 millisecond every six milliseconds, in the second it is 1 second every six, in the third one minute in six, then one hour in six, one day in six, one month in six, one year i six.
On average, each chalet suffers the same loss of power and they will all experience a roughly similar drop in average long-term temperature. Losing one sixth of their heating, that drop is significant and is analagous to what you suggest @32 is considered as "could also be significant."
However, this long-term average is not what you attempt to measure. You are concerned with the wobble in temperature. In our analogy, the wobble will vary greatly chalet-to-chalet. In chalet one it will be undetectable. In chalet six, the temperature will wobble from that of an unheated chalet to that of a fully heated chalet. Using a 15ppm value, your calculation will be perhaps as chalet three. But you are expecting it to be chalet six or seven.
And your numbers "the 0.54/ to 1.2oC/ due to doubling CO2" appear to be nonsensical.
[snipped]
[TD] You're well past your grace period. In future I will simply delete your comments that are off topic, that repeat your previous claims without addressing responses including references you've been given, and that are sheer nonsense.
With the back-&-forth in-thread above between myself & Aaron Davis presently stalled/snipped/ended, it would perhaps be proper to set out a more grown-up comparison of the Arctic/Antarctic temperature cycles. This relates to the 'second' of the three existential issues facing Arron Davis's grand analysis. Polar climate is not well enough defined by the "slant path sun angle" for his analysis to work. (The other two existential issues are described @17(1) & (2)) A comparison @22 showed that "slant path sun angle" (latitude) for 52N is not the defining feature of the difference between Feb/Mar and Aug/Sept average temperatures. Of course London & Irkutsk at 52N are far from the poles, so quick look at polar temperatures and what drives them is what is being attempted here.
The peak-to-peak temperature range at the actual poles is very similar North and South although the relative length of summers (longer in the North) and winters (longer in the South) would evidently prevent an Aaron-Davis-type analysis.
And of course, just as at 52N, in the polar regions under analysis N/S 60º-70º "slant path sun angle" does not fully define the energy fluxes. This graph from Aaron Donohoe plots the various flux anomalies for N & S polar regions for each month (the exact latitudes of the zone represented are not given).
In this graph, the yellow trace CTEN (atmospheric Column Tendency) shows energy absorbed by the atmosphere and evidently has a bigger wobble North than South with North twice the size of South. (But note it will be the integrals of these yellow curves that Aaron Davis is attempting to measure.)
CTEN is the net imbalance after all the other energy fluxes are accounted for. The largest of these other fluxes, ASR (absorbed solar radiation or "slant path sun angle") looks similar North&South peak-to-peak but measuring it Feb/Mar-to-Aug/Sept, the Northern ASR has a bigger range by about 7%. Similarly, SHF (Surface Heat Flux) is 20% bigger, and the other two, Out-going Longwave Radation and MHT Meridional Heat Transfer (warm winds minus cold winds), are both about 100% bigger. These differences result in CTEN being somewhat out-of-phase with ASR and CTEN Feb/Mar-to-Aug/Sept 100% bigger in the North.
The larger Northern temperature range suggested by CTEN (& shorter southern summers) is born out by surface temperature data. A bigger Northern temperature range is evident within the monthly anomaly base data provided in BEST station data. Thus a very quick and dirty analysis (stations roughly coastal at ☻74.74 S, 24.41 W , ☻69.92 S, 79.48 E, ☻66.70 S, 141.57 E, ☻73.13 S, 94.15 W , ☻71.53 N, 157.18 W, ☻73.13 N, 72.00 E, ☻71.53 N, 30.42 W, ☻71.53 N, 157.18 E) yields a Northern peak-to-peak temperature range 40% larger than the Southern and a Feb/Mar-to-Aug/Sept temperature difference 150% larger.
Thus, while ASR is the biggest input into polar seasonality, it is far from being the overwhelming influence. This second graphic from Aaron Donohoe (from the same source) presents the zonal Jan & Jul anomalies for the northern hemisphere. It shows the difference between Jan-Jul atmospheric zonal flux anomalies (MHT in pink) peaking in the 60N-70N zone (0 .87 to 0.94 on the graph) with the MHT winter/summer warming half that of the 250Wm^-2 ASR summer/winter warming. Yet in all this, Aaron Davis assumes his grand analysis somehow will find the temperature signature of a CO2-induced -0.2W^m-2 cooling, an impossible task.
