


 Arguments


How much will sea levels rise in the 21st Century?
What the science says...
| Select a level... |
 Basic
Basic
|
 Intermediate
| |||
|
Sea levels are rising faster now than in the previous century, and could rise between 50cm to 1.5 metres by 2100 |
|||||
Climate Myth...
Sea level rise predictions are exaggerated
"Professor Niklas Mörner, who has been studying sea level for a third of a century, says it is physically impossible for sea level to rise at much above its present rate, and he expects 4-8 inches of sea level rise this century, if anything rather below the rate of increase in the last century. In the 11,400 years since the end of the last Ice Age, sea level has risen at an average of 4 feet/century, though it is now rising much more slowly because very nearly all of the land-based ice that is at low enough latitudes and altitudes to melt has long since gone." (Christopher Monckton)
Measuring Sea Levels
Sea levels are rising due to thermal expansion and melting of land-based ice. Global warming is causing the oceans to absorb a lot of extra heat (up to 90%). This makes the volume of water expand, and sea levels rise. The Greenland and Antarctic ice caps, and many of the world’s glaciers, are all slowly melting. The runoff feeds into rivers and directly into the oceans. This too adds to sea levels.
Prior to the use of satellite systems, measurements were taken using tide-gauges, devices that measure the height of a water level relative to a fixed point on land. Global estimates of sea level rise were subject to substantial differences in measurement from different parts of the world.
Sea levels change all the time. They are affected by seasons, astronomical tides, storm surges, currents and density, among other influences. Tidal gauges reflect these short term influences, introducing a large margin of error.
The IPCC Fourth Assessment Report described studies that estimated sea level rise for the 20th century between 0.5 and 3.0 mm a year. The most likely range, according to the IPCC, was between 1.0 and 2.0 mm a year.
Satellite altimetry since 1993 provides a more accurate measure of global sea level rise. Three different satellites take measurements: TOPEX/Poseidon (launched 1992), Jason-1 (launched 2001) and Jason-2 (launched 2008).
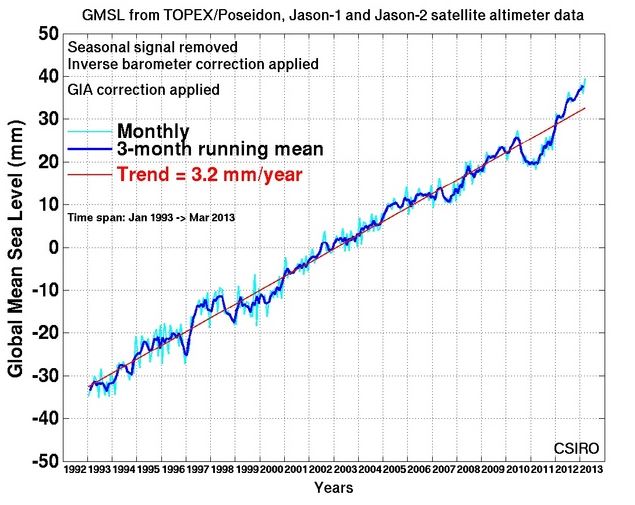
Figure 1: Source - CSIRO
The IPCC projections are derived from climate models. Using both tide gauge and satellite data, we can see that sea levels are rising. Unfortunately, sea level rise is already tracking the worst-case projections, as this graph shows:

Figure 2: Sea level change. Tide gauge data are indicated in red and satellite data in blue. The grey band shows the projections of the IPCC Third Assessment report (Allison et al. 2009).
In fact, the climate models underestimated the rate of sea level rise because the rapid melting of the ice sheets and glaciers was not incorporated in the last IPCC report. (It was left out because the data were not considered sufficiently robust).
Damaging Potential
Rising sea levels are widely considered to be the greatest threat posed by climate change. They threaten low-lying countries with inundation, forcing inhabitants to migrate. Coastal cities and ports could be flooded, as could cities sited near tidal estuaries, like London. Many nuclear installations are built by the sea so they can use sea water for cooling.
The potential for sea level rise is enormous. This is because the ice caps - Greenland and Antarctic - contain huge amounts of fresh water - around 70% of all the freshwater on Earth. Estimates suggest that if the Greenland ice sheet was to melt away to nothing, sea levels would rise around 6 metres. To put that a different way, a loss of just one per cent of the Greenland ice cap would result in a sea level rise of 6cm.
If the West Antarctic Ice Sheet (WAIS) were to melt, this would add around 6 metres to sea levels. If the East Antarctic Ice Sheet (EAIS) were to melt as well, seas would rise by around 70 metres.
In a process that is accelerating, all three ice caps are losing mass. While nobody is suggesting any of the ice caps will melt away to nothing, only a small amount of melting would cause great problems.
A 1% loss of ice from these three sources would produce a likely increase in sea levels of around 76cm. With the thermal expansion implied by such melting, and contributions from melting glaciers, the oceans would actually rise far more.
Predictions for future sea levels
Future sea level rises depend on a number of factors. The amount of CO2 emitted will determine how much global warming takes place. The amount of ice that melts will vary according to the amount of global warming. The same is true of thermal expansion.
Previous estimates of sea level rise have been based on a set of possible outcomes called emissions scenarios. These theoretical scenarios range from emissions which fall very quickly, to emissions that continue to rise even faster than they have already. Scientists then calculate possible outcomes for each scenario.
In the next IPCC report (AR5), due in 2014, a new method has been used. Emission scenarios have been replaced by Representative Concentration Pathways (RCP). Four trajectories were chosen, based not on emissions, but possible greenhouse gas concentrations in the year 2100. From the concentrations, the RCPs project a ‘forcing’ for each pathway (the amount of warming); 2.6, 4.5, 6.0, and 8.5 Watts per metre squared. Each pathway is named after it’s forcing e.g. RCP4.5. The lowest emission scenario is also referred to as RPC3PD, because it posits a peak warming of 3 w/m2 by 2070 (~490 ppm CO2 and equivalents), and a reduction to 2.6 w/m2 by 2100. (PD stands for Peak/Decline).
A draft version of the next report from the IPCC (AR5), due for publication in 2014, was recently leaked. Although the information is subject to change, the draft report says sea levels are likely to rise by between 29 and 82 centimeters by the end of the century, (compared to 18-59 centimeters in the 2007 report).
Other recent studies have projected comparable sea level increases. Jevrejeva (2011) for example modelled sea level rise using RPC scenarios. This table shows best and worst cases (RPC3PD and RCP8.5), with two in between. The figures for each projection are listed in this table:
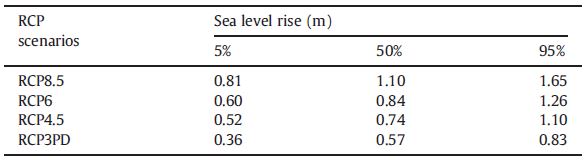
Table 1: Projected sea level rise (m) by 2100 for the RCP scenarios. Results presented as median, upper (95% confidence interval) and lower (5% confidence interval) limits, calculated from 2,000,000 model runs. Sea level rise is given relative the period 1980–2000. (Jevrejeva 2011)
Another study (Rahmstorf 2011) obtained much the same results:
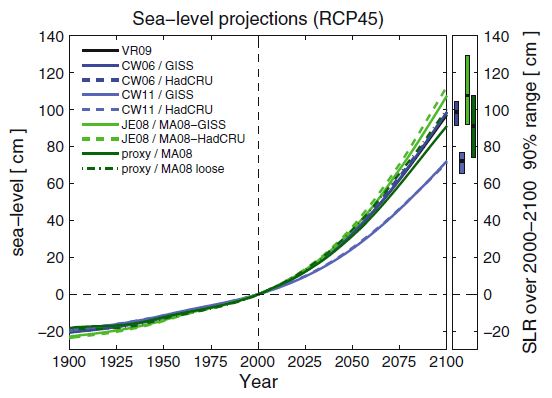
Figure 4: Sea level hindcasts and projections for different models calibrated with different temperature and sea level data. The error bars on the right indicate 90% confidence intervals (5–95 percentile, using the GISS temperature dataset); for the proxy-based projection the uncertainty is as presented in Kemp et al., 2011. (Rahmstorf 2011)
What's in the pipeline?
The 'pipeline' is a term used to describe the slow reaction of the oceans to heating (inertia). Even if we were to stop emitting greenhouse gases tomorrow, the oceans would continue to rise, driven by the heat already stored. (90% of all the sun's energy falling on the surface of Earth is absorbed by the oceans as heat). This sea level rise is said to be 'in the pipeline'.
A paper published in PNAS - Levermann (2013) - has found that greenhouse gases emitted today will cause sea levels to rise for several centuries. For every degree of warming, sea levels will rise by more than 2 meters in the next few centuries. The Earth's temperature has already risen 0.8 degrees C over pre-industrial temperatures.
Jevrejeva (2011) also found increased rates of sea level rise, even if emissions were to stabilise at 490 ppm by 2070 following the scenario in RPC3PD (RPC2.6):
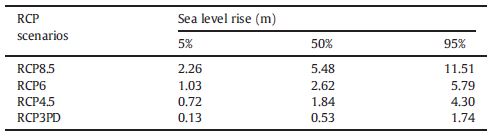
Table 2: Projected sea level rise (m) by 2500 for the RCP scenarios. Results presented as median, upper (95% confidence interval) and lower (5% confidence interval) limits, calculated from 2,000,000 runs of the model. Values of sea level rise are given relative the period 1980–2000.
Conclusion
Based on the new mid-range IPCC RCP4.5 scenario - around 650 ppm CO2 and equivalents producing a forcing of approximately 4.5 watts/metre2 - the most likely sea level rise by 2100 is betweem 80cm and 1 metre. Longer term, sea levels will continue to rise even after emissions have been reduced or eliminated.
Basic rebuttal written by GPWayne
Update July 2015:
Here is a related lecture-video from Denial101x - Making Sense of Climate Science Denial
This rebuttal was updated by Judith Matz on September 13, 2021 to replace broken links. The updates are a result of our call for help published in May 2021.
Last updated on 12 July 2015 by MichaelK. View Archives


From Tamino's post:
[the data shows the sea level rate goes up and down] "Climate deniers hate that. They want you to believe that global sea level has risen at a constant rate for the last 80 years or so at least, so they can deny the danger from even faster sea level rise in the near future. Also, the rate over the last 80 years or so has been less than the rate recently, so by claiming that there’s no “real” change they can make the claim that it isn’t even rising now as fast as it really is rising now. Perhaps the most scientifically accurate description of their approach would be: “total bullshit.”
I think that is what Tamino thinks of Curries analysis of sea level rise.
Tamino is an expert statistician who has done a lot of work on sea level rise analysis. He is especially good at time series analysis (like sea level rise data).
scaddenp @ 74
I have no idea whether they will err on the low or high side. Science I think has to acknowledge what it knows and what it does not know and policymakers have to make their decisions based upon the information at hand.
I appreciate that uncertainty tends to discourage significant action but that does not mean that we cannot ignore the uncertainty as to just what will happen. It is always easier to take the "high ground" and not take a chance but if the costs and consequences of drastic action were not themselves so uncertain then these changes would have been done long ago. There is uncertainly every step of the way. It is easy to say yes AGW is for real but how serious and what do you do about it?
Sorry, I probably should have stopped after the first paragraph.
[DB] Off-topic snipped
And funnily enough science does put the error bars on its predictions, However, as has been pointed out, you seem to advocate only on the low bar. Furthermore, action proposed is usually based on middle ground because the upper end of the uncertainty is rather unpleasant. Treating the middle ground as if it was the upper bound is not valid. Since you also tend of over-estimate the consequences of proposed action (shall we count the times since you started posting?), I dont find your position credible.
Norrism:
I mam replying to you from here where you are posting on sea level rise but that is off topic. I followed Bob Loblaw's link here and found your post on projections of sea level rise.
It appears that I rembered your post incorrectly. If you posted here on topic I would have been able to find your old post and would not have wasted my time. The moderators have warned you multiple times about posting off topic but you cannot be bothered to follow the site rules. Is that allowed in court?
Apparently you estimated sea level rise for the rest of the century at 3.2 mm/yr from the IPCC report and not 1.7 mm/yr as I thought. As the data linked above proves, the rate of sea level has increased substantially since the IPCC report was written so it is no longer relevant. You must use the current rate which is estimated at between 3.8 mm/yr here by MA Rodger (a 12.5 year average so it is less than the current rate) or 4.1 mm/yr in the linked post from Tamino using Nerem's method.
Nerem et al. give a minimum amount of sea level rise from 2005 as 65 cm, more than double your guess. You must provide a reason why you believe that the rate of sea level rise will no longer accelerate when it has been accelerating for the past 130 years. You should also justify your selection of a rate at least 20% lower than current measurements show. Remember that expert scientists predict that the acceleration will increase.
Please post your replies here where they are on topic so that posts are not lost.
To collect the bread crumbs of the responses here, michael sweet's commnet #79 refers to several comments on the "American conservatives are still clueless..." thread, ending with this comment,
My apologies for going off-thread.
Thanks Bob Loblaw for your explanation of short term variations in sea level rise based upon precipitation impacted by El Ninos and La Ninas. I can see that the "levelling off" of sea level rise shown in the second Dan Bailey graph above did occur post 2015. I am assuming that this is attributed to the La Nina which followed the 2015-2106 El Nino.
But despite my requests, I have not had any suggestions for reviewing any recent paper on what is actually happening with the WAIS.
Here is what I said with respect to WAIS in my long blog @ 58 above:
"As to the evidence of a retreat of WAIS, see Chapter 13 at 13.5.4.1:
'Although the model used by Huybrechts et al. (2011) is in principle capable of capturing grounding line motion of marine ice sheets (see Box 13.2), low confidence is assigned to the model’s ability to capture the associated time scale and the perturbation required to initiate a retreat (Pattyn et al., 2013).'
What this tells me is that there is a “theoretical” danger but so far we do not have any evidence of an actual retreat or the time frame over which this could occur. We cannot base our rational responses to AGW based upon theories which have not been supported with observational evidence."
Has anyone challenged me on these statements beyond providing me with the De Conto & Pollard paper? I have asked for further references beyond De Conto & Pollard which, on my reading, is once again, theory adding MICI to MISI. Is there any paper discussing recent observational evidence of the MISI or MICI theories?
The IPCC basically said in 2013 that the previous papers on MISI (prior to De Conto & Pollard) do not provide any time frame. Does this comment still hold valid?
Norrism:
I typed "Rignot" into google and one of the first hits was :
Rignot et al Widespread, rapid grounding line retreat of Pine Island,
Thwaites, Smith, and Kohler glaciers, West Antarctica,
from 1992 to 2011
This appears to fit what you want.
I sugggest you follow my previous recommendation and go to Rignot's personal web site (google rignot) and review his publications on this topic.
In general, it is not my job to search Google for you. Try to make more of an effort.
NorrisM @81, concerning 2 M approx. sea level rise by 2100, if the Antarctic destabilises etc.
Right now this is possible and connot be ruled out. Probabilities are small given current best understandings and observational evidence, but 2M by 2100 would be catastrophic. Because the consequences are grave, even a low possibility becomes concerning.You have to think of it in these terms.
It's not sensible to start saying perhaps a 10% possibility, or we dont have definitive evidence or enough observations so lets hope we dodge this bullet, because if we don't consequences are very severe and very costly in terms of adaptation and possible geo political ramnifications. Even 1M is bad enough.
Of course you have to weigh all this against costs of reducing emissions, but these have been demonstrated to be within the boundaries of what countries can deal with and the technology is there, at least for electricity and vehicle transport, and these are large parts of the issue and negative emissions options are also available and proven in most cases.
And appreciate whatever the rate of sea level rise is by 2100, it will continue at the same or greater rate beyond 2100.The more temperatures rise the faster ice melts, basic stuff and this is before you consider how glaciers and ice sheets respond in detail and can become destabilised.
The last decade or so has averaged about 3.5MM so thats 350mm per century at 1 degree of warming. Even drastic emissions cuts by 2050 has still locked in about 1.5 degree, and so at least 400mm probably more like 600mm by 2100. So forget about this low end scenario.
Higher temperatures can only increase the rate well above 400mm. We are definitely in 1M to 2M territory, unless emissions are reduced.
More reasons to suspect that the IPCC projections of SLR are on the low side...
Sea levels could be rising faster than predicted due to new source of Antarctic ice melting by Josh Gabbatis, Environment, Independent (UK), Apr 19, 2018
New study shows worrisome signs for Greenland ice by John Abraham, Climate Consensus - the 97%, Gurdian, Apr 14, 2018
Antarctic Glaciers Lost Stunning Amount of Ground in Recent Years by Chelsea Harvey, E&E News/Scientific American, Apr 4, 2018
scaddenp @ 78
Can we agree that my reference to .4M by 2100 is the middle ground of the Rholing 2013 paper? It is not the low end. It is the "probability maximum".
It is so easy to move off from the blog topic of sea rise level but only to reply to your comment regarding my "over-estimate the consequences of proposed action" just tell me how the Chinese or Indian farmer replaces his diesel tractor. If he has to go back to plowing his fields with animals he will be reduced to the poverty he has just recently been lifted from.
[DB] Off-topic snipped.
Norris, you can't just join issues.
NorrisM: "...just tell me how the Chinese or Indian farmer replaces his diesel tractor."
Seriously, dude. If you are going to create strawmen that absolutely every use of fossil fuels has to stop, so justification of one use is justification of all, then you are wasting everyone's time.
Bob Loblaw @ 87
As with everything in this world, "The Devil is in the details.". I would be pleased to carry on this discussion on another thread if the moderator can suggest one.
The use by the third world of fossil fuels is massive and I have assumed a large portion of this is used in agriculture and the transportation used to deliver those crops to the world. I would have to start searching for details but this is not a straw man. Perhaps we can find some information on what percentage of fossil fuel use is agriculture and transportation in third world countries. I will try to find this out if the moderator can suggest another thread other than sea level rise.
Norrism:
If you had read the reference I gave you to Smart Energy Europe you would see that they proposed using electrofuels. I.E. they will use electricity from renewable energy to convert CO2 from the air into diesel fuel. They could also use electric tractors with a teather or batteries, whichever is cheapest. I think Jacobson proposes electric tractors using batteries.
Obviously, everyone who has made an all renewable proposal has something in mind for farm equipment. Your suggestion that it has not been solved just shows that you have made no effort to read the papers you have been referred to.
If you do not look for the answers everything is a mystery that cannot be solved. If you read the background information than we can have a discussion on how to implement the proposed solutions. Many people have proposed all renewable systems so many different solutions for farm equipment have been suggested.
You have spent too much time at fossil fuel investor meetings. In those meetings they say solar power will never compete with coal. Solar is currently cheaper than coal and oil fueled electricity in many areas. Wind and solar are cheaper than gas in some areas.
Hi there. I am a new user, but hope you can help me. I am trying to confirm the "figure 1" in this article, but ran into unexpected problems...
When I look up in the 1990 IPCC report (https://www.ipcc.ch/site/assets/uploads/2018/03/ipcc_far_wg_I_full_report.pdf) I find the graph of best estimates of sea level projections on page 277. If I try to read from the graph, I get model predictions between approximately 4 to 12 cm's of sea level rise in 2010.
Doing the same on figure 1 in this article gives IPCC model predictions aprox 1,5-6,5cm sea level rise, - or about half the sea level rise that I can find in the original 1990 IPCC report...
I know reading graphs is not very precise, but still... - I must have misunderstood something...???
MathiasEgholm,
I looked at both graphs and they seem to read as you describe. One is from 1990 first IPCC assessment and the other is from the 2007 fourth IPCC assessment. It appears that the estimates of sea level rise have changed over time. As more knowledge is gained estimates of some things change.
Current estimates are higher than those in this article because much more understanding of the Antarctic Ice sheet has been obtained in the past 5 years.
It is not clear from your post what question you are trying to answer. If you say what you are interested in we may be able to provide a recent assessment that addresses your concerns. I suggest using the most recent estimates of sea level rise because more is understood every year.
Global sea levels are indeed rising, raising concerns about human safety. Some excerpts from the 2018 National Climate Assessment, Volume 2, validated and approved by the Trump Administration:
https://nca2018.globalchange.gov/chapter/2/
Figure 12-4a is the salient figure, for expected SLR to come (click for bigger image):
(a) Global mean sea level (GMSL) rise from 1800 to 2100, based on Figure 12.2b from 1800 to 2015, the six Interagency GMSL scenarios (navy blue, royal blue, cyan, green, orange, and red curves), the very likely ranges in 2100 for different RCPs (colored boxes), and lines augmenting the very likely ranges by the difference between the median Antarctic contribution of Kopp et al. and the various median Antarctic projections of DeConto and Pollard
A denier stated this:
So, how many dozens and dozens of peer-reviewed scientific papers will it take to convince of the Truth, which is that sea levels always rise 3 meters to 14 meters?
Please, do tell. Why do you reject science?
At those times, CO2 levels were 260 ppm - 280 ppm CO2.
Whether CO2 levels are 260 ppm or 460 ppm, your sea levels are going to rise 3 meters to 14 meters and there ain't a damn thing you or anyone else can do to stop it.
So, get over it already.
And, severe weather?
Not gonna happen. They've been making those claims for decades and list of failures is long. That's because there isn't a single shred of scientific evidence to support claims of severe weather. It's all fear-mongering to mislead people.
This denier used these links to try and support their denier claims.
MIS-11 duration key to disappearance of the Greenland ice sheet
Greenland ice cores reveal warm climate of the past
The sea-level highstand correlated to marine isotope stage (MIS) 7 in the coastal plain of the state of Rio Grande do Sul, Brazil.
Do sea levels always rise 3 to 14 meters regardless of the amount of CO2 levels?
TVC15 @93 ,
I would say that your denier friend believes in magic, not science. In the current situation (the Holocene) the world has been slowly cooling for around 5,000 years, and the sea level has been falling slowly . . . until the past 150 years of rapid warming, of course. Lower temperature, more land ice, lower sea level. Higher temperature, less land ice, higher sea level. Does he have any scientific evidence to counter those basic physics? . . . no, of course he doesn't. Challenge him !
No severe weather? So what has been experienced by US Midwest farmers this year does not count? Houston getting 500 years rain events 3 years in a row doesn't either? France recording its highest temperatures since record keeping began, yesterday, and then again today, on the heels of last year's severe thunderstorm activity? The successive Australian heat waves and associated fires? Last summer global heat wave spanning from Canada to Japan, with fires across the polar circle in Scandinavia? The hyperfast intensification of hurrican Michael? Last Austral summer with the highest recorded temperatures in Southern Chile? What rock do these people live under?
The "please do tell" condescending tone is quite typical. The selection of research that they think support their position but turns out somewhat different if you actually look into it, even more so. There is a pretty good literature on MIS 11, and the paper I linked below has a great bibiliography with links. It's not nearly as simple as your denier would have you believe.
MIS 11 is interesting for a number of reasons. Astronomical forcings were quite similar to those of the present; however, the interglacial lasted a long time and saw the collapse of the Southern Greenland ice sheet. The regime of galcial/interglacials definitely changed afterward and the cycles that have dominated until our interglacial are different. There is strong support for the trigger/feedback idea put forth by Hansen in the literature on the subject of glacial/interglacial.
Kleinen et al (2014) has produced successful reconstitutions of MIS11 using intermediate complexity and general circulation models. The high sea levels are owed to the loss of the ice sheet, and that is not at all an automatic feature; however, there were some possible large regional variations. They also mention the existence of quite variable climate regimes over short periods of time.
From their discussion section: "numerous colder oscillations (up to 2 °C below the present) appear in the reconstruction, suggesting some climate instability during this long interglacial interval."
Furthermore, some regions experienced only mildly different climate than modern pre-industrial, even though they were located in the Northern hemisphere (where the astronomical forcing was acting). They cite la Cote, in the Western French Alps: "Coleoptera- and pollen-based climate reconstructions suggest conditions similar to present or even slightly warmer during the interglacial optimum, up to 18 °C in July compared to the modern value of 16.4 °C. However, pollen-derived mean January temperatures did not exceed the modern value (−0.7 °C) by more than ca. 1 °C, with the exception of one pollen spectrum (Field et al., 2000)."
This leads to a much more nuanced interpretation. There is evidence that MIS11 is a good fit for modern time comparisons as they pertain to astronomical configuration. However, The fact that temperatures were slowly going down for thousands of years before modern times points to a marked difference between MIS 11 and present.
Kleinen et al:
https://www.sciencedirect.com/science/article/pii/S1040618213009622
@ 94. Electric
I don't enjoy challenging this particular denier as he will come back hurling insults just as you can see in the condescending attitude displayed in my post. He also plays as if he's some sort of science genius. Sadly most Americans fall for such disingenuous displays due to many here not holding basic science literacy.
Instead of challenging him, I simply post evidence to refute his denier statements.
@ 95,96 Philippe Chantreau
Yes the "No severe weather" comment is baffeling indeed.
Thank you for the response and the link.
More on the comparison of MIS 11 to present here:
https://www.whoi.edu/cms/files/rohling10epsl_72104.pdf
Good quality general discussion in the following link, with considerations on the current interglacial with and without anthro influences:
https://agupubs.onlinelibrary.wiley.com/doi/pdf/10.1002/2015RG000482
AS always, the weight of the evidence is what matters...
TVC15 @93,
The denialist's assertion that "sea levels always rise 3 meters to 14 meters" needs a little more nailing down to mean anything. Sea levels didn't rise by such an amount yesterday, for instance. So presumably this is about interglacials and their sea levels relative to today, the previous four interglacials being MIS-5, 7, 9 & 11 with the present 'interglacial' MIS-1.
So did all these four interglacials see "sea levels ... rise 3 meters to 14 meters" above today's values? This does rather depend on how you measure sea level. The reference to Lopes et al (2014) [Abstract linked @93] suggests three of them did. And there was a fourth high-stand at the site investigated by Lopes et al, MIS-1, the present 'interglacial'. But the data of Lopes et al is not global sea level rise but a regional measure. The Holocene high-stand in the tropics is indeed 3m above today (as explained by this SkS post). So it sounds like 'job done!' The +3m high-stand was delivered during this interglacial and now, having cancelled the next ice-age with our GHG emissions, if we keep up the GHG emissions we can look forward to a truly global +3m SLR, although it might take a couple of centuries to deliver.