


 Arguments


The albedo effect and global warming
What the science says...
| Select a level... |
 Basic
Basic
|
 Intermediate
| |||
|
The long term trend from albedo is of cooling. Recent satellite measurements of albedo show little to no trend. |
|||||
Climate Myth...
It's albedo
"Earth’s Albedo has risen in the past few years, and by doing reconstructions of the past albedo, it appears that there was a significant reduction in Earth’s albedo leading up to a lull in 1997. The most interesting thing here is that the albedo forcings, in watts/sq meter seem to be fairly large. Larger than that of all manmade greenhouse gases combined." (Anthony Watts)
At a glance
What is albedo? It is an expression of how much sunshine is reflected by a surface. The word stems from the Latin for 'whiteness'. Albedo is expressed on a scale from 0 to 1, zero being a surface that absorbs everything and 1 being a surface that reflects everything. Most everyday surfaces lie somewhere in between.
An easy way to think about albedo is the difference between wearing a white or a black shirt on a cloudless summer's day. The white shirt makes you feel more comfortable, whereas in the black one you'll cook. That difference is because paler surfaces reflect more sunshine whereas darker ones absorb a lot of it, heating you up.
Solar energy reaching the top of our atmosphere hardly varies at all. How that energy interacts with the planet, though, does vary. This is because the reflectivity of surfaces can change.
Arctic sea-ice provides an example of albedo-change. A late spring snowstorm covers the ice with a sparkly carpet of new snow. That pristine snow can reflect up to 90% of inbound sunshine. But during the summer it warms up and the new snow melts away. The remaining sea-ice has a tired, mucky look to it and can only reflect some 50% of incoming sunshine. It absorbs the rest and that absorbed energy helps the sea-ice to melt even more. If it melts totally, you are left with the dark surface of the ocean. That can only reflect around 6% of the incoming sunshine.
That example shows that albedo-change is not a forcing. That's the first big mistake in this myth. Instead it is a very good example of a climate feedback process. It is occurring in response to an external climate forcing - the increased greenhouse effect caused by our carbon emissions. Due to that forcing, the Arctic is warming quickly and snow/ice coverage shows a long-term decrease. Less reflective surfaces become uncovered, leading to more absorption of sunshine and more energy goes into the system. It's a self-reinforcing process.
If you look at satellite images of the planet, you will notice the clouds in weather-systems appear bright. Cloud-tops have a high albedo but it varies depending on the type of cloud. Wispy high clouds do not reflect as much incoming sunshine as do dense low-level cloud-decks.
Since the early 2000s we have been able to measure the amount of energy reflected back to space through sophisticated instruments aboard satellites. Recently published data (2021) indicate planetary albedo, although highly variable, is showing an overall slow decrease. The main cause is thought to be warming of parts of the Pacific Ocean leading to less coverage of those reflective low-level cloud-decks, but it's early days yet.
Albedo is an important cog in the climate gearbox. It appears to be in a long-term slow decline but varies a lot over shorter periods. That 'noise' makes it unscientific to cite shorter observation-periods. Conclusive climatological trend-statements are generally based on at least 30 years of observations, not the last half-decade.
Please use this form to provide feedback about this new "At a glance" section. Read a more technical version below or dig deeper via the tabs above!
Further details
"Clouds are very pesky for climate scientists..."
Karen M. Shell, Associate Professor, College of Earth, Ocean and Atmospheric Sciences, Oregon State University, writing about cloud feedback for RealClimate.
Earth's albedo is the fraction of shortwave solar radiation that the planet reflects back out to space. It is one of three key factors that determine Earth's climate, alongside the evolution of both solar irradiance and the greenhouse effect. Back in the 1990's, the evolution of Earth's albedo was by far the least understood of the three key factors. To address that uncertainty, it was proposed to measure Earth's albedo continuously over at least one full solar cycle. The long data series thereby obtained also helped scientists to explore potential correlations between varying solar activity and albedo change.
Thus was born the Earthshine project. It began in the Big Bear Solar Observatory (BBSO) in California in the mid-1990's. Measuring Earth's albedo was done by making observations of the illumination of the dark side of the Moon at night by light reflected off the dayside Earth. This method was pioneered in 1928 by French astronomer Andre-Louis Danjon (1890-1967).
Trial Earthshine observations were made in 1994–1995 and regular, sustained data-collection commenced in 1998. Data-collection continued until the end of 2017, representing some 1,500 nights spread over two decades.
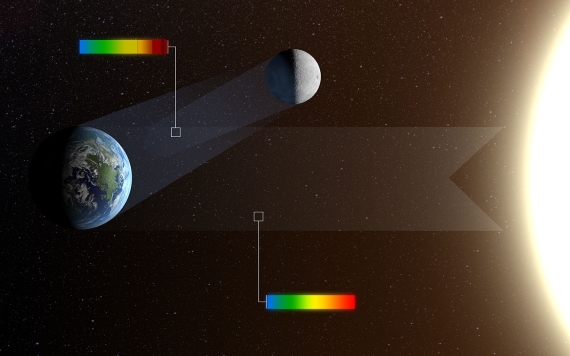
Fig. 1: When the Moon appears as a thin crescent in the twilight skies of Earth it is often possible to see that the rest of the disc is also faintly glowing. This phenomenon is called earthshine. It is due to sunlight reflecting off the Earth and illuminating the lunar surface. After reflection from Earth the colours in the light, shown as a rainbow in this picture, are significantly changed. By observing earthshine astronomers can study the properties of light reflected from Earth as if it were an exoplanet and search for signs of life. The reflected light is also strongly polarised and studying the polarisation as well as the intensity at different colours allows for much more sensitive tests for the presence of life. Image and caption credit: ESO/L. Calçada.
In 2005, a new automated telescope was installed in a small, dedicated dome at the BBSO. The two telescopes, new and old, were then run together from September 2006 through to January 2007, for calibration purposes. Observations made with the more accurate automated telescope were then made through to the end of 2017.
Since the early 2000s, scientists have also been measuring planetary albedo with a series of satellite-based sensors known as Clouds and the Earth’s Radiant Energy System, or CERES. These instruments employ scanning radiometers in order to measure both the shortwave solar energy reflected by the planet - albedo in other words – and the longwave thermal energy emitted by it. The overall aim is to monitor Earth's ongoing energy imbalance caused by our copious greenhouse gas emissions.
The Earthshine project and the CERES satellite-based measurements (2001-present day) both record great variation in albedo. That is as might be expected, because cloudiness is such an important albedo-controlling factor and varies so much. However, a slightly decreasing trend was detected (fig. 1, Goode et al. 2021).
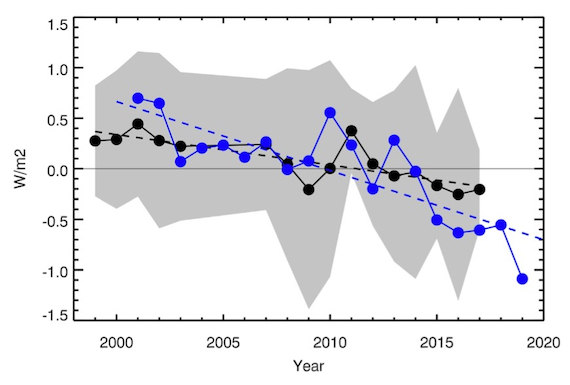
Figure 2: Earthshine annual mean albedo anomalies 1998–2017 expressed as reflected flux in Wm. The error bars are shown as a shaded grey area and the dashed black line shows a linear fit to the Earthshine annual reflected energy flux anomalies. The CERES annual albedo anomalies 2001–2019, also expressed in Wm, are shown in blue. A linear fit to the CERES data (2001–2019) is shown with a blue dashed line. Average error bars for CERES measurements are of the order of 0.2 Wm/2. From Goode et al. 2021.
The data cover two solar maxima, in 2002 and 2014, plus a solar minimum in 2009. Recorded variations in albedo show no correlation with the 11-year solar cycle, the cosmic ray flux or any other solar activity indices. Therefore, the data do not support any argument for detectable effects of solar activity on the Earth's albedo over the past two decades.
In comparison with the CERES data, both show a downturn in recent years, even though they cover slightly different parts of the Earth (Goode et al. 2021 and references therein). To put some numbers on things, in the earthshine data the albedo has decreased by about 0.5 Wm, while for CERES data, 2001–2017, the decrease is about 1.5 Wm. CERES data shows the sharp downturn to have begun in 2015.
The explanation put forward for the difference in albedo decrease between Earthshine and CERES has been further investigated and calibration-drift, a known issue with satellites, has been discounted. Instead, a recent and appreciable increase in sea surface temperatures off the west coasts of North and South America has been cited. The increase has led to reduced overlying low level cloud-deck cover. That would certainly cause significant albedo-decrease. The sea surface warming is attributed to a flip in the Pacific Decadal Oscillation (PDO), beginning in 2014 and peaking during the 2015–2017 period. It began to decline before the end of the decade.
However, a lot of this is very new, as pointed out by Gavin Schmidt at Realclimate in 2022. The role played by, for example, aerosols is not quantified in any great detail yet. But qualitatively, these developments demonstrate how impacts to the long-wave radiation combined with cloud feedbacks can lead to big shifts in short-wave reflectivity. Needless to say, this complex area is the firm focus of much ongoing investigation and will be for the foreseeable future.
Last updated on 3 March 2024 by John Mason. View Archives


coolmaster:
You continue to make nonsensical arguments.
I quoted your words on ocean precipitation exactly, and I explained the context of how ocean evaporation and preciaption relate to evaporation and precipation over land. The two are not at all independent.
In your most recent post, you state "...and that rain will fall into the sea." Again, you are wrong. Much of the evaporation from oceans does not fall back into the sea. How do I know this? Huge amounts of water flow through rivers and lakes from land to the oceans. The only way to get this back to the land is to evaporate it from the oceans, carry it over land, and let it fall as precipitation over land. You know this. Don't ignore it.
You ask if I am talkiing about desertification when I state "...that things other than evaporation limit both water vapour and cloud cover." No, I am not talking about desertification. I am talking about basic meteorology, where air must cool to form clouds and precipitation, and precipitation falls out of the atmosphere so that wate vapour does not increase continuously as more water evaporates. Atmospheric temperature plays a critical role in when, where, and how much cloud forms, and when, where and how much precipitation falls. Air must rise to cool, and the rise requires one of free convection, orographic forcing, or frontal systems.
Pumping more water vapour into the atmosphere will not act as a forcing for warming or cooling - it can only act as a feedback. Some other factor must cause warming for the atmosphere to hold more water vapour. Increased evaporation must lead to increased precipitation, but this does not necessarily mean that there will be more cloud. as far as radaitive effects are concerned, the latest IPCC report says that a negative cloud feedback is very unlikely. Under a warming climate, evaporation and atmospheric water vapour will both increase, and a negative feedback is what you are trying to claim with your cloud effects. There is very little scientific evidence to support this.
Your "estimate" of additional evaporation leading to "improving cloud cover" makes no sense. Clouds over land get much of their water from ocean evaporation, and much land evaporation gets transported away to make clouds in other locations - where basic meteorology explains the various processes that lead to cloud formation and precipitation.
The link I provided (to water vapour as a greenhouse gas) explains how water vapour is limited by temperature.
I am not confusing radiation effects of cloud and water vapour. I am saying that your claims of changing cloud cover through increasing evaporation are both simplistic and wrong.
Your whole argument rises or falls on your claim that increased evaporation will lead to the cloud cover changes you claim. You have provided no scientific justification for this claim, or references to suitable scientific publications to support it.
(Yes, I looked at the figures at the link you provided. The are predominately seasonal, and you provide no explanation as to what they are supposed to show. Seasonal variations are not a good indicator of of how the climate system responds to long-term changes. Too many confounding variables that you would need to sort out.)
@76
[snip]
You probably suffer from attention deficit syndrome. Thank god I am mortally bored after repeating the simplest facts of the most simplest climate knowledge more than 3 times - and BL failing to understand them.
I am not going to go around in circles with you a hundred times and then recommend psychopathological treatment to you after 3 months.
This can be done much faster. If your overview is limited to the size of a beer mat - it's not my fault.
BL: ...Increased evaporation must lead to increased precipitation, but this does not necessarily mean that there will be more cloud...
BL: ...basic meteorology, where air must cool to form clouds and precipitation,...
So what now ??? the water vapor turns into a cloud ---------— before it rains -------------— or not ???
[snip] Hopefully you are not here to pluck daisies and ask yourself: Aristotle loves me - Aristotle doesn't love me - Aristotle loves me ................? #?
You knot your brain here within 3 of your own remarkably meaningless sentences - contradicting to yourselve and not at all wondering that you have tomatoes on your eyes?
I have posted the graphs(69) for the global radiation balances all sky/clear sky so that you(and others) hopefully understand that clouds basically have a strong cooling influence on earth temperatures. [snip] You are hopelessly overwhelmed with the most simplest knowledge about CRE and watercycle. You doubt that I can produce clouds ? - ridiculous - I can produce clouds and I do it daily - my tomatoes can produce clouds - the forest next to my door even more - only BL can NOT make clouds - because he's probably "too intelligent", to piss a hole into the snow. You'll end up as a pangburn here if you don't take a quick break to get your neurons in order.
It's bad enough to run into climate deniers around every corner of this world - but folks like you who circulate Babylonian Language Confusion(BLC ??#??) are a whole lot worse.
[RH] Ad hom and inflammatory comments snipped. Please read the comments policy for this website before continuing to engage here.
Coolmaster:
Little of your most recent comment has passed moderation. In what little remains, you double-down on your claim of a strong cooling effect for clouds. Let's examine some actual science.
Note that in comment 70, although I said that the diagrams you provided in comment 69 were "a useful expansion", I also noted that "summary diagrams are summary diagrams - not detailed models."
First, you claimed in #71 that 1% increase in evaporation will lead to a 1% increase in clouds, and you have repeatedly claimed that increasing cloud has a cooling effect. You also said "I look forward to your criticism and assessment", so let's see if you really mean that.
We will start with the consequences of an increase in evaporation, and we'll limit it to the land surface you have talked about (although it doesn't really make any difference to what I will present). What happens when we manipulate surface conditions to increase evaporation?
Now, if the additional water vapour forms cloud, we have to ask "what kind of cloud?". That depends on where and how the lifting of the air occurred which led to cooling and cloud formation. Cloud types vary a lot. Wikipedia has a nice discussion, and gives us this nice diagram:
So, will this "extra" humidity cause more cloud? Maybe. Maybe not. Maybe it will lead to a different cloud type. Maybe it wll lead to a similar cloud type, but at a different altitude. All of this will affect how radiation fluxes will be affected.
Coolmaster's argument then depends on claims that cloud cover will increase, and that the diagrams he has provided show the radiatove flux changes. Let us consider some of the possible radiative changes.
None of these details are covered in the diagrams or discussion presented by coolmaster. I will repeat what I said before: summary diagrams are summary diagrams - not detailed models.
Can we find models that do include thse sorts of effects? Yes. I will dig back into two early climate change papers that were key developments in their day. They covered basics that more recent papers do not repeat, so they provide useful diagrams.
The first is Manabe and Strickler, 1964, JAS 21(4), Thermal Equilibrium of the Atmosphere with a Convective Adjustment.
Their figure 7a shows model results that cover different cloud assumptions:
Note that cloud type and height both have significant effects on the modelled radiative equilibrium. (Follow the link to the paper if you need more context.)
The 1964 paper was followed by another in 1967: Manabe and Wetherald, 1967, JAS 24(3) Thermal Equilibrium of the Atmosphere with a Given Distribution of Relative Humidity
They give two figures of interest: 20 and 21:
Again, follow the link to the paper for context (and perhaps larger views of the graphs).
These two figures show responses to changes in cloud amounts, for several different cloud types in their model.
So, we can see that climate science has know for over 60 years that different cloud types and heights have significant differences in their role in radiation transfer. The papers I have cited used a one-dimensional radiative-convective model, which is simple by modern standards. Current three-dimensional general circulation models incorporate even more vertical cloud processes, and add the horizontal dimensions that include the horizontal transport of water vapour I mentioned at the start of this comment. They generate cloud internally, based on physics, rather than assuming specific distributions - but the key message is the same:
Cloud amount, cloud type, cloud height, horizontal distribution - all are important in properly assessing the radiative effect of clouds.
Coolmaster's diagrams are nice pictures that help illustrate a few aspects of the complexity of clouds and atmospheric radiation transfer, but they are totally unsuited to the sort of predictive analysis he is trying to perform.
BL@78
BL: you double-down on your claim of a strong cooling effect for clouds. Let's examine some actual science.
I have already sent you the current science in this regard. The graphics for the global radiation balances all_sky, clear_sky, land & ocean were created and published by Prof. Dr. Martin Wild / ETH Zurich. He is a very nice person and lead author of the IPCC AR6 WGI Chapter 7: The Earth’s energy budget, climate feedbacks, and climate sensitivity. (Chapters 7.2.1 and 7.4.2.4.3 are relevant for our topic.)
You will not find our topic much more actual and precise anywhere, and if you continue to have doubts about the strong cooling influence of clouds - you should contact with Prof. Dr. M. Wild directly.
BL: summary diagrams are summary diagrams - not detailed models."
You will surely see that a slr volume of 1335km³ / year has to be distributed globally and that I therefore use global, summarizing radiation balances.
Using the posted information in the explanatory file on land use and irrigation,
https://www.frontiersin.org/articles/10.3389/feart.2020.00245/full
you also have the opportunity to observe my claims about irrigation, cloud formation, precipitation, temperature, radiative forcing etc. on a more regional level.
BL: ...it condenses to form cloud, but this is not always the case. ...So will this "extra" moisture cause more clouds? Maybe. Maybe not.
You have provided no scientific justification for this claim, or references to suitable scientific publications to support it. You are completely wrong here. You claim that there is some kind of rest room for water vapor in the atmosphere. Could you please prove that.
99,999% of atmospheric water vapor will form a cloud before it return as precipitation. Dew e.g. is also considered to be a form of precipitation.
BL: As a consequence of increasing evporation, the location where the evaporation occurs will also see less thermal energy transfer to the atmosphere, so temperatures are also affected.
Yes Sir - that´s what I mean. More latent heat flux = less sensible(thermal as you say) heat flux. H²O in the air will form clouds - dry and hot air in the atmosphere will kill them. Soil and air temperatures will decrease - and that's exactly what I intend to do with my strategy. You should also know that the extra amount of 1% precipitation/irrigation/evaporation is planed to released predominantly in spring / summer allways into a relatively unsaturated, dry and hot clear_sky atmosphere, which most closely corresponds to a drought period or desert.
Intensification of the global hydrological cycle is a robust feature of global warming, BUT at the same time, many land areas in the subtropics will experience drying at the surface AND in the atmosphere. This occurs due to a ! limited water availability ! in these regions, where the cloudiness is consequently expected to decrease.
Your speculations about different clouds, with their different effects on the albedo and SW / LW radiation effects, are not conducive to the discussion and are unimportant for my assessments. In a dry, hot, sunny high pressure atmosphere, I guess at least that mostly convective fair-weather clouds or thunderclouds (cumulus or c.-nimbus) will arise.
1% more precipitation / evaporation will not have a major impact on the general cloud pattern. The natural regional variability of the amount of precipitation is often 200mm or more between dry and humid years. Since 9mm more or less per year will regionally cause no noticeable changes in the cloud regime. Maybe there will be 3-4 rainy days/year instead of increasing hours of sunshine.
BL: Coolmaster's diagrams are nice pictures that help illustrate a few aspects...
Again - these diagrams are not mine. They are calculated by professionals of IPCC experts. You have no clue about the difference between water- & air cooling, heat capacity & efficiency. That's your problem - not mine.
[DB] Ad hominem and inflammatory snipped. You've been warned already, so keep it clean.
Coolmaster:
Unfortunately, you have little more than a re-assertion of your previous points.
I know Dr. Wild. I've worked with him in the past. I have many years of experience in the measurment of radiation. The diagrams you have displayed are descriptive, and in no way represent a full analysis of the effects of cloud cover and global climate. I am completely confident that Dr. WIld would not consider them as evidence for the claims you are making. There is nothing wrong with what is in the diagrams - it's is what is not included.
I have provided references to published science that shows not all clouds cause cooling when cloud amount increases. I see you have done absolutely nothing to refute the validity of those studies.
You refer to the IPCC. In the most recent AR6 report (section 7.4.2.4.2), they specifically say:
Empirical evidence. Theoretical understanding. Confirmation of the general ideas presented in the 1960s papers I cited that high cloud can cause warming, and that other factors besides area are a factor. All of which refutes your premise. All of which you have shown no evidence of considering or understanding. You simply dismiss it as "unimportant for [your] assessments". You dismiss my references to well-established scientific papers as "your speculations".
I have described the way that water vapour moves around, and the processes in cloud formation, as is covered in nearly any basic meteorology textbook. You have done nothing to argue against that, other than just declaring otherwise.
I have pointed out that increased evaporation in one location, by increasing atmospheric humidity, can lead to less evaporation elsewhere, so that that there is the possibility that little or no net atmospheric humidity increase at a global scale occurs. You have done nothing to refute that point.
The paper you link to (Chen and Dirmeyer) has "summer temperatures" in the title. Summer is only one of four seasons. It talks about local surface cooling when evaporation increases. That is not due to cloud cover changes. In the conclusions, the paper says "In summary, this study highlights the importance of irrigation in the local and regional climate..."
I will give you a hint: "local and regional" does not mean the same thing as "global". Microclimate is not global climate. If you think that part of that paper supports your claims, please provide a specific reference to a page number and quote. Otherwise, you are just throwing out journal references in an attempt to impress. (It's not working.)
Finally, you finish in your last paragraph by saying:
Yet in comment 71, you said
Which is it? It has no major impact, or it has a 1% increase that is just so important that it will cool the globe?
You can't keep your story straight. You can't explain how your diagrams or references actually support the claims you are making. You just assert an opinion, throw out a name or two, and think you've "proven" your case.
Bob Loblaw @80,
While it will likely not assist commenter coolmaster, there is an apparent contradiction presented within the literature, a contradiction which coolmaster seems to ignore while taking a cavilier interpretation from just one side of it. So that contradiction should perhaps be explained.
♣ We have reasonably unambiguously statements from AR6 Section 7.2.4.3 'Synthesis for the net cloud feedback' (a section mentioned by coolmaster @79) which tells us Cloud Feedback is net positive unless there is "extremely large" negative contributions over certain ocean areas although there is yet "no current evidence" for such contributions.
The work supporting this conclusion includes Dressler (2013) whose Fig 5 shows (units Wm^-2):-
This finding thus contradicts the assertions of commenter coolmaster that Cloud Feedback would be net positive over land. (I will ignore the water vapour feedback which will certainly provide additional positive feedback if substantial additional evaporation occurs over land.)
♣ There is also AR6 Section 7.2.1 'Present-day Energy Budget' mentioned @79. This presents in Fig 7.2 an old friend from up thread, namely Fig 14 from Wild et al (2019).
It is from this graphic that Wild et al derive the finding "The net (shortwave and longwave combined) cloud radiative effect at the TOA then results in an overall energy loss of − 19 Wm^−2," a finding echoed in AR6 section 7.2.1 'Present-day energy budget' - "As a result, there is a 20 Wm^-2 radiative imbalance at the TOA in the clear-sky energy budget (Figure 7.2 lower panel), suggesting that the Earth would warm substantially if there were no clouds."
This -19Wm^-2 is the value used by commenter coolmaster to suggest there would be a pro rata cooling due to an increase of cloud by 1% over land (although water vapour is not similarly accounted as increasing and also for some unexplained reason the cloud result is treated as being an accumulative annual cooling).
♣ These two references within AR6 appear contradictory. However, the 7.2.1 account does no more than "illustrate the overall effects that clouds exert on the energy fluxes." It simply shows that cloud effects are large while the actual Cloud Feedbacks are far more complex. Such feedbacks cannot be determined by simply comparing the average net radiation budget within areas of clear sky relative to an average for the entire planet.
So if more cloud were created, the type and location of that cloud will determine whether there is net global warming or cooling. And the sort of change in cloud resulting from additional AGW is seen to be warming. Uncertainty remains high for the size of AGW's cloud fedback, and that includes the rather jaw-dropping findings of Schneider et al (2019) and also in the CPIM6 models.
♣ I should perhaps end by making plain that for coolmaster's scheme of global cooling, this discussed 'contradiction issue' is a minor issue relative to some of its other problematic issues it generates.
BL80:
BL: I know Dr. Wild. I've worked with him in the past.
My google can`t find anything. As long as you do not respond a link, it seems to be a silly lie.
BL: ...it condenses to form cloud, but this is not always the case.
BL: ...So will this "extra" moisture cause more clouds? Maybe. Maybe not.
same problem - no link - no references
BL: I have provided references to published science that shows not all clouds cause cooling when cloud amount increases. I see you have done absolutely nothing to refute the validity of those studies.
I provided this link last week:
https://www.climate4you.com/ClimateAndClouds.htm#Cloud%20data
You see clouds feedback during the last decades triggered by a warming atmosphere measured by satelittes. Do you really think your reference of 1960 is something new to me ?
You still confuse effect and feedback.
This is clouds radiative effect: IPCC AR6 CH. 7.2.1
Without clouds, 47W/m² less solar radiation is reflected back to space globally, while 28W/m² more thermal radiation is emitted to space. As a result, there is a ~20W/m² radiative imbalance at the TOA in the clear-sky energy budget suggesting that the Earth would warm substantially if there were no clouds.
BL: - Summer is only one of four seasons. - local is not global - so that that there
please provide a specific reference to a page number and quote. Otherwise, you are just throwing out...
-— thanks MOD that`s enough ---
[RH] Please, once again, go read the commenting policies for this website. Accusing people of lying is way off limits. Moderators here can be patient, up to a point. Repeated breaking the rules generally results in warnings and then being blocked from the site.
MA Rodger @ 81:
Yes, coolmaster's essential error is to take a comparison between mean global clear sky radiation numbers and mean global cloudy sky radiation numbers, and treat that as if all cloud is equal and the difference can be applied to any change in cloud cover he wants. He is also failing to distinguish between cloud feedback and radiative forcing. Clouds are the result of other factors, and how they respond to forcings such as increasing temperature due to CO2 rise (or surface evaporation) cannot be evaluated using the diagrams and numbers he presents.
The "cloud feedback" section of the IPCC is discussing feedback caused by increased (or decreased) global atmospheric temperature. It is not directly applicable to cloud response to local surface temperature changes (such as irrigating land), or local surface humidity changes (such as increased humidity over irrigated land).
And coolmaster's claim of cloud cover change in response to increased surface evaporation is basically hand-waving. His introduction of his glorious "theory" is done in comment #71:
He has not presented a single reference or figure that supports the claim that increasing evaporation over a portion of the globe can produce a global increase in cloud cover - let alone any specific type of cloud. Radiative effects aside, unless he can substatiate his claim of local evaporation increases leading to global cloud cover changes, how you calculate the radiative effect of the cloud cover is irrelevant.
The energy/radiation flow diagrams can be done globally, split into land/sea, or split into clear/cloudy, but each is still a general average over a wide variety of conditions.
All land? What about forest vs. grassland vs desert vs. tundra? All different. Even "forest" is not a single class: tropical rain forest vs. temperate mixed-wood forest vs. temperature rain forest vs. boreal forest.
All have different cloud cover types, and treating them as equivalent is naive at best. Regardless of how accurate the diagrams that have been presented on this thread are, coolmaster has utterly failed at providing any sort of logical explanation or evidence that the local changes will lead to the global result he claims.
Nice catch on how coolmaster assumes that a constant level of irrigation/evaporation will lead to constantly increasing temperature effect (his -0.07 C/year).
coolmaster @ 82:
Congratulations. Another comments policy violation. You can't find anything using Google? Maybe if you look at the Skeptical Science Team page, you will find some clues about my background and why your Google search failed.
It is amusing that you complain about a lack of links or references, when you still have yet to provide a reference for your claim that local surface evaporation will lead to a 1% increase in cloud cover. Just in case you have forgetten it, here is your original claim again:
You repeat a diagram previously linked to. Let's us try to find the evidence we seek in that diagram.
Oh, there is that pesky cloud type issue again. Maybe it's actually important?
Now, let's look for evaporation data, so we can finally verify the elusive "1% increase in evaporation causes 1% increase in clouds" story.
Hmmm. I'm looking hard, but I don't see it.
This is typical of what coolmaster has produced here: links to papers or diagrams, with no explanation as to how they are supposed to support his argument, leaving the reader to try to examine the paper or diagram in search of something only coolmaster sees. There is no "there" there.
You seem to like the IPCC reports. Since you appear to have a copy of AR6, I'll skip linking to it. Maybe it has something to say about your grand theory that irrigation can increase evaporation and cool the planet.
[search]
[search]
Oh, maybe this is it!
It mostly covers albedo changes for land, but the second last paragraph says: "The contribution of irrigation (mainly to low cloud amount) is assessed as –0.05 [–0.1 to 0.05] W m -2 for the historical period (Sherwood et al., 2018)."
Hmmm. With those error bars, it's hard to tell if the effect is positive or negative. It's also the total effect attributable to all the increases in irrigated land over the historical period. If the -0.05 number is correct, would there be a linear response to more irrigated land, so that 100x the historical area would lead to -5W/m2 and offset the CO2 forcing? How much water is used each year for current irrigated land?
That might give coolmaster a glimmer of hope. Why has he not presented this information before? Maybe the more detailed results in the reference the IPCC uses do not support coolmaster's grand theory? Maybe he just doesn't know what to look for?
Maybe coolmaster will eventually provide us with the evidence we need, but I won't hold my breath.
coolmaster & Bob Loblaw,
While we have been blathering about the efficacy of coolmaster's grand scheme, somebody has snuck in and done it!!! And not just 'done it' but done it twice, more than twice. And all since, what was it, 1900hrs yesterday?
Diverting 1,335 cu km water onto land? According to AQUASTAT, they have managed to divert over 300 cu km water into reservoir evaporation and a further 2,700 cu km water diverted onto farmland. And more impressive still - the farms will be also delivering much more produce because they have this water resource available.
So all we need to do now is sit back and watch the global temperatures tumble year-on-year. And if we have time, perhaps digging out the scarves and woolly hats would be an idea. According to coolmaster's calculation method, this cooling will be three-times faster than the warming of AGW :)
Amazing what a little relevant data will tell you MAR.
Just considering Agriculture in your graph, the 1335 km^3/yr has been exceeded continuously since the early 1950s. So, 70 years times -0.07C/year gives me something like 4.9 C of cooling since I was born.
I"d better buy a parka. The glaciers will be covering Canada again once this global cooling gets its way.
I wonder why nobody has noticed this cooling. Is it possible that coolmaster is wrong?
BL: @ 83-86
BL: - It is not directly applicable to cloud reactions to local changes in surface temperature (e.g. irrigation of land) or local changes in surface humidity (e.g. increased humidity over irrigated land).
- And coolmaster's claim that cloud cover changes in response to increased surface evaporation is basically a wave of the hand.
- He has not provided a single reference or figure to support the claim that increasing evaporation over part of the world can lead to a global increase in cloud cover
- unless he can substantiate his claim of local increase in evaporation leading to global changes in cloud cover. ..
- if you do not have to provide a reference for your claim that local surface evaporation leads to a 1% increase in cloud cover.
- Now let's look for evaporation data so that we can finally check the elusive story "1% increase in evaporation causes 1% increase in clouds". Hmmm. I'm looking hard but I don't see - I see "atmospheric water". Is that "evaporation"? I do not think so. I seem to remember that "evaporation" is flow from the surface into the atmosphere, not storage in the atmosphere.
Are we looking at a system where increased evaporation actually causes these cloud changes? I don't see any evidence of that.
- Maybe one day Coolmaster will give us the evidence we need, but I'm not going to hold my breath.
earthobservatory.nasa.gov/global-maps/MYDAL2_M_SKY_WV/MODAL2_M_CLD_FR
NASA water vapor vs. cloud fraction
IF you need a reference, that evaporation is the phase change from water ---> to water vapor - just (hopefully shorter) let me know.
BL: - You may find some clues about my background and why your Google search failed on the Skeptical Science Team page. - Congratulations. I see that you are very bussy & diligent with Prof. Dr. Martin Wild have worked together. I look forward to hopefully reading your funny future posts here in the forum soon. (Sincerely) MACIAS
@MA Rodger
Unfortunately, your graph says nothing about whether these amounts of water are taken from groundwater / aquifers or from river water or bank filtrate. I suppose you can see the difference for the SLR in that regard.
MAR: All we have to do now is sit back and watch global temperatures drop from year to year. And when we have time ...
NO - The water consumption of civilization and agriculture has increased steadily with the population growth.
Agriculture in particular, as the largest consumer, has already dangerously lowered and polluted the water table in many places. Consumption continues to rise and the switch to river and rainwater is actually inevitable.
In middle latitudes + 2 ° C, higher temperatures are also associated with ~ 10% higher evaporation. This is a huge problem for the arid regions that are becoming increasingly arid. Saving water wherever possible is certainly a challenge there today.
..and once again, coolmaster just links to a page and shows a graphic without explaining how it supports his Grand Theory.
OK. I"ll bite. On the web page at that link (which is broken - here is the correct one), we find this (emphasis added):
Where is the part that says a 1% increase in evaporation will be guaranteed to lead to 1% more clouds?
Coolmaster probably does not even read the links or papers he posts. If he does read them, he clearly does not understand them.
Coolmaster has clearly crossed into basic trolling now.
I've followed this exchange somewhat distractedly, but now I'm noticing this from coolmaster when confronted with the lack of cooling that has happened from exactly the physical process he argues would cause it:
"NO. The water consumption of civilization and agriculture has increased steadily with the population growth.
Agriculture in particular, as the largest consumer, has already dangerously lowered and polluted the water table in many places. Consumption continues to rise and the switch to river and rainwater is actually inevitable."
How does that constitute any kind of response? It is completely beside the point and has nothing to do with the initial argument that the retained water would promote cloudiness, change albedo and lower temperatures. From that point of view, where the water comes from is irrelevant. The fact remains that the cooling imagined by Coolmaster from the physical process he described has not happened.
coolmaster @87,
You tell us that you suppose I "can see the difference for the SLR" in regard to the source of human water use.
Folk familiar with SLR would know that if the (2,700+300=) 3,000 cu km mentioned @85 were added to ocean volumes, it would cause over 8mm in SLR. So the proportion of that 3,000 cu km of water sourced unsustainably from aquifers is small. Indeed, the SLR from changes to ground water is assessed as running at about 0.4mm/yr (Cáceres et al (2020) puts it at 0.39mm/y for the period 2003-16) suggesting the 3,000 cu km/yr in 2010 comprises just 5% from unsustainable aquifer.
BL: You have to find out for yourself how the water cycle works. More than 3 attempts at explanation tell me that this will take months for you. (if any)
Anyone who asks the same question 8 times in a single comment and then does not get along with NASA's simple answer should think twice about whether he will get along here as an author at all. And please save your insults for your future readers (?) - they will surely love you.
A small reading sample at the end of our funny and fruitful discussion he already provides here in advance:
BL: 70
"Clear skies and overcast skies are quite different.
Land and sea are quite different.
Visible light and IR radiation are quite different.
Complex? Yes.
Incomprehensible? No."
Personally, I would like to read some explanations of the final mysteries of climate research as the first topic for his entry as an author:
After the rain - comes the sun and after the sun comes the rain. Good luck
lmao - MACIAS
[RH] You'll please note this thread is supposed to be directed toward issues of albedo. If you wish to discuss issues related to SLR please find the appropriate thread and comment there.
MA Rodger: "You tell us that you suppose I "can see the difference for the SLR" in regard to the source of human water use."
Sorry - - that was obviously a misjudgment on my part. The same applies to you here: All good things are 3
The oceans work like a bathtub:
'- The inflow comes from the rivers discharge ...greenland, antarctica incl. (~49500km³) & ocean precipitation (379500km³)
- and the outflow happens by ocean evaporation. (420750km³)
We take the ! additional ! 1335km³ so from the rivers and not from the groundwater ---> SLR stopped.
You already know the page that quantifies the drainage of the continents.
www.carbonbrief.org/satellite-data-reveals-impact-of-warming-on-global-water-cycle
The volume corresponds to 907 PWh and will replenish groundwater and aquifers and circulate again and again to large parts over the land areas and incl. create a multiplication effect that increases cloud cover, precipitation, evaporation and runoff.
coolmaster @92,
Your final paragraph is packed full of unsupported assertions which you say will result from your grand scheme of annually diverting 1,335km^3/y of water that would otherwise discharge into the oceans and thus radically increase global albedo through increased cloud. The "unsupported" nature of your assertions is easily demonstrated with the two references you provide.
♣ The graphic you present is from Wikithing but is adapted from Abbott et al (2019) 'Human domination of the global water cycle absent from depictions and perceptions' who provide the numbers in their Fig 3. Relevant to your grand scheme is the size of the various global water reservoirs. The giant reservoir is of course the oceans which hold 1,340M km^3. Next is ice with 25M km^3 and surface/soil water with 23M km^3 while trailing along far behind is the atmosphere holding just 0.0125M km^3 water.
Your proposed grand scheme seems to be assuming atmospheric water can increase by 0.001335M km^3 annualy, or a 10% annual increase. Note this 10% annual increase in atmospheric water would add to the GH-effect, perhaps by some 4Wm^-2 annually, so 100x stronger than today's AGW.
♣ The CarbonBrief reference describes Pascolini-Campbell et al (2021) 'A 10 per cent increase in global land evapotranspiration from 2003 to 2019' which is iteslf paywalled [Abstract] but the reported 10% increase in evaporation rate 2003-19 over land equates to some 7,000km^3/y while the reported 3% increase in rainfall equates to 3,300km^3/y and the decrease in direct discharge from land to ocean a further 3,000km^3/y.
This suggests your grand scheme wouldn't make a ha'p'orth of difference. Evaporation over land is shown to have increased five-time the amount you propose yet AGW and SLR continued apace.
MA Rodger93:
MAR: "Your proposed grand scheme seems to be assuming atmospheric water can increase by 0.001335M km^3 annualy, or a 10% annual increase."
No - I never ever assumed, wrote or thought about that I plan or can increase atmospheric water by 1335km³ annualy.
You are making a very similar mistake as Prof. Stefan Rahmstorf from PIK in Potsdam in response to my comment in another climate forum.
https://www.realclimate.org/index.php/archives/2021/08/sea-level-in-the-ipcc-6th-assessment-report-ar6/#comment-794653
Your mistake is probably that you have not read my posts with due attention, even though they are kept very simple and straightforward.
An increase in atmospheric water by 10% / year would mean that, according to the CCF, earth temperatures rise by approx. 1.4 ° C per year. A state of the climate which means certain death for all life on earth.
So you also completely misunderstood me.
My climate protection strategy would like to take the volume of 3.7mm SLR(1335km³) from the global rivers discharge when their water levels are sufficient(&clean) or even specially in flood events after rain- !!! to store it in soil moisture and groundwater over the land mass.
In principle a simple, seasonal storage of retained river water also to adapt to droughts and floods.
In dry seasons, this water will be mainly evaporated from agriculture, but also the before mentioned “amunas” of the old inca culture and their water management are a perfect way to rewet forests & moors.
hidraulicainca.com/lima/sistema-hidraulico-amunas/
This in turn ensures an increasing relative (and specific) humidity and additional cloud formation over land in a regional drought season.
After an average of ~8.5 days in the atmosphere it will return – even with a relatively high probability – as precipitation over another land area. There will be a multiplier effect that increase together with soil moisture and evaporation rate (wet regions become wetter).
As a result, the water cycle over the land areas is intensified by ~ 1-1,5% and thus the increasing size of the annual mean cloud cover over land areas leads to a higher albedo & CRE, which I estimate to be at least a cooling RF of ~ -0.2W/m² / year.
A really cooling, additional radiative forcing, which, in my opinion, can more than compensate for the current annual radiative forcing caused by CO² .
A holistic, functioning climate protection strategy,(stopping SLR AND global temperature rise & adaptation to droughts and floods) which works alternatively and independently of the reduction in CO² emissions, which only promises to stop the temperatures rise perhaps after ~ 2070 (if we as humanity can reduce emissions immediately – which I personally do not believe)
In the latest IPCC report / WG1 Chapter 7.4.2.4.3, the positive feedback of the cloud cover on an atmosphere warmer by 1 ° C is given with +0.42W m-2 ° C-1.
We are slowly but steadily losing not only areas of ice and snow albedo, but also the clouds albedo due to decreasing global mean cloud cover and higher lapse rate.
The cooling CRE with ~-19W m-2 (chapter 7.2.1. in the same report) should decrease accordingly.
The slower warming of the oceans means that there has not been enough moisture evaporated into – and then held in – the air above the oceans to keep pace with the rising temperatures over land. This means that the air is not as saturated as it was and – as the chart below shows – relative humidity has decreased, desertification is spreading rapidly mainly caused by human activities.
Dryness is a temperature driver and cloud killer.
https://www.carbonbrief.org/wp-content/uploads/2020/11/Global-time-series-of-annual-average-relative-humidity-for-the-land-ocean-and-global-average-relative-to-1981-2010.jpg
That is why I (as an artist - not a climate scientist) think it's a good idea to create additional “artificial” clouds by additional artificial irrigation retained by river discharge from the superfluous water of the oceans.
---
MAR: but the reported 10% increase in evaporation rate 2003-19 over land equates to some 7,000km^3/y while the reported 3% increase in rainfall equates to 3,300km^3/y and the decrease in direct discharge from land to ocean a further 3,000km^3/y.
This suggests your grand scheme wouldn't make a ha'p'orth of difference. Evaporation over land is shown to have increased five-time the amount you propose yet AGW and SLR continued apace.
coolmaster: ???
360.57M km² ocean area * 3.7mm SLR = 1334.1km³ water = 8.93mm above the land area.
149.43M km² land area * 2.3L / m² increasing evaporation per year = 343.689km³ water.
* 1L / m² increasing precipitation per year = 149.43km³
* -1.01L decreasing runoff through the rivers per year = -150.92km³
* -0.75L decreasing groundwater level per year = -112.07km³
Your calculator probably has a built-in joker.
And if you are holding a PhD, you should hand it over (to me ?) as soon as possible.
[RH] Once again, please browse the topics on this site and move discussions on SLR to that thread. Last warning on this one.
@GPWayne:
"We know the planet is warming, and that human agency is causing it. What we cannot say yet is how climate change is affecting albedo, how it might be affected in the future, and what contribution to climate change - positive or negative - it may make."
coolmaster: The albedo is relative ... and depends primarily on the wavelength of the light that hits the body/molecule. We should therefore always specify a wavelength range for the albedo. Otherwise, strictly speaking, the entire incoming spectrum of the sun ( UVC140nm up to Micro waves10cm) is decisive. This relativity to the albedo is particularly important for an element as widespread worldwide as H²O. I.e. ice and snow with an albedo of up to 0,9 in the visible range(380-780nm) has an albedo in the micro wave range of only < 0,1.
Albedo of the earth ist 0,3 because absorbtion is 0,7(0,5 on the surface + 0,2 in the atmosphere) --> so the atmosphere has an albedo. Higher concentrations of GHG specially CO² is lowering the albedo of the atmosphere and is thus increasing temperature. We could always increase the albedo elsewhere: clouds, white color in the outdoor area or lighter field crops through foliar fertilization with light clays are just a few of the many possibilities.
The temperature of the earth's surface is globally determined by the radiation balance, the radiation budget. This records the interaction between absorption and reflection as well as re-emission and scattering.
But no matter which albedo you are looking at, whether short or long wave - a higher albedo can never cause a rise in temperature or energy. Conversely, every falling albedo increases temperatures or energy on earth.
So I suggest that you update the last sentence of your basic rebuttal.
@Moderation response: "last warning"
In my last comment, which you would like to see in the slr section, the word albedo appears 3 times - the words clouds and cloud cover even more often. You should also warn others, who do exactly the same(i.e. MAR,BL).
The inseparable connection between albedo - clouds - water and SLR was invented by an immovable mover (Aristotle's definition of God) ! not me !
I don't want to discuss religion here, if only because I don't belong to any official religious community and because my religion is art. For me, climate science is a discipline, just like painting, sculpture, dance, music, and theater, etc.
Nevertheless, I noticed that there once was a man who said he wanted to save the world. Among other things, because he supposedly could move over the water ...
I also want to save the world ... and move (spiritually & physically) over the water.
If you don't like my holistic, alternative climate protection strategy, which lowers sea level rise and earth temperatures - I can't change it, but I can't understand it either. In my opiniont it is the very last opportunity for you, your readers, commentators, your descendants, and the rest of creation to escape from climate hell (as long as anybody presents a much better, faster or cheaper concept.)
That was my last warning to you...
[DB]
Please note that posting comments here at SkS is a privilege, not a right. This privilege can and will be rescinded if the posting individual continues to treat adherence to the Comments Policy as optional, rather than the mandatory condition of participating in this online forum.
Moderating this site is a tiresome chore, particularly when commentators repeatedly submit unsupported assertions (sloganeering) or off-topic posts. We really appreciate people's cooperation in abiding by the Comments Policy, which is largely responsible for the quality of this site.
Finally, please understand that moderation policies are not open for discussion. If you find yourself incapable of abiding by these common set of rules that everyone else observes, then a change of venues is in the offing.
Please take the time to review the policy and ensure future comments are in full compliance with it. Thanks for your understanding and compliance in this matter, as no further warming shall be given.
https://www.skepticalscience.com/comments_policy.shtml
Sloganeering and moderation complaints snipped.
coolmaster @94+,
Trying to keep this on-topic for the thread (and I would have considered transferring this interchange on what is geo-engineering to another thread if it had a chance of being usefully continued), some Albedo issues which you raise.
☻ Firstly, within the deleted comment @95 (still visible to commenters), you state that "albedo is ... depends primarily on the wavelength of the light that hits the body/molecule." This is not correct. The reflected light is pretty-much independent of wavelength being no more than "bluish". The spectrum of reflected light is thus not significantly different from the spectrum of sunlight as Fig1 of Woolf et al (2002) demonstrates.
☻ Your annotated graphics @71 are probably taking the simplisitic calculations a step-or-two too far.
Want we can say from Wild (2014, 2019) is that Land Cloud albedo is shown as 19.7% with Land Surface albedo shown as 26.1%. Likewise Ocean Cloud albedo is given as 23.1% and Surface albedo as 8.1%.
The TOA radiation balance under clear sky conditions averaged globally by Wild (2019) shows 19Wm^-2 more cooling than his all-sky average. Yet this result does not mean that cloud and its resulting albedo is overall a cooling influence. Cloud is well-known to cool if low and to warm if high and the latitude is also important. The usual climatological consideration is whether today cloud presents a positive or negative feedback to a warming world, the present understanding being that it is very likely positive, a position reinforced by recent work (eg Ceppi & Nowack (2021) [Abstract] (@94 you cite resumably IPCC AR6 with a similar finding.)
We have up-thread shown very large increases in anthropogenic water 'use' on land and measured increases in evaporation over land. Thus to suggest an increase in evaopration over land would result in a higher cloud fraction and a strong cooling based solely on Wild's 19Wm^-2 is based on very shaky ground.
And the following back-of-envelope calculations suggest there would not be cooling but warming.
We see from Fig 2 Wild (2014) an all-sky Land Cloud albedo of 64Wm^-2. If cloud albedo were increased 1% that would pro rata present a global climate forcing of -0.19 Wm^-2 cloud albedo but with a loss of +0.05 Wm^-2 surface albedo. There is also reduced OLR cooling of +0.08 Wm^-2 pro rata suggested in Wild (2019) Fig14 and a water vapour forcing from the 1% increased humidity over land of roughly +0.12 Wm^-2. This would suggest a net warming from a 1% increase in Land evaporation of +0.06 Wm^-2, this a warming climate forcing larger than AGW.
☻ And to correct your bold assertions @94 concerning arithmetic. The 10% percent increase in land evaporation 2003-19 reported by Pascolini-Campbell et al (2021) multiplied by the 69,000/yr (+/-10%) land evaporation given by Abbott et al (2019) yields the 2003-19 increase of 7,000km^3/yr I present @93 (along with the references). The other values alongside which you object to are similarly derived.
Your own derivation of a greatly different value of 344km^3/yr uses solely Fig 3a of the former paper which gives an annual rate of increase as 2.3mm/yr (it should actually be 2.3mm/yr/yr) and for the 16-year period the increase would be thus 5,500km^3/yr, in the circumstance not a significant difference from 7,000km^3/yr.
@96
MA Rodger: you state that "albedo is ... depends primarily on the wavelength of the light that hits the body/molecule." This is not correct. The reflected light is pretty-much independent of wavelength being no more than "bluish". The spectrum of reflected light is thus not significantly different from the spectrum of sunlight.
coolmaster: I'm not sure if you know that e.g. plants are green (wavelength = ~ 550nm), a tomato red (~ 650nm) and blueberries (~ 450nm) blue when illuminated by sunlight with a full spectrum.
Illuminated by a full spectrum (white), the objects appear to your eyes & brain in more or less monochrome light. So - many of the incident wavelengths are absorbed and only single colors are reflected.
A snow surface is white and has a high albedo because all wavelengths are reflected in the range that is visible - nevertheless, snow absorbs very strongly in the long-wave range of IR radiation.
What you describe as "bluish" is the Raleigh scatter.
This has absolutely nothing to do with absorption, relative reflection and albedo.
Your posted graph shows the spectral properties of the light emanating from the earth - and not the energy content of sunlight, that matters in an energy balance.
Without having read the article - I guess you will hardly find the unit W / m², which is the important one for the radiation budget of the earth. So please don't mix it all up here. (MOD)
MA Rodger: The TOA radiation balance under clear sky conditions averaged globally by Wild (2019) shows 19Wm^-2 more cooling than his all-sky average.
coolmaster: No you are utterly wrong - it is vice versa.
Or do you feel yourself cooler in sun under clear sky - and feel heat when a cloud covers the sun ????
The radiation net effect of clouds and water vapor (CRE = -19W / m²) You still seem to confuse CRE with the atmospheric feedback of the clouds, which consists in the fact that with increasing temperature less cloud cover, changed lapse rate and optical depth are determined (+ 0.42Wm-2 ° C-1). Earth - is - loosing - the clouds !
MA Rodger: ☻ And to correct your bold assertions @94 / Your own derivation of a greatly different value of 344km^3/yr uses solely Fig 3a of the former paper which gives an annual rate of increase as 2.3mm/yr (it should actually be 2.3mm/yr/yr)???? and for the 16-year period the increase would be thus 5,500km^3/yr, in the circumstance not a significant difference from 7,000km^3/yr.
coolmaster: 1500km³/yr is more than I suggested to retain.
www.carbonbrief.org/satellite-data-reveals-impact-of-warming-on-global-water-cycle
Can you give us just a reference or a page in the www. quote where the unit mm / yr / yr is used ???? You should then definitely get in touch with Ms. Madeleine Pascolini-Campbell and explain to her that she was mistaken by a factor of ~20.
After all, her work and GRACE-FO are regarded worldwide as one of the most important findings of the last few years. So if you know better - go ahead ... Your pocket calculator with the built-in joker must have been very expensive.
[BL] More sloganeering removed. You continue with an aggressive tone, unsupported assertions, and repeated violations of the Comments Policy.
[DB] This user has recused themselves from further participation here.
The commenter @97 is no-longer a participant here but as this response to his comment @97 is albedo-stuff, I hope the moderators will allow it.
☻ Concerning the spectrum of reflected light in earthshine:- @97, the objection was to Woolf et al (2004) using an arbitrary ordinate scale on their Fig 1 (shown @96) rather than Wm^-2. Addressing this objection (although Woolf et al Fig 2 should have sufficed as it shows a roughly constant % albedo with wavelength), below is a graph of spectrum for wavelengths 0.25 to 6.5 microns (so into the UV) with a Wm^-2 ordinate scale. (Woolf et al above shows the spectrum 0.48 to 0.92 microns, so into the IR.)
☻ Concerning Wild et al's -19Wm^-2 clear-sky radiation:- Indeed, as commented @97, it is "visa versa" @96 as "cooling" was written in error and should have been "warming" from clear-sky relative to all-sky.
Do note that the cooling from an AGW-induced decrease in albedo is greatly due to the reduction of tropical marine cloud. AR6 provides a better assessment of such cloud today that allows AR6 to state that "A net negative cloud feedback is very unlikely" with a potential range of -10Wm^-2ºC^-1 to +9.4Wm^-2ºC^-1 ['very likely' =1.67sd]. (Although half the range given in AR5, these remain broad confidence intervals.)
Yet the -19Wm^-2 result from Wild et al (2019) was not misunderstood. The value is saying that the net energy balance under clear skys is -19Wm^-2 relative to the global average. (Note a coincidental -19Wm^-2 is also given by Wild et al for Land relative to Global.)
It doesn't follow that a reduction of clear-sky conditions would result in a comenserate cooling of the planet (just as an increase in the land area of the planet would not be expected to increase planetary cooling). It is not so simple.
Note what Wild et al consider their finding would be useful for:- "To better constrain (global climate models from CMIP5), we established new clear-sky reference climatologies." There is no mention of geo-engineering. (And note that if it were, the net planetary cooling would be -19Wm^-2 for the extra cloud and a further -19Wm^-2 for the loss of clear sky - this assuming a 50% global cloud fraction.) However, the impact of altering the global level of clear-sky conditions would depend entirely on the particulars of the alteration.
Indeed, consider the cloud-effect in its totality. If the models take all the clouds out but keep everything the same, the GH-effect is diminished by about 15%. This would suggest increased cloud warms (and so does not cool,) a warming with a back-of-fag-packet global value of [33ºC GH-effect x 3.7Wm^-2/ºC x 15% =] +18Wm^-2. So +ve and not -ve. An interesting result.
☻ Finally, the mistake within the annotations of Fig3 of Pascolini-Campbell et al (2021) - It a trivial mistake (that the value of 2.3mm/yr in Fig3a should be 2.3mm/yr/yr and likewise elsewhere) as the mistake is quite evident. Simply look at the regression line. The graphed regression line rises from an anomaly of -18mm/yr in 2003.0 to +21mm/yr in 2020.0, so a rise of 39mm/yr over the 17-year period graphed = 2.3mm/yr/yr.
Just a note on the last link in MA Rodger's comment (the one to Fig3).
If you click on the link, you get a message that includes "The owner of this website (www.carbonbrief.org) does not allow hotlinking to that resource..."
If your right click the link, copy the link, and paste that into your browser's address bar, you can view the figure.
Bob Loblaw @99,
I did note when tapping out #98 that the CarbonBrief item written about Pascolini-Campbell et al (2021) objected to the hot-linking of their image of the paper's Fig3 into this thread so I provided the direct link to the image (which I wouldn't have considered to be 'hot-linking') and that works fine for me, but apparently me alone.
The image of the paper's Fig 3 is perhaps a bit too fuzzy to display in-thread here but I see there the clearer version is on-web at Nature where 'hot-linking' works.
'Timeseries for evapotranspiration (top), precipitation (second from top), discharge (second from bottom) and change in ground water storage (bottom) over 2003-19. The black line shows the average trend and the shading shows the confidence range, where red regions indicate a high confidence.'
One further oddity is that the four trends are a long way from adding up to zero, probably due to all the very wobbly data. (The paywall prevents my access to the full paper & I couldn't immediately see any obvious explanation within the 'Extended data figures and tables'.)