


 Arguments


Joseph Postma and the greenhouse effect
What the science says...
Joseph Postma published an article criticizing a very simple model that nonetheless produces useful results. He made several very simple errors along the way, none of which are very technical in nature. In no way does Postma undermine the existence or necessity of the greenhouse effect.
Climate Myth...
Postma disproved the greenhouse effect
"Skeptics hope that Postma’s alternative thermal model will lead to the birth of a new climatology, one that actually follows the laws of physics and properly physical modeling techniques...Postma deftly shows how the systemically tautologous conjecture that is “back-radiative heating” just doesn't add up. We see how climatologists fudged the numbers to make it appear as if Earth actually raises its own temperature by having its own radiation fall back upon it - a conjecture contrary to fundamental physics." (John O'Sullivan)
Some recent attention has recently been going around the web concerning a new “paper” done by Joseph E. Postma (PDF here) which claims to “…physically negate the requirement for a postulation of a radiative atmospheric greenhouse effect.”
The claims are of course extraordinary, along the lines of Gerlich and Tseuchner’s alleged falsification of the atmospheric greenhouse effect. As is often the case with these types of “skeptics,” the more extravagant the claim, the more obscure the publishing venue; in this case the host is Principia Scientific International, which according to the website “…was conceived after 22 international climate experts and authors joined forces to write the climate science bestseller, ‘Slaying the Sky Dragon: Death of the Greenhouse Gas Theory.’” Most rational people would stop here, but this is the Americanized age where we need to glorify everyone’s opinion and must provide rebuttals for everything, so here it goes:
I ask that the reader have the paper open in a new window so they can follow along with this article.
The Foundations
Most of Postma’s first 6 pages are actually correct. He describes the greenhouse effect through the so-called layer model, which is a simple way to break up the planet into a “surface” and an “atmosphere,” with outer space overlying the top layer. This model is described in many climate books such as Dennis Hartmann’s Global Physical Climatology, David Archer’s Understanding the Forecast, Marshall and Plumb’s Atmosphere, Ocean and Climate Dynamics, and radiation books like Grant Petty’s First Course in Atmospheric Radiation. I will say that I do not particularly like this model as a suitable introduction to the greenhouse effect. It is useful in many regards, but it fails to capture the physics of the greenhouse effect on account of making a good algebra lesson, and opens itself up to criticism on a number of grounds; that said, if you are going to criticize it, you need to do it right, but also be able to distinguish the difference between understood physics and simple educational tools.
The atmosphere in Postma’s paper is just a single slab, so he has two layers (atmosphere+surface), but in general you can have many atmospheric layers. He goes on to solve for the energy balance of each layer (see equations 11-14). RealClimate derived the same result in less than a page here.
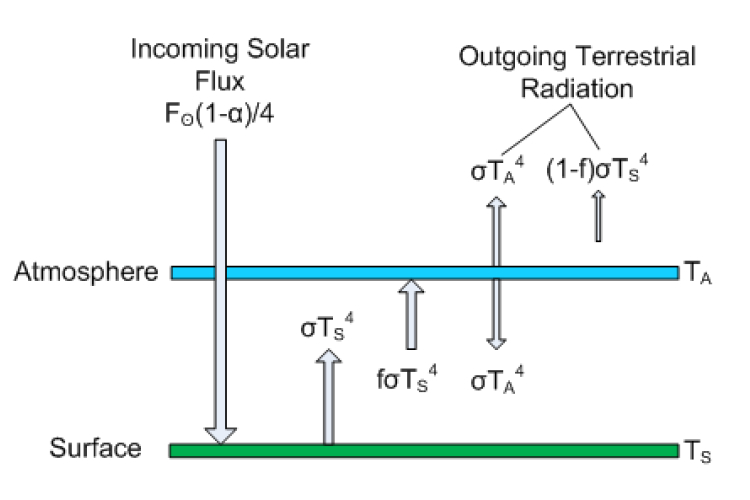
Figure 1: Layer model is Postma's paper. Click to Enlarge
Postma actually doesn’t get the atmospheric radiative flux right. The emission is not σTa4, it is fσTa4, where f is the atmospheric emissivity/absorptivity (following his notation) and Ta is the atmospheric temperature. The emissivity is a unitless factor between 0 and 1 descrbing how good of an absorber/emitter the object is relative to an ideal body. f = 1 describes a blackbody. By Kirchoff's law, the absorptivity of a layer must be equal to the emissivity (at the same wavelength), Both right hand sides of equations 11 and 12 are thus wrong, but it turns out that those errors cancel each other out and he gets equation 14 right. The factor of 2 in Equation 12 comes about because the atmosphere emits both up and down, although Postma clearly doesn't know how to derive this result formally, based on later statements he makes about this. Toward the end of page 14 he says this is invalid since the atmosphere radiates in 3-D, not just up and down. In fact, the quantity σT4 refers not only to the total power output of an object (the rate of energy emission), but it also refers to isotropic (equally intense in all directions) radiation. The result σT4 is obtained if one assumes that a plane radiates uniformly over a hemisphere (for example, the domed "half sphere" field of vision that a human can see when you stand outside, with the base of that half-sphere being the surface you sre standing on; the other hemisphere is invisible (see this image).
So far, it is simple textbook stuff with not much promise.
Geometry of the Global Energy Budget
Postma then goes on to describe fictitious “boundary conditions.” In particular, he seems to have serious objections to the averaging of the solar radiative flux over the Earth. In essence, he would prefer we had one sun delivering 1370 W/m2 of energy to the planet, with a day side and a night side, noon and twilight, etc. instead of the simple model where we average 1370/4=342.5 W/m2 over the planet (so that the whole Earth is receiving the appropriate "average" solar radiation). The number becomes ~240 W/m2 when you account for the planetary albedo (or reflectivity).
The factor of 4 is the ratio of the surface area to the cross section of the planet, and is the shadow cast by a spherical Earth. It is therefore a geometrical re-distribution factor; it remains “4” if all the starlight is distributed evenly over the sphere; it is “2” if the light is uniformly distributed over the starlit hemisphere alone; with no re-distribution, the denominator would be 1/cosine(zenith angle) for the local solar flux.
In simple textbook models, we like to prefer explanations that get a point across, and then build in complexity from there (see Smith 2008 for descriptions on a rotating Earth). Of course, students who use this model are probably educated to the point where they know that day and night exist, and certainly GCMs have a diurnal cycle. The radiative calculations are done explicitly by accounting for the temperature distribution and absorber amount that is encountered at each grid box. Postma is simply tackling a non-issue, just as how people criticize the term “greenhouse effect” for not working like a glass greenhouse. Postma objects to teaching this simple model because it is not real. All that is done, however, is to use a brilliant and sophisticated technique, taught only to the geniuses among us, called averaging! And of course, simple models are used in any classroom...it is how we learn.
But, in actuality, the globally averaged solar re-distribution approximation is not bad when we use it to describe the temperature for planets like Earth or Venus. These planets have an atmosphere or ocean that transport heat effectively, especially Venus with virtually no day-to-night or pole-to-equator temperature gradient. The atmosphere and/or ocean help smooth the diurnal temperature difference very well. Therefore, when coming up with a temperature estimate, it is a great first approximation. If you want the local equilibrium temperature for an airless body like Mercury or the Moon (that does not transport heat), then you want to use the no-redistribution or hemisphere only solar factor. This is well-known (see e.g., Selsis et al 2007). On Mercury, there is no heat distribution and very little thermal inertia; before the sunrise the temperature on the surface is somewhere near 100 K (-173 °C) and by noon the temperature on the surface of Mercury rises to about 700 K (427 °C). This may also be relevant for tide-locked planets (very slow rotation since one side is always facing the host star, the other in perpetual darkness). Earth does not experience any such changes of the sort. On Venus, the variability is even less, and most of the planet is at around 735 K.
Summary so far...
To summarize so far, Joseph E. Postma did not like a simple model of Earth’s radiative balance where we approximate the Earth as a sphere with uniform solar absorption. Of course, this is never done in climate modeling or in more detailed analyses appropriate for scholarly literature, so it is more an exercise in complaining about undergraduate education than an attempt to correct what he calls a “paradigm” in climatology. Nonetheless, the 0-D energy balance model is a useful approximation on Earth when coming up with an average emission temperature (~255 K), since air circulations and oceans tend to even out the diurnal temperature gradient on Earth, in addition to the thermal inertia provided by the system.
Venus is More Optically Thick Than a One Layer Model Can Give You
Postma starts by using Venus as a template for where the greenhouse model he is using breaks down. And indeed, he is right. His argument is that f (the emissivity) cannot possibly be greater than 1 (which is correct), and yet it must be in order to produce the Venus surface temperature in his Equation 29) Based on this, he then states that the standard greenhouse model does not work in general. The problem is that his Equation 29 assumes a one-layer atmosphere, which is an absurd assumption when you approach the extremely high optical thickness of Venus. Venus has a 90 bar atmosphere that has well over 90% carbon dioxide, some water vapor, and a greenhouse effect generated by suluric acid droplets and SO2. The radiative transfer on Venus works much differently than on Earth, owing in part to intense collisional broadening of CO2 molecules. A photon has an extremely difficult time escaping Venus, unable to do so until it reaches the very outer parts of its atmosphere.
Using the layer model, you would need many atmospheric layers to produce something close to Venus; with enough layers you would find that you could produce the surface temperature of Venus without violating conservation of energy. With just one perfect absorbing atmospheric layer, the surface temperature cannot exceed 21/4 times the emission temperature (Te=~230 K on Venus). But with two perfectly absorbing atmospheric layers, it can rise to 31/4Te. With three layers, the maximum temperature is 41/4Te, and so on. The reason the surface temperature is capped in this way is because the atmosphere itself must be emitting radiation and heats up when it absorbs photons from the surface, which in turn increases emission. If the atmospheric layer were instead a good infrared reflector (i.e., it has a high thermal albedo), then you could delay heat loss to space that way and increase the surface temperature well beyond this value. This could happen with CO2 clouds instead of H2O clouds, the latter are much more effective IR absorbers than IR scatterers, whereas the former could raise the IR albedo.
In essence, Postma stretches a simplified model to areas that it was never designed to go to, and then declares that its failure to work means the whole paradigm of the greenhouse effect is wrong. The incompetence is overwhelming. Postma is not done though, and decides to dig in further. His next argument is amusing, but perhaps a bit strange to follow, so I will try to explain.
Lapse Rate Confusion
He claims that observations of the atmospheric lapse rate (the rate at which temperature declines with height) disallow the greenhouse effect. His reasoning is that the atmosphere is at a fixed height. When greenhouse gases warm the surface, and cool the upper atmosphere, that height still remains fixed, but obviously the temperature difference between the bottom and top of the atmosphere must increase. Postma then claims that this necessarily implies that the lapse rate must have a greater slope than the theoretical value that he derived of about -10 K per kilometer (which is about right for a dry air parcel ascending). That is, if the atmospheric height remains fixed, and the temperature difference between bottom and top is increased, then the rate at which air cools with height must increase. Since this is not observed, then we have a problem, right?
In actuality, the atmospheric height is a distraction. The adiabatic lapse rate does not extend beyond the point where convection breaks down, which is the tropopause. The whole point of the greenhouse effect is that increasing atmospheric greenhouse gases does increase the “average” height at which emission to space takes place (and the tropopause increases in height too), so one IS allowed to extrapolate further down the adiabat to reach a higher surface temperature. On Venus, the optical thickness forces the tropopause to some 60 km altitude. Additionally, it is worth pointing out that greenhouse gases warm the upper troposphere, not cool it, but they do cool the stratosphere.
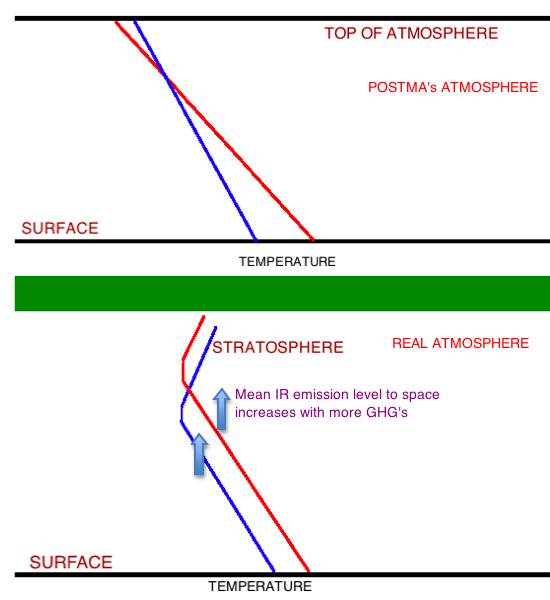
Figure 1: Qualitative schematic of the old (blue) and new (e.g., after CO2 increase) temperature with height in a dry atmosphere. Moisture tends to enhance the tropical upper atmosphere warming relative to surface. Temperature increases to the right.
TOA vs. Surface
Perhaps just as crucial to all of this, Postma cannot get around the surface energy budget fallacy, which says that increased CO2 causes surface warming by just increasing the downward infrared flux to the surface. This problem is described in standard treatments of the greenhouse effect, which he does not seem to know exist, such as in Ray Pierrehumbert’s recent textbook. The primacy of the top of the atmosphere budget, rather than the surface energy budget, has been known at least since the work of Manabe in the 1960s (see also Miller 2012)
In reality, the top of the atmosphere budget controls the surface temperature even more than the surface forcing, because the atmosphere itself is adjusting its outgoing radiation to space (and much of the radiation to space is originating in the upper atmosphere, owing to its IR opacity). Where the atmosphere is well-stirred by convection, the adjustment in temperature at this layer is communicated to the surface. I described this in more detail here.
Postma runs into this mistake again when he claims that the low water vapor in hot deserts is a problem for greenhouse theory, but this is largely due to the lack of evaporation cooling, which is just one component of the surface energy budget, and nearly absent in a desert. This is one scenario where a detailed consideration of the surface budget is critical, as well as in other weakly coupled regimes.
The way CO2-induced warming really works in a well mixed atmosphere is by reducing the rate of infrared radiation loss to space. Virtually all of the surface fluxes, not just the radiative ones, should change in a warming climate, and act to keep the surface and overlying air temperature relatively similar. The back-radiation will indeed increase in part because of more CO2 and water vapor, but also simply because the atmosphere is now at a higher temperature. But if the lower atmosphere was already filled with water vapor or clouds to the point where it emitted like a blackbody (at its temperature), increasing CO2 would not directly increase downward emission before temperature adjustment, but would nonetheless warm the planet by throwing the TOA energy budget out of whack.
Conclusions
In summary, Joseph Postma published an article criticizing a very simple model that nonetheless produces useful results. He made several very simple errors along the way, none of which are very technical in nature. More sophisticated models are obviously designed to handle the uneven distribution of solar heating (which is why we have weather!); nonetheless, the educational tools are useful for their purpose, and in no way does Postma undermine the existence or necessity of the greenhouse effect. Without a greenhouse effect, multiple studies have shown that the Earth collapses into a frozen iceball (Pierrehumbert et al., 2007; Voigt and Marotzke 2010, Lacis et al 2010) and indeed, after an ice-albedo feedback, plummets below the modern effective temperature of 255 K. This work makes extraordinary claims and yet no effort was made to put it in a real climate science journal, since it was never intended to educate climate scientists or improve the field; it is a sham, intended only to confuse casual readers and provide a citation on blogs. The author should be ashamed.
Last updated on 1 January 2015 by Chris Colose. View Archives


[DB] You still avoid finishing your dialogue with Dikran in comment 73 above. You will not be able to move on until you finish that one already started.
Your PDF link:
"recent attention has recently been going around the web concerning a new “paper” done by Joseph E. Postma (PDF here)"
is not valid. Please fix.
Jutland @84:
1) The tropopause is that level of the atmosphere between the troposphere and the stratosphere were the negative change of temperature with altitude falls to zero. That also happens to be were radiation can transfer energy more rapidly than convection. As on some planets there is no stratosphere, that fact is often used as the definition (ie, your definition (1)) of the troposphere (as it is more general).
2) I have never seen your definition (2) used as a definition as the tropopause. The average level from which radiant energy escapes to space is called the "skin layer", or "the effective altitude of radiation to space". It does not coincide with the tropopause. On average over the globe, it is at 5 km altitude, compared to the 10 km altitude of the tropopause.
It is possible you, or somebody with whom you are having a discussion, or reading, has confused the definition of the "skin layer" with the definition of the Top Of Atmosphere (TOA). For convenience of calculation, radiative forcing is defined relative to what is called the TOA, but is really the tropopause. That is the level at which the net radiative flux is calculated in determining the radiative forcing for various substances, but is not the level from which most radiation comes. Note that for observational data sets, the TOA usually refers to the altitude of the satellites on which the instruments are mounted, or 70 Km (which ever is higher).
3) Finally, yes, the average altitude of effective radiation to space differs for different chemical compounds, and for different wave numbers (a unit of frequency). This can be illustrated by this diagram from Conrath et al (1970), showing model calculated and observed upward IR radiation at the TOA (ie, the altitude of the satellite):
The black body temperature curves for various temperatures are shown on the graph. Where they intersect the upward IR spectrum, radiation at that wave number has an average temperature equal to the temperature of the black body curve. If we then know the surface temperature and the lapse rate, we can then calculate the average altitude of radiation for that wave number. Unfortunately I have lost my copy of Conrath et al due to a faulty hard drive, so I do not know the correct values. However, the flat trough at the bottom of the CO2 absorption band (approx 600 - 700 cm^-1) represents the tropopause, while the the small spike in the center at approx 666 cm^-1 is the region of peak absorption by CO2, and has an average altitude of radition in the stratosphere (hence the higher temperatures).
The average altitude of radiation for water vapour and methane are much lower, being around 3 km as can be seen in this full spectrum reproduced by Science of Doom (via Goody 1989):
I hope that helps.
Tom
I have a copy of Conrath. If you want I can email you a copy
Thankyou Glenn. Much appreciated. I am somewhat loathe to pay twice for the same paper as you can imagine.
How does that spectrum show warming?
There are large chunks taken out of the continous spectra by water and co2. A lowered intensity is not heat,
Increased absorption always means a larger temperature difference, as absorption increase with the difference.
That spectrum shows cooling.
In few words this link provides the information about the reason for surface not absorbing low frequency energy.
A surface much hotter than a molecule absorbing a couple of wavelengths and emitting only that same energy, while the surface emission is continous, will not have available energy levels for such low quality energy. Emitting continously across the spectrum from a dense solid matter constantly sharing all energy within by kinetic interaction, will automatically have those energy states populated. It is transparent to those photons.
Reason is quantum mechanics.
http://hyperphysics.phy-astr.gsu.edu/hbase/mod3.html
"The energy levels for all physical processes at the atomic and molecular levels are quantized, and if there are no available quantized energy levels with spacings which match the quantum energy of the incident radiation, then the material will be transparent to that radiation, and it will pass through."
[PS] If you want to engage with people on science please stick to commenting one or two thread and follow through there please before moving onto another topic. Spamming lots of threads is no way to seek engagement. And if you arent interested in engaging with the science, then please amuse yourself elsewhere.
How can the watts per meter squared by divided by four when watts are a measure of energy per second (related to joules)? If the area is increased from one meter to the whole earth then the time interval must be increased to one whole day. If one wishes to know how much the whole earth receives from the Sun in one second then one should divide by two. Because the area of a sphere is 4 pi r^2, and one hemisphere is 2 pi r^2 the solar input averaged over the whole Earth would be half that of one hemisphere and not divisible by four. Then, what justification is there for dividing the watts per meter squared by four? If the light is treated as if spread (due to the curvature) from one cross section to twice that area on one hemisphere it is (to use Postma's word) "diluted" by 2 and not by four.
Dear Nhqjo5kgDyNtNJLX683t:
This has come up recently on this thread:
https://skepticalscience.com/argument.php?a=18&p=26#132128
Radiation in or out of a horizontal surface is expressed as W/m2 (flux density) because douibling the area doibles the energy involved. Yes a Watt is a Joule per second - you get a total in Joules if you sum over time.
The division by four is correct, though: IR is emitted vertically, i.e., perpendicular to the earth's surface. To get total IR in Joules you multiply by the entire earth's surface (4*pi*r3).
Solar radiation is not received vertically at all points on the earth's surface, though. In fact, at any instant in time, there is only one location on earth where the sun is directly overhead. Everywhere else, the sun's rays strike at an oblique angle. The solar intenstity, as measured per unit area of the earth's surface, is reduced according to the cosine law - by a factor of 1/cos(z), where z is the angle between the sun's rays and the local vertical.
If you like calculuis, you could integerate the 1/cos(z) relationship over the entire surface. If you prefer trignonometry, the total sunlight received by the earth is proprtiional to the area of a circle of radius r - area=pi*r2.
The ratio of the two is 1/4, not 1/2.
To visualize the sun's reduced intensity, imaging trying to read a book by candlelight. You can probably manage if you hold the book perpendicular to the light coming from the candle, but as you turn the book obliquely, the light intercepted by the book's page will decrease. By the time the page is parallel to the candle's beam, the page captures no light at all. Think of the sun the same way" at sunrise or sunset, a book lying horizontally gets no direct sunlight at all - only the skylight.
I'm asking here because I can't see a better place.
Einstein (1917) "A Quantum Theory of Radiation" described 3 types of emission; spontaneous emission, induced emission, and stimulated emission.
For an induced emission of a photon, the emission of an identical photon is simultaneous and in the same direction as the incident adsorbed photon due to the conservation of momentum, no matter how small. Same for stimulated emission (?).
Pierrehumbert (2011) says the momentum goes into changing the internal energy of the molecule which then undergoes spontaneous emission at some random time in some random direction and thereby he seems to be saying there can be no induced emission. At least that is my understanding of the two papers. (Given the usual boundary conditions, i.e. ideal gas, thermodynamic equilibrium, etc.)
My confusion is why is there no induced emission when a GHG molecule adsorbs an incident photon and conservation of momentum can be ignored like Pierrehumbert says. Also, wouldn't there be some stimulated emissions from an excited GHG molecule from the passing of a photon of the required frequency?
Brian Hughes @93,
I'm not familiar with "induced emission" but...
"Spontaneous emission" is the mechanism where an excited molecule drops to a lower energy state and doing so emits a photon. The direction is any-which-way because the reason for the excited state is almost always due to collision with fellow gas molecules. These collisions happen in micro-seconds so an excited molecule (be it by the absorption of a photon or by collision) will have very little chance to undergo spontaneous emission which on average takes tenths-of-a-second but there are a great number of molecules entering that excited state due overwhelmingly to collision.
"Stimulated emission" is when a passing photon 'drags' a photon out of an excited mollecule and this will be in the same direction as the passing photon. This will occur within the GH-effect but as photons have a comparatively short path-length, they are themselves going any-which-way and thus these extra "stimulated emissions" will not constitute some extra directional flux of energy.
I am no expert but I have a feeling that "induced emission" is just another name for "stimulated emission."
Brian Hughes - Your description of "induced emission" matches the textbook definition of "stimulated emission"; I think you have two terms for the same phenomena.
Stimulated emission (to be of any significance) requires several things: You need a population inversion, with more molecules at higher energies than statistically normal when undisturbed - this requires additional energy pumped in. The emission will quickly die off without an optical resonating cavity, as photons leave the pumped site. And to make use of that energy, one end of the resonating cavity should be 'leaky'. The result is a projection of coherent light powered by the 'pumping'. Without these supports any stimulated emission results in just one (fairly infrequent) photon exchange.
In short, you need a laser. Or for microwave frequencies, a maser.
Stimulated emission just isn't a factor in GHG energy exchanges. Spontaneous emission over a molecularly associated characteristic spectra, on the other hand, is.
Toy Models, Free Body Diagrams, and the Debunk of Climate Science - "SkepticalScience"
www.youtube.com/watch?v=Y4CL2_A4-Xs
[DB] Science does not advance via Youtube video. As such, your efforts lend you little credibility.
Thank you for taking the time to share with us. Skeptical Science is a user forum wherein the science of climate change can be discussed from the standpoint of the science itself. Ideology and politics get checked at the keyboard. What matters here is domain knowledge, command of the science and the ability to cite credible papers appearing in the peer-reviewed quality literature that support the tenets of one's claims.
Please take the time to review the Comments Policy and ensure future comments are in full compliance with it. Thanks for your understanding and compliance in this matter.
Ptolemy's Epicycles solve Climate Change
www.youtube.com/watch?v=PkHuTIC-DxI
[DB] NASA has ruled out orbital effects as significant factor in the observed warming of the past 100 years, here and here.
Please stay on-topic.
Here's a video DEMONSTRATING the scientific peer review process from the American Meteorological Society, and thus, it satisfies the requirement that "the science of climate change can be discussed from the standpoint of the science itself".
www.youtube.com/watch?v=kUNQTyH76j0
Enjoy! It is quite a scientifcally educational video to watch how the peer-review process proceeds in climate science.
[DB] Off-topic snipped.
Please stay on-topic.
JPostma - Would have to ask: to you have trouble comprehending the comments policy on this site; or are you just trying to get banned as quickly as possible?