


 Arguments


How do we know more CO2 is causing warming?
What the science says...
| Select a level... |
 Basic
Basic
|
 Intermediate
|
 Advanced
| ||||
|
An enhanced greenhouse effect from CO2 has been confirmed by multiple lines of empirical evidence. |
|||||||
Climate Myth...
Increasing CO2 has little to no effect
"While major green house gas H2O substantially warms the Earth, minor green house gases such as CO2 have little effect.... The 6-fold increase in hydrocarbon use since 1940 has had no noticeable effect on atmospheric temperature ... " (Environmental Effects of Increased Atmospheric Carbon Dioxide)
At-a-glance
To make a statement like, "minor greenhouse gases such as CO2 have little effect", is to ignore 160 years of science history. So let's look at who figured out the heat-trapping properties of carbon dioxide and when.
Experiments involving various gas mixtures had demonstrated the heat-trapping properties of water vapour, CO2 and methane in the 1850s. But those effects were yet to be quantified - there were no meaningful numbers. It was to be another 40 years before that happened.
Swedish scientist Svante Arrhenius (1859-1927) was the person who crunched the numbers. The results were presented in a remarkable paper, "On the Influence of Carbonic Acid in the Air upon the Temperature of the Ground", in 1896.
The many calculations in the 1896 paper include estimates of the amounts of CO2 increase or decrease required to drive the climate into a different state. One example used was the Hothouse climate of the Cenozoic, around 50 million years ago. Another was the glaciations of the last few hundred millennia.
To get a temperature rise of 8-9°C in the Arctic, Arrhenius calculated that CO2 levels would have to increase by 2.5 to 3 times 1890s levels. To lower the temperature 4–5°C to return to glacial conditions, he calculated a drop in CO2 was needed of 0.62-0.55 times 1890s levels.
We know CO2 levels in the 1890s from ice-core data. They were around 295 ppm. Let's do the sums. A reduction factor of 0.55 to 0.62 on 295 ppm gives 162.2-183.9 ppm. Modern ice-core measurements representing the past 800,000 years show that in glacial periods, CO2 levels fell to 170-180 ppm.
What we now know due to additional research since 1896 when Arrhenius worked on this, is that CO2 was an essential 'amplifying feedback'. That means changes triggered by long term, cyclic variations in Earth's orbit cause warming or cooling and CO2 release or entrapment in turn. Those changes in CO2 levels affected the strength of Earth's greenhouse effect. Changes in the strength of the greenhouse effect then completed the job of pushing conditions from interglacial to glacial - or vice-versa.
Arrhenius also made an important point regarding water vapour: "From observations made during balloon voyages, we know also that the distribution of the aqueous vapour may be very irregular, and different from the ideal mean distribution." This statement holds true today: water vapour is a greenhouse gas but because water exists in gas, liquid and solid forms in the atmosphere, it is continually cycling in and out of the air. It is distributed in a highly uneven fashion and is uncommon in the upper atmosphere. That's where it differs from CO2.
Once CO2 is up there, it's up there for a long time. As a consequence it has a pretty even distribution: 'well-mixed' is the term. As Arrhenius quantified all that time ago, once it's up there it constantly absorbs and re-radiates heat in all directions. That's why dumping 44 billion tons of it into our atmosphere in just one year (2019 - IPCC Sixth Assessment Report 2022) is a really bad idea.
Please use this form to provide feedback about this new "At a glance" section. Read a more technical version below or dig deeper via the tabs above!
Further details
Good scientific theories are said to have ‘predictive power’. In other words, armed only with a theory, we should be able to make predictions about a subject. If the theory’s any good, the predictions will come true.
Here’s an example: when the Periodic Table of the chemical elements was proposed in 1869, many elements were yet to be discovered. Using the theory behind the Periodic Table, the Russian chemist Dmitri Mendeleev was able to predict the properties of germanium, gallium and scandium prior to their discovery in 1886, 1875 and 1879 respectively. His predictions were found to be correct.
The effect on Earth's greenhouse effect of adding man-made CO2 is predicted in the theory of greenhouse gases. This theory was first proposed by Swedish scientist Svante Arrhenius in 1896, based on earlier work by Fourier, Foote and Tyndall. Many scientists have refined the theory since Arrhenius published his work in 1896. Nearly all have reached the same conclusion: if we increase the amount of greenhouse gases in the atmosphere, the Earth will warm up.
Where there is less agreement is with respect to the exact amount of warming. This issue is called 'climate sensitivity', the amount the temperatures will increase if CO2 is doubled from pre-industrial levels. Climate models have predicted the least temperature rise would be on average 1.65°C (2.97°F) , but upper estimates vary a lot, averaging 5.2°C (9.36°F). Current best estimates are for a rise of around 3°C (5.4°F), with a likely maximum of 4.5°C (8.1°F). A key reason for this range of outcomes is because of the large number of potential climate feedbacks and their variable interactions with one another. Put simply, some are much better understood than others.
What Goes Down…
The greenhouse effect works like this: Energy arrives from the sun in the form of visible light and ultraviolet radiation. The Earth then emits some of this energy as infrared radiation. Greenhouse gases in the atmosphere 'capture' some of this heat, then re-emit it in all directions - including back to the Earth's surface.
Through this process, CO2 and other greenhouse gases keep the Earth’s surface 33°Celsius (59.4°F) warmer than it would be without them. We have added 42% more CO2, and temperatures have gone up. There should be some evidence that links CO2 to the temperature rise.
So far, the average global temperature has gone up by more than 1 degrees C (1.9°F):
"According to an ongoing temperature analysis led by scientists at NASA’s Goddard Institute for Space Studies (GISS), the average global temperature on Earth has increased by at least 1.1° Celsius (1.9° Fahrenheit) since 1880. The majority of the warming has occurred since 1975, at a rate of roughly 0.15 to 0.20°C per decade."
The temperatures are going up, just like the theory predicted. But where’s the connection with CO2, or other greenhouse gases like methane, ozone or nitrous oxide?
The connection can be found in the spectrum of greenhouse radiation. Using high-resolution FTIR spectroscopy, we can measure the exact wavelengths of long-wave (infrared) radiation reaching the ground.
Figure 1: Spectrum of the greenhouse radiation measured at the surface. Greenhouse effect from water vapour is filtered out, showing the contributions of other greenhouse gases (Evans 2006).
Sure enough, we can see that CO2 is adding considerable warming, along with ozone (O3) and methane (CH4). This is called surface radiative forcing, and the measurements are part of the empirical evidence that CO2 is causing the warming.
...Must Go Up
How long has CO2 been contributing to increased warming? According to NASA, “Two-thirds of the warming has occurred since 1975”. Is there a reliable way to identify CO2’s influence on temperatures over that period?
There is: we can measure the wavelengths of long-wave radiation leaving the Earth (upward radiation). Satellites have recorded the Earth's outgoing radiation. We can examine the spectrum of upward long-wave radiation in 1970 and 1997 to see if there are changes.
Figure 2: Change in spectrum from 1970 to 1996 due to trace gases. 'Brightness temperature' indicates equivalent blackbody temperature (Harries et al. 2001).
This time, we see that during the period when temperatures increased the most, emissions of upward radiation have decreased through radiative trapping at exactly the same wavenumbers as they increased for downward radiation. The same greenhouse gases are identified: CO2, methane, ozone and so on.
The Empirical Evidence
As temperatures started to rise, scientists became more and more interested in the cause. Many theories were proposed. All save one have fallen by the wayside, discarded for lack of evidence. One theory alone has stood the test of time, strengthened by experiments.
We have known CO2 absorbs and re-emits longwave radiation, since the days of Foote, Tyndall and Arrhenius in the 19th Century. The theory of greenhouse gases predicts that if we increase the proportion of greenhouse gases, more warming will occur.
Scientists have measured the influence of CO2 on both incoming solar energy and outgoing long-wave radiation. Less longwave radiation is escaping to space at the specific wavelengths of greenhouse gases. Increased longwave radiation is measured at the surface of the Earth at the same wavelengths.
Last updated on 16 July 2023 by John Mason. View Archives


fred.steffen
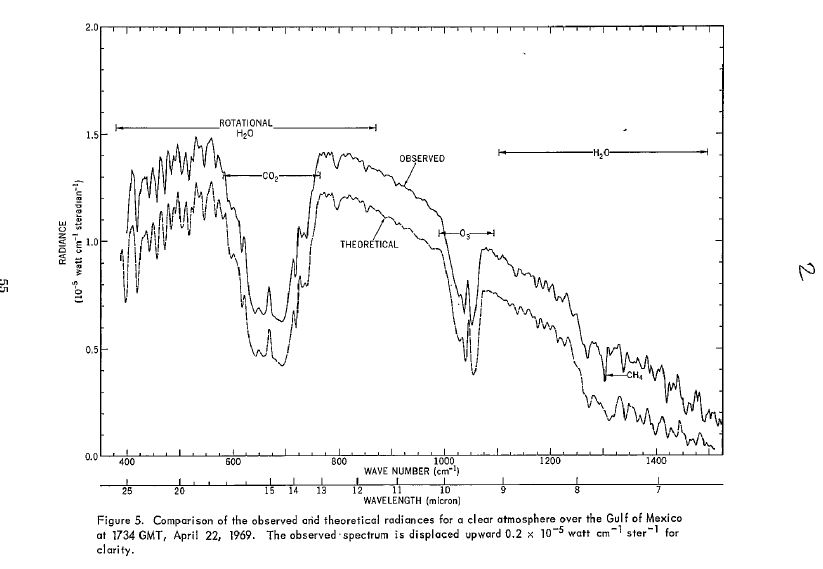
Here is the actual infra-red spectrum for a point on the earth. Taken by the Nimbus 3 satellite in 1969. The top curve is what the satellite observed, the bottom was calculated from radiation transfer theory. The top curve has been shifted up for clarity. In fact they match almost perfectly. The graph shown by Tom Curtis at comment 163 shows the left hand half of this curve without the offset, and also the Planck curves associated with different temperatures. You could also look at the full curve from theory shown by Tom at comment 154.
The peak of the curve is at a wavenumber of around 600 cm-1. That's a wavelength of around 17 microns. And as you can see from the graph below, emissions have dropped away to virtually nothing at 3 and 4 micron's so CO2's absorption peaks there have virtually no effect.
So sorry, firstly, Tim Ball is just flat out wrong.
Next, the large notch at around the 15 micron point, due to CO2, is close to the peak of the emission curve, so CO2 is active in some of the most important part of the spectrum.
Water vapour across most of the spectrum we are interested in here is a weaker absorber proportionally than CO2, except at the far right. However, as you point out, H2O is far more abundant in the lower atmosphere and this makes up for that so that H2O is a significant absorber across the spectrum at low altitudes. Importantly however, H2O concentrations drop sharply as one goes to higher altitudes because it condenses. By the time one reaches the stratosphere water vapour is almost non-existant - 0.0001% or less. So this reduces the contribution possible from water hugely.
If water didn't condense, and water vapour was several % of the atmosphere right up into the stratosphere then most of the regions on this graph showing H2O absorption would be down at the same levels as the bottom of the CO2 notch. Much less energy would be able to get out to space, the GH effect would be very much hotter, and the Earth would be an inferno.
So the common figures estimated for the relative contributions of different things to the GH effect are around :
H2O - 50%
Clouds - 25%
CO2 - 20%
Other gases - 5%
Also, look at the graph I have posted at comment 191. That is the raw data for how absorbent CO2 is across the wavelengths we are interested in. Spectral Intensity is the raw number that is the starting point for calculating absorptivity, but the relative strengths at different wavelengths are still a strong indicator of the relative absorptivity of CO2 at different wavelengths. Not that the vertical scale is logarithmic so 6 orders of magnitude variation.
However at sea level pressures and temperatures, due to the speed molecules are moving at and the frequency of collisions, this spectrum gets smeared out and CO2 absorbs quite well over most of the range indicated by the notch in my diagram here. It doesn't just absorb at 15 microns.
As for what happens when a molecule absorbs a photon. It takes many, many milliseconds before the molecule can re-emit a photon. However that molecule will undergoes billions of collisions a second with other molecules. So mostly the absorbed energy is transferred to surrounding molecules in the air rather than re-radiated. It is 'thermalised'.
So how does any re-radiation occur? Absorbing a photon isn't the only way a GH molecule can become more energised. Through the continuous collisions between molecules a proportion of all the GH molecules are in a higher energy state naturally. The vast majority of high energy GH molecules are energised because of collisions, not by absorbing a photon. And from this very, very much larger pool of energised GH molecules a small percentage do manage to de-energise by emitting a photon.
So there is no coupling between the wavelength of a photon absorbed, and the wavelength of a photon emitted. It isn't the same molecule involved.
fred.steffen @200, my assumption is that the IR camera was tuned to a specific wavelength (probably 15 micro-meters). That being the case, the experiment would indeed show the same thing.
@199
Here is an observed IR spectrum with black body curves for various temperatures overlaid:
As you can see, the back bodies radiate even at 6 micro-meters, even at 200 K. Indeed, using a radiance calculator, we can determine that even at 2.5 micro-meters, a black body at 200 K still radiates 0.00039 mW/m^2 sr per micro-meter. At 240 K, that rises to 0.047 mW/m^2 sr per micro-meter. At 288 K, to 0.26 mW/m^2 sr per micro-meter. At 288 K, that rises to 2.9 mW/m^2 sr per micro-meter at 3 micro-meters, and to 43.8 mW/m^2 sr per micro-meter. You will note the different unit to that used on the chart. In any event, it is fair to say the Earth's black body radiation is inconsequential at those wavelengths, but not that it does not exist.
Further, CO2 absorbs at more than just those wavelengths. Specifically, the small notch in the observed chart at 12.5 and at 11.5 micro-meters are both due to CO2. What is true is that only at those wave-lengths (and a significant band on either side of them) is the optical depth of the atmosphere due to CO2 greater than 1 (ie, all IR radiation of that wavelength from the surface is absorbed before it reaches space, but not all that is emitted in the atmosphere).
Using Wien's Displacement Law, the peak radiation for 255 K (Earth's effective radiative temperaure), peak intensity is at 11.36 micro-meters, while for the 288 K (approximate Global Mean Surface Temperature) it is 10.06 micro-meters. However, the term "around" us excessively vague in this context. At 288 K, the IR radiation at all wavelengths lower than 10.06 micrometers is stronger than the equivalent radiation for any lower temperature, even if their radiation is "around" that particular wavelength; and as can be seen on the chart above, the Earth's black body radiation is still significant out to 6 to 7 micrometers.
That is entirely an artifact of the units used on the x-axis. If a unit of frequency is used (as above), the 15 micro-meter absorption band is located near the point of peak emission. The difference in unit also makes a difference of the location of the peak (which is a measure of intensity per unit on the x axis). Using wavelength, it is shifted further to the left, and spread out because of the large number of wavelengths covered. The crucial point is the area of the 'absorption band', which is the same regardless of units on the x-axis. Averaged across the Earth, and across all weather conditions, that represents about 20% of all absorption (25% exlcluding the H2O overlaps).
Once a CO2 molecule absorbs a 15 micro-meter photon it is far more likely to distribute the energy to the rest of the atmosphere by collissions than to re-emit it, but once it absorbs energy by collisions it is just as likely to emit it as a 15 micro-meter photon as if it has originally absorbed the energy as a photon. If the temperature of the gas is the same as that of the incoming radiation, the net effect will be that CO2 will emit just as much radiation as it absorbs. If the CO2 is warmer than that radiation, it will emit more than it absorbs; but if it is cooler it will emit less than it absorbs. Crucially, the atmosphere gets colder as you get higher, so CO2 is a net absorber of IR radiation in the atmosphere. That is how the greenhouse effect works.
(As an aside, I have often seen it argued that because CO2 will dissipate energy gained by radiation through collisions, there can be no greenhouse effect. It is a bizarre argument. If it did not dissipate the energy, it would of necessity emit as much as it absorbs thereby preventing any greenhoue effect. Ignorance is used to turn a cause of the greenhouse effect into a pseudo-argument against it.)
Again, look at the observed spectrum above. There is no absorption band at 10 micro-meters, which means no molecule in the atmosphere absorbs at 10 micrometers. Ergo no molecule emits at 10 micrometers. In fact, in the troposphere, except for clouds (that do absorb and emit at all frequencies), all IR emission is done by CO2, H2O, CH4, NO2, O3 or one of the other minor greenhouse gases. Because or the strength and relative abundance, almost all of that remission is by H2O or CO2.
No because - energy increases with the fourth power of temperature - because CO2 is not the only GHG - and most importantly, because IR radiation represents only 69% of energy flow into the atmoshpere:
This is the crux of the issue, and related to the most common misunderstanding about the greenhouse effect. The greenhouse effect is first, and foremost, a theory about preserving conservation of energy for radiation between the Earth and space. Therefore it is the radiation from the level where the energy actually reaches space that is crucial to the strength of the greenhouse effect. The back radiation (the "thermal down surface" in the above diagram) is often taken to be the greenhouse effect, but it is in fact a secondary consequence. If it was stronger or weaker, there would merely be a shift in the rate of convection counterbalancing that effect until the actual radiation to space was equalized.
Now, the crucial thing about H2O is that if it gets cold, it precipitates out of the atmosphere. As a result, at the altitude at which CO2 radiates to space there is almost no H2O. Consequently the entirety of the notch around 15 micrometers in the first graph in this post is due to CO2, even though almost the entirety of the back radiation (except at the poles and in deserts) is due to H2O. The overlap is significant relative the situation with no CO2 because in that case H2O would preserve 20% of the greenhouse effect of CO2 in its absence (along with its own effect from the areas with no overlap). Taking that into account, it has been determined that 20% of the total greenhouse effect is due to CO2 determined on a counterfactual basis. If it was determined on a basis of molecule of last emission, that would rise up towards 25%.
Finally, even with only 20% of the effect, if you removed CO2, things would get a lot colder. Somewhere on the order of 9 K colder globally averaged with no feedbacks. Because water precipitates out when it gets cold, that would reduce the H2O greenhouse effect, making it colder again. Once the cycle repeats through to its assmptote, the net effect is that close to 100% of the greenhouse effect would be eliminated.
Fred Steffan - See this video for just such an experiment. The candle disappears as intervening CO2 increases.
@Glenn Tamblyn and @Tom Curtis, thank you very much for the information! I'm gonna try and get my head around all of that. I'll come back with more questions if I have any :)
fred.steffen
In addition to the radiance calculator Tom linked to, take a look at this site from the Uni of Chicago. It uses the Modtran radiative transfer code to allow you to do what if's with IR emissions for different situations.
Pick an atmospheric temperature/cloud profile, set your different GH gases then see what would be observed at different heights.
Comment 191 shows a graph of log intensity with the units cm^2/cm-mol. I assuming that I(l,v) = I(0,v)) x 10^(-a x C x l), where I(l,v) is the intensity of radiation of frequency v at distance l, a is the absorption coefficient, and C is the concentration of the gas, presumably in moles/cm^3. Am I correct in assuming that the intensity is per a wavelength band one reciprocal cm in width? Am I also correct in assuming that if the log intensity in the units given is -20, then the absorption coefficient is 20. Finally, if I want to compute the IR emissivity, can I just use the Beer's law equation multiplied by the energy per photon and the Boltzmann ratio of excited to ground state at the temperature of the gas? It has been a very long time since I have done these kinds of calculations, and I am not sure I am properly understanding what I am reading.
bicyclebob
No, it isn't per a single cm-1 wide, it is much narrower than that. And no, the absorption coefficient isn't just the inverse of the spectral intensity. And at that point everything gets a lot more complicated.
SpectralCalc have a description of some of the calculations and theory here. But I suspect getting to Beer-Lambert from this still involves more stuff.
It always amazes me how simple rules and laws always end up being so complex when we look under the hood.
bicyclebob:
Glenn's comment not-withstanding, but yes spectral radiation is typically expressed in units that include a "per unit length" term. If you think of total energy flux in the radiation as W/m^2 (1 Joule per second, for each m^2 of surface), when you divide that total into a "per wavelength" - i.e. spectral - distribution, you are of necessity divding by the units "wavelength" is measured in. Micrometers or nanometers are common, but there is nothing odd about centimetres, so you get the cm-1 term. When you integrate over all wavelengths to get a total, you are multiplying wavelength times the "per wavelength" units and cancelling them back out.
Although Beer's Law (the equation you give) is appropriate for determining the absorption of the IR radiation, the emission of IR becomes more complex, as Glenn states. Although absorptivity = emissivity at a specific wavelength for a specific gas, actual emission involves temperature, too.
"Radiative forcing" is such a contrived and meaningless term. It is simply an attempt to dismiss water vapor's dominant significance. The infrared spectra for water vapor strongly resembles that of carbon dioxide, and in fact the former is even more powerful at capturing IR radiation. The unscientific nature of the Keeling Curve reflects the author's attempt to instill fear, rather than communicate truth and knowledge. The Keeling Curve is blatantly dishonest [snip]because (1) it does not have a zero base and therefore is strongly skewed as to slope, and (2) does not include the dominant greenhouse gas, water vapor.
Simply making these two adjustments changes it from this:
to this:
[RH] Please keep your images down to 500px in width.
Warnings and snips due to commenter not reading the SkS commenting policies.
Incidentally, the profound effect of water vapor on warming is clearly and demonstrably felt on cloudy nights, where water acts as a powerful blanket, warming local temperatures. The carbon dioxide concentration does not vary remotely as much as humidity, so that on cool, clear nights, the "forcing" argument is out the window, along with heat.
On a side note, another bogus claim is that "increasing ocean acidification" (sic) results from higher carbon dioxide concentrations dissolving in ocean water.
1. The ocean is not "acidic," it is alkaline. In fact, it is 18 times more alkaline than pure water. (The pH scale is logarithmic, and ocean water has a pH of ~8.2)
2. Degassification is a primary natural source of carbon dioxide. It leaves the ocean, rather than dissolving in it.
“One has to free oneself from the illusion that international climate policy is environmental policy. We redistribute de facto the world’s wealth by climate policy.” – Ottmar Edenhofer, who co-chaired the U.N.’s Intergovernmental Panel on Climate Change working group on Mitigation of Climate Change from 2008 to 2015
RenaissanceMan @209.
The choice of vertical scale on a graph of CO2 concentrations is hardily science. And the relative position of a red line on a piece of paper does not determine the contribution of CO2 on global climate forcing. The atmospheric levels of CO2 presented on both of your graphs is roughly consistent (you appear to plot CO2 some 50ppm too high on the lower graph) and it is atmospheric levels which determine forcing.
Yet you accuse the Keeling Curve of having an "unscientific nature." Have you any reason for such a claim? Setting out your claims in scientific terms would be the proper thing to do, if you are able.
The misnamed RenaissanceMan (hereafter RM) @210 quotes Ottmar Edenhofer as saying:
The quote is a translation of a comment Edenhoffer made in an interview, where in response to the interviewer saying:
Edenhoffer replied:
(Note that the translation is by Philip Mueller, apparently for the Global Warming Policy Foundation. As that organization has repeatedly proven itself an unreliable source, I do not trust the translation, but not speaking German, must relly on it.)
Stating the obvious first, RM, or his source, has reversed the order of the two sentences he does include in the quote, and deleted three of five sentences in the paragraph, one from between the two sentences, and all without any indication of the deleted sentences existence. That sort of manipulation of other peoples words is, in academic situations considers fraud. That is because the meaning of any sentence depends on its context - and RM (or his source) completely butchers the context whilst trying to hide the fact that they have done so. So, at best RM rellies on a fraudulent source without fact checking. I note that Larry Bell similarly butchers the text in an article for Forbes. CFACT also butchers the quote, but again not in an identical form. Simon Downing also has a similar, but distinct butchering. It appears that AGW deniers are almost as bad as creationists when it comes to lying by out of context quotation. But I can find no evidence that RM is not himself an original butcher of the quote; and hence a perpetrator of a deliberate fraud.
So what is the context of the quote, and how does it effect things? Well, to begin with Edenhofer had already stated clearly, in the immediately preceding response that:
That is, he has clearly acknowledged the objective of climate policy, ie, to keep the increase in Global Means Surface Temperature to 2 degrees celsius or less. But in doing so, he notes that the policy necessarilly will have impacts beyond the environmental, and specifically economic impacts. He clarrifies what that means afterwords. Specifically, the choice of different responses to AGW will de facto result in different consequences for the distribution of global wealth. He has already mentioned one example in the response before that (ie, two responses before the one RM, or source, butchered):
I might note that the current approach, of limits on emissions as a percentage of a nations current emissions locks in higher living standards for the first world as part of the treaty system well into the future.
No reasonable climate policy can be devised without noting, and negotiating these de facto effects. But they are, as Edenhofer clearly states, even in the butchered version of the quote, de facto effects. That is, consequences that were not the intended consequence of the policy.
[PS] You know better. Please dont roll in the mud with the pigs.
MARoger@211:
[snip]
"The choice of vertical scale on a graph of CO2 concentrations is hardily science. "
The root word for science is "scientia," Latin for knowledge. An essential component of knowledge is the accurate and honest presentation of such knowledge. The choice of presenting data to skew the slope of a graph can be demonstrated by a graph of a population explosion with a base of 1,000,000 and a top at 1,000,001, sharply sloping upward.
"And the relative position of a red line on a piece of paper does not determine the contribution of CO2 on global climate forcing. The atmospheric levels of CO2 presented on both of your graphs is roughly consistent (you appear to plot CO2 some 50ppm too high on the lower graph) and it is atmospheric levels which determine forcing."
As to CO2 being "forcing," infrared radiation is absorbed by water vapor and by carbon dioxide in virtually identical spectra, which I shall not bother to reproduce here.
"Yet you accuse the Keeling Curve of having an "unscientific nature." Have you any reason for such a claim? Setting out your claims in scientific terms would be the proper thing to do, if you are able."
I explained the etiology of the word "science" above, and for many I suspect this is their first such exposure. Your condescension, "if you are able," was conveniently overlooked by the moderator(s) who seem eager to jump on anyone posting a word contrary to the "97%". Elsewhere I am called a "denier" and the moderator ignored this blatant violation of the "rules" I just read. The moderator also ignored the religious reference by that same poster which I shall address more specifically in another post.
Finally, I am forbidden by the rules here from stating why I believe the Keeling Curve (1) has a steep slope, based on its non-zero base, and (2) based on its failure to include the dominant greenhouse gas, water vapor.
[RH] Snipped for condescending tone. Trust me. People here know the definition of the word "science." Please, either raise the level of the conversation to one worth of science or risk further deleted comments.
Tom Curtis@212:
"The misnamed RenaissanceMan...."
I could have sworn I read rules for this forum that ad hominem attacks were forbidden. Obviously that restriction does not apply to the "97%."
Tom Curtis has not the slightest basis for claiming that my good friend, who has known me very well for many years "misnamed" me. Tom has no basis; my good friend has a very broad and familiar basis indeed.
""Basically it's a big mistake to discuss climate policy separately from the major themes of globalization. The climate summit in Cancun at the end of the month is not a climate conference, but one of the largest economic conferences since the Second World War. Why? Because we have 11,000 gigatons of carbon in the coal reserves in the soil under our feet - and we must emit only 400 gigatons in the atmosphere if we want to keep the 2-degree target. 11 000 to 400 - there is no getting around the fact that most of the fossil reserves must remain in the soil."
1. Do conventions at Cancun, and Davos Switzerland, and at expensive resorts all around the world, widely attended at taxpayer expense, with not just dozens, not just scores, but hundreds of private jets arriving to deliver those who claim we must all cut back on fossil fuel useage advance this essential objective of keeping fossil fuels in the ground?
2. Do the habits of such people as Barack Obama, and Al Gore, and all the Hollywood rich and famous flying everywhere in private jets, riding on their large yachts keep fossil fuels in the ground, and advance the demand that we cut back fossil fuel use by some 80%/
3. Why does every conceivable magazine which supports the 97% feature countless advertisements for foreign travel, from Sierra, to National Geographic, to Audubon, to all of them?
4. Increasingly onerous restrictions, fees, cap and trade, and other actions drive up the cost of electricity and travel for even the poorest people worldwide. President Obama even bragged that his policies would double the cost of electricity. How can anyone support these reprehensible actions? People in Haiti resorted to eating dirt pies after the cost of corn skyrocketed due to its demand for ethanol.
5. "Ecotour" - a one-word oxymoron, an indefensible pretense.
Renaissance Man,
Denial Depot has an entire post on how Skeptical Science adjusts graphs like you state. Perhaps you can elaborate on how the CO2 graph should be made. Of course, it is a sham science site, but it has funny stuff.
I teach Science in High School and College and if a student were to submit the CO2 graph with zero in the Y axis I would take off points because they did not fill the page with their graph. You are mistaken with your assertion that the zero has to be included. Read the linked post to see how your argument looks carried to its logical conclusion.
CO2 is the thermostat that sets where the concentration of water in the atmosphere is. Water follows the CO2.
Renaissance Man, you claimed: "As to CO2 being "forcing," infrared radiation is absorbed by water vapor and by carbon dioxide in virtually identical spectra, which I shall not bother to reproduce here."
You were incorrect on two counts:
1. CO2 increase indeed is a forcing, but water vapor increases are a feedback to warming, not a forcing, as Michael Sweet pointed out to you. Read the post "Explaining how the water vapor greenhouse effect works"--first its Basic tabbed pane, then its Intermediate tabbed pane. If you want to argue/discuss/query further on that topic, do so in the comment thread on that post, not this one.
2. CO2 and H2O absorption do not entirely overlap. From physicist and historian Spencer Weart's "Discovery of Global Warming":
The early experiments that sent radiation through gases in a tube, measuring bands of the spectrum at sea-level pressure and temperature, had been misleading. The bands seen at sea level were actually made up of overlapping spectral lines, which in the primitive early instruments had been smeared out into broad bands. Improved physics theory and precise laboratory measurements in the 1940s and after encouraged a new way of looking at the absorption. Scientists were especially struck to find that at low pressure and temperature, each band resolved into a cluster of sharply defined lines, like a picket fence, with gaps between the lines where radiation would get through.(24) As Hulburt and Callendar had claimed, the most important CO2 absorption lines did not lie exactly on top of water vapor lines. Instead of two overlapping bands, there were two sets of narrow lines with spaces for radiation to slip through.
You should read more from that source, after that passage.
michael sweet@215:
"Denial Depot has an entire post on how Skeptical Science adjusts graphs like you state. Perhaps you can elaborate on how the CO2 graph should be made. Of course, it is a sham science site, but it has funny stuff."
1. How is it that you can make fun of the opposition here, but nobody is permitted to make fun of your theories and hypotheses? The moderator(s) would quickly come down on anyone daring to call climate change "sham science."
[PS] The moderator would come down quickly on accusation of fraud but not on arguments against arguments that are backed in scientific way.
2. I just posted the proper graph, which of course includes water vapor, the dominant greenhouse gas. The resultant greenhouse gas "curve" is about as flat as a pool table.
"I teach Science in High School and College and if a student were to submit the CO2 graph with zero in the Y axis I would take off points because they did not fill the page with their graph."
Because you teach in such a manner does not remotely make it right. I have never heard of such a trivial argument as "fill(ing) the page" with a graph. How about writing bigger! That should be neat. I repeat, the objective is information and its clear communication. Perspective is an essential component of communication.
"You are mistaken with your assertion that the zero has to be included."
No, you are mistaken when you assert that a page must be filled with a graph, and when you clearly believe that exaggeration is meaningless.
[PS] The numerous text books and guides on scientific graphing do not support your argument. Provide a reference which does. Inappropriate scales instead are the common tools of misinformation. A simple example would be to plot temperature over last 1million years in Kelvin and insist on graph starting at zero. This gives a flat line for all intents and purposes so ice ages arent significant right?
"CO2 is the thermostat that sets where the concentration of water in the atmosphere is. Water follows the CO2."
You should not be teaching science. You don't understand the vapor pressure/temperature relationship at all. Water doesn't "follow" CO2 or air. It really can exist independently, as a function of temperature and pressure.
Prev 1 2 3 4 5
[PS] This discussion is skirting the edges of comments policy by both sides. Would everyone please read the policy and stick to the science.
The main "substance" of RM's argument is that about water vapour. This myth is addressed in this article. Please read the article and comment there. Followups to RM on water vapour go there too.
RM - please state your arguments in a line scientific way and keep the rhetoric for the public bar. By this, I mean you need to start backing your assertion with references. Starting with "You don't understand the vapor pressure/temperature relationship at all." in the appropriate thread.
Ideally you quote and reference the science paper or IPCC statement you disagree with, why you disagree and provide data/references to back it. Start with why you think the science has it wrong on Clausius-Clapeyron.
#215:
"CO2 is the thermostat that sets where the concentration of water in the atmosphere is. Water follows the CO2."
Indeed!
Andrew Lacis et al did a model experiment where they removed all the greenhouse gases in the Earth’s atmosphere except for water vapour.
The end result was something close to snowball Earth conditions, with a global temperature dropping to about -20°C, far colder than any ice age has been since the late Precambrian. Most of this cooling was caused by feedbacks like increased albedo and the loss of 90% of the water vapour.
This figure from the paper shows how the temperature and other parameters changed during the experiment.
Renaissance Man,
The default setting on Excell is to fill the page with the graph and not show the zero. Why would it be the default setting if it were incorrect? Are you suggesting Microsoft programmers do not know how to make a graph? You are obviously not familiar with making graphs of data (I worked in industry for 20 years and had to send graphs to the USFDA. The FDA requires you fill the page with the data.) I used Denial Depot to make my point that your claim that the zero has to be included is incorrect. Dr. Inferno shows what that argument leads to.
If there were no CO2 in the atmosphere it would get colder. That would cause the water to rain out. Less water would make it even colder. In the end all the water would rain out and the Earth would freeze. The CO2 controls how much water evaporates into the atmsphere. The water is not independent of the CO2. Water concentration is controlled by the CO2 concentration.
At the top of the atmosphere, where the greenhouse effect causes it to get warmer, there is very little water vapor. It is too cold and the water rains out. CO2 does not rain out, it is stable as a gas at low temperatures. You need to regraph your data showing the CO2 and water concentrations at about 6km above the surface. You will find that the CO2 determines the amount of heating from the greenhouse effect.
This data is posted elsewhere on Skeptical Science. If you ask for new information I will help you look it up. When you make baseless claims it is not worth the effort.
I will not post again on this thread. Comments like these just gum up the board.
RM @214 objects to my aside about his name. For his information, I have the evidence of his posts on Skeptical Science of a massive incompetence when it comes to climate science that clearly disprove any claim he has to a broad competence across most fields of human intellectual and artistic endeavour, ie, to be a renaissance man. Of course, he can disprove my comment by naming any two academic fields to which he has made a significant contribution - with full citations of at least one peer reviewed paper in each. Or an academic field with citation to peer reviewed paper and refer his notable contribution to one of the arts - with evidence. The purported anonomous endorsement of a person of unknown competence is no evidence to his vaunting claim at all.
A case in point, as regards his incompetence in climate science is his claim @209 regarding the proper usage in scientific graphs, where he says that the Keeling Curve "... is blatantly dishonest ..." in part because "... it does not have a zero base". In fact scientific practise does not require the inclusion of the zero base as is easilly checked by looking at scientific websites such as the Laboratory of Atmospheric and Space Physics (LASP) at the University of Colorado, whose page on Total Solar Irradiance includes three graphs (the first of which is shown below), with lowest values on the y-axis of 1360.7, 1357, and 1360 W/m^2 respectively.
Or at scientific papers such as "Effects of freshwater and saltwater adaptation and dietary salt on fluid compartments, blood pressure, and venous capacitance in trout" which shows as figure 2, a graph with three parts, only one of which shows zero as the lowest value on the y-axis:
The reason for the practice of excluding the origin is simple. Graphs are intended to succintly display data. To do so they must be readable, and often including the origin will make that impossible by so compressing the display of the variation as to make it invisible. (Indeed, making the variation invisible is clearly RM in his second graph @209.)
So, not only is RM wrong about graphs - he is demonstrably wrong. Worse, he would be known to be wrong by anybody familiar with scientific literature (as opposed to the anti AGW pseudoscience sites that are obviously his main source of information). His compelling argument in favour of his view @217 that "No, you [ie, Michael Sweet] are mistaken" carries, in the end, no evidentiary weight.
[PS] Enough. Stick to the topic
RM @210, claims that "Degassification is a primary natural source of carbon dioxide. It leaves the ocean, rather than dissolving in it." That contrasts with the findings Sabine et al (2004) who find that:
This is one of a large number of similar studies with similar findings. Against these evidence based, peer reviewed studies, RM provides only the evidence of his own assertion (again).
[PS] The "CO2 is from the ocean" myth is debunked in this article.
RM - if you disagree with the evidence presented there, then present your evidence on that thread and not here.
HK @218:
#215:
"CO2 is the thermostat that sets where the concentration of water in the atmosphere is. Water follows the CO2."
Indeed!
Andrew Lacis et al did a model experiment where they removed all the greenhouse gases in the Earth’s atmosphere except for water vapour."
Response: Atmospheric CO2 is relatively constant worldwide, in very dramatic contrast to water vapor. This clearly refutes the "water follows CO2" claim.
The claim of a "model" which spans a fifty year time span must be suspect because past models have done so very poorly at prediction of temperature changes.
The great deserts of our planet are not dry because there is no CO2 present across them. Nor are the wettest parts of the planet located at high CO2 environments. Indeed!
[JH] Sloganeering snipped. Sloganeering is prohibited by the SkS Comments Policy.
Warning #1
Please note that posting comments here at SkS is a privilege, not a right. This privilege can be rescinded if the posting individual treats adherence to the Comments Policy as optional, rather than the mandatory condition of participating in this online forum.
Please take the time to review the policy and ensure future comments are in full compliance with it. Thanks for your understanding and compliance in this matter.
[PS]@217
"The numerous text books and guides on scientific graphing do not support your argument. Provide a reference which does. Inappropriate scales instead are the common tools of misinformation."
Reference follows:
Population Explosion
Lay public can easily be misled by graphs which appear to show rapid changes, which when subjected to more thoughtful, more professional analysis, are not rapid changes at all. For example, 1.36 parts per million increase in atmospheric carbon dioxide, over the last fifty years, is an extremely small annual change on the basis of 15,500 parts per million of total greenhouse gas.
[PS] The point of graphing is illustrate the data to maximum effect in the context. What is "insignificant" cannot be read from a graph - it can only be determined in larger context. A doubling of CO2 add nearly 4W/m2 to earth surface radiation and in climate terms that is significant. See myth "CO2 is insignificant trace gas". Please look at water vapour question at the link provided.
We have a large list of myths. See "arguments" on top left. Please read and be prepared to provide evidence in support of arguments before simply mindlessly repeating yet another one.
At moment, your discourse is sloganeering (repeating long debunked myths, assertions without backing), inflammatory tone, and frequently offtopic. Please pickup up your act.
"Atmospheric CO2 is relatively constant worldwide, in very dramatic contrast to water vapor. This clearly refutes the "water follows CO2" claim."
Why does the water vapour fluctuate so much while CO2 doesn't?
Because the local temperature sets an upper limit (but not a lower!) to how much water vapour the local atmosphere can hold.
CO2 and other forcings (including the Sun) control the global temperature and therefore the global amount of water vapour, which act as a strong climate feedback. The strong temperature dependency of water vapour also explains why its concentration drops so rapidly with altitude. If it didn't, but was a well-mixed gas like CO2, its warming impact would be so strong that the Earth would be inhabitable to all higher forms of life.
BTW, the atmosphere as a whole contains about 4000 ppm of water vapour, not 15,400 as figure 2 in your post #209 claims.
[PS] RM also fails to notice that most of the planet is covered by water.
Note: My post #224 was a response to #222.