


 Arguments


Recent Comments
1 2 3 4 5 6 7 8 9 10 11 12 13 14 15 16 Next
Comments 1 to 50:
-
One Planet Only Forever at 07:11 AM on 6 July 20262026 SkS Weekly Climate Change & Global Warming News Roundup #27
Thank you for continuing to compile and share this record of News Items.
As an Engineer with an MBA I developed an awareness of the importance of limiting how harmful a pursuit of benefit can be, and a related awareness of how competition for power, wealth, and other perceptions of superiority can encourage and excuse harmful unsustainable pursuits of benefit.
The following misleading claim-making presented in Climate Change Mitigation and Adaptation News Item 'But we're just 1% of emissions': do smaller countries' climate efforts matter? is indeed a problem.
“When our share of global emissions is less than 1%,” Rishi Sunak argued when he was the UK prime minister in 2023, “how can it be right that British citizens are now being told to sacrifice even more than others?”
But that type of misleading trouble-making is happening on more issues than the required corrections of harmful developments that Climate Science has exposed and improved the understanding of. And addressing misleading claims requires the issue to be appropriately framed.
The framing needs to along the lines of:
Why should a person try to be less harmful and more helpful than their peers or people perceived to be superior to them?
Shouldn't people aspire to be like those who are perceived to be superior?
I would go further than the re-framing of the issue that is done in the following quote from the article:
Climate scientists point to the much larger historical emissions of these countries – the metric that matters most for global heating – as well as the fact that these countries have more money to cut pollution. Per person, European countries have contributed a disproportionate amount to emissions, and progress in cleaning their economies is only now bringing annual emissions close to the global average.
The following later quote is in the direction of better re-framing, by focusing more on the harms that can be done by members of the wealthier and more powerful portion of a population.
“These leaders wouldn’t like it if the top 1% of their wealthiest citizens didn’t pay their taxes, so the argument is fallacious and simply buck-passing,” said Prof Piers Forster, a climate scientist at the University of Leeds. “Future warming is driven by future emissions, so every tonne of carbon dioxide that a country or citizen can avoid emitting will improve temperature and heatwave outcomes for generations.”
The following quote at the end of the article is an even better re-framing of the issue.
Dr Ella Gilbert, a climate scientist and ECIU board member, said: … “The UK may account for just 1% of current global emissions, but we’re responsible for 100% of our own emissions, and we have the opportunity to show global leadership by bringing them down.”
A logical extension of ‘why do I/we have to be less harmful when the harm done by my/our pursuit of personal benefit or enjoyment is small or others are more harmful and less helpful is: Why should I/we (all people) try to be less harmful and more helpful to Others?
Logically, and ethically and morally, the most harmful and least helpful portion of any population relative to their capacity to be helpful and harmful needs to be required to change the most, even if that change reduces perceptions of their superiority relative to Others.
The highest status needs to be given to the people who are ‘The least harmful and most helpful to Others relative to their ability to be helpful, their wealth and power’. It can be very harmful to ‘simply’ correlate wealth or power to ‘status’.
To maintain a perception of superiority, a wealthier and more powerful person should be required to be less harmful and more helpful than their wealth and power peers, and be significantly less harmful and more helpful to Others than people with less power and wealth.
A key is to frame the discussion to be about the most harmful individuals. Very harmful individuals can be expected to try to hide their harmfulness as part of a larger collective.
Another important framing is to recognize that the very harmful people in a diversity of regional populations can be expected to try to act collectively for ‘their benefit’ to the detriment of all Others, even if the regions they hide in appear to be in conflict.
-
rainyx at 11:11 AM on 30 June 2026Studying hurricanes at sea to save lives on shore
Hello, sorry, I was just talking about the roles drones have played after hurricanes that I know of.
Moderator Response:[BL] The "drones" in the OP are not aerial drones, so the similarity is small. If you follow the link under "Saildrones", you'll find a story that describes them (and the work that they do) in more detail. The description from that linked story:
To safely collect data from the Southern Ocean, a company called Saildrone developed a 23-foot-long, wind driven and solar powered uncrewed surface vehicle (USV) that can be controlled remotely.
-
rainyx at 20:25 PM on 29 June 2026Studying hurricanes at sea to save lives on shore
I prefer to use drones for post-disaster environmental reconstruction, road, housing, and personnel damage statistics.
Moderator Response:[BL] How is this relevant to the original post?
-
Philippe Chantreau at 08:24 AM on 28 June 2026Greenhouse effect has been falsified
I do realize that. I just got curious about the term "quenching", which I had not seen before, so I looked up the only real reference (sort of) that was in post 221 and found all this interesting stuff, that constitutes more bricks in the full understanding of the radiative behavior of the atmosphere, up to mesosphere and thermosphere.
-
MA Rodger at 17:15 PM on 27 June 2026Greenhouse effect has been falsified
Philippe Chantreau @225,
The work you cite concerns the mesosphere/thermosphere which are a long way up and far enough not to significantly impact surface climate. The stratosphere which is close enough to have an effect thro' the tropopause is also still giving up the details of its inner workings. Published just last month Cohen et al (2026) 'Stratospheric cooling and amplification of radiative forcing with rising carbon dioxide' was paywalled until a couple of days ago. (The pre-print version was a bit too dramatic with some of its language.) A cooling stratosphere warms the troposphere below as well as outer space. Cohen et al describe the detail of the interactions between rising CO2 and the H2O and O3 up there.
-
Philippe Chantreau at 09:43 AM on 27 June 2026Greenhouse effect has been falsified
Better referencing is needed on the Siddles, WIlson, and Simpson works that NOGHE4ME mentioned in post 221. I am assuming that would be their 1994 paper. There has been considerable work since then. Looking into this further, one finds Castle et al. (2012) still reporting significant discrepancies between theoretical and experimental values, as well as between lab and field observations. Most of these are resolved in Kutepov et al. 2025, whose expressed purpose was to improve, guess what? GCMs, of course. As we well know the GHE is not in question in GCMs, and neither is it in Siddles, Wilson & Simpson (1994), Castle et al. (2012) or Kutepov et al. (2025). The suggestion that any of these works somehow can be used to invalidate the very concept of atmospheric GH effect is utter nonsense. A cursory look at Kutepov et al. (2025) seems to suggest that there is nothing that new since Iacono & Clough (1995), besides further and further refinement and greater precision.
-
ubrew12 at 14:57 PM on 26 June 2026The Merchants of Doubt are coming for Extreme Event Attribution science
If someone doubts your attribution, ask for his attribution. If he doesn't have one, you have your answer about his qualification to doubt your attribution. This is because we have passed the point where the attribution is nothing at all, and everybody knows it. That is: we see that 'global warming' is real, and we also know what 'global' refers to. So, the remaining argument is over the exact value of the attribution, not whether there even is one. Someone without a peer-reviewed attribution should come up with one before he looks at your estimate and comments on how it should be improved. That's because these are all just estimates. Complaining about an estimate, without having one yourself that you are prepared to defend, is like complaining about a model airplane for falling short of the real thing (as if the word 'model' didn't already do that).
First, Exxon buried the fact that it had ever paid internally for a climate model. Second, Exxon complained that climate models don't work. It gets much harder to complain about estimates if you stupidly made one yourself, thus exposing yourself to the same spotlight you are attempting to blind the Science with. The purpose of doubt is to End with "I'm just asking questions. What do you have against asking questions?" It is, God forbid, not to provide answers. But that lack of answers is how these Doubt merchants can be identified.
-
Bob Loblaw at 10:33 AM on 26 June 2026Greenhouse effect has been falsified
NOGHE4ME:
If you are puzzled by MA Rodger's question about where the 15um IR radiation comes from, you may wish to look at the Intermediate tab of his web page, where you'll find graphs of measured IR radiation - one showing measurements looking down at 20km altitude, and one looking up from the surface.
Note that the graphs are using wave numbers. 15um corresponds to a wave number of 667.
-
Bob Loblaw at 10:16 AM on 26 June 2026Greenhouse effect has been falsified
NOGHE4ME:
In addition to MA Rodger's comment, I'll say the following.
You claim "The claim that the Earth's Surface emitts 340w m**2 has been disproved experitmentally.[sic]" Well, here is some experimental (read "real" or "measured") data that shows the earth's surface emitting considerably more than 340 W/m^2 - varying from about 375W/m^2 at the coolest time of day, increasing to over 450W/m^2 at the hottest part of the day for that location and date.
- Since this measurement shows that the surface is quite capable of emitting 340W/m^2 (and more..), how does your physics explain that measurement?
- If by "surface", you mean upward-directed IR radiation in the atmosphere at some distance above the surface, then please clarify. But in that image, also note that the downward-directed ("IRin") flux from the atmosphere back to the surface ranges from about 275W/m^2 to over 375W/m^2. So the atmosphere is also quite capable of emitting 340W/m^2.

As MA Rodger points out, your argument about CO2 losing energy to surrounding molecules skips over the part where CO2 also gains energy by collision with other molecules. That's why CO2 will be at the same temperature as other molecules: the higher-energy ones pass energy to lower-energy ones, passing energy back and forth, until things average out. You can read the details over at Eli Rabett's blog.
The simple fact is that CO2 will always emit some IR at 15um as long as it is at a temperature above 0K. To argue otherwise ignores more than a century of physics.
Your "version 1.0" is simply wrong. Your version 2.0 is also far too simplistic. There is a version 3.0 out there that you need to learn, that explains the role of CO2 in atmospheric radiation, and how it is involved in the greenhouse effect.
-
MA Rodger at 09:17 AM on 26 June 2026Greenhouse effect has been falsified
NOGHE4ME @221,
So let us indeed be "ignoring #1 for a moment." If CO2 is not re-emiting IR at 15mu, where is all the IR at 15mu measured within the atmosphere coming from?
It is true that the vast majority of such IR when absorbed by CO2 in the atmosphere results in IR-excited-CO2. That excitation is almost always neutralised by collision and the energy transferred to thermal in the atmosphere.
What you overlook is the vast number of CO2 molecules excited by collision. And in the same manner as the IR-excited-CO2, most of that collision-excited-CO2 will in turn be neutralised by collision. But because there are so many collisions and thus so many more collision-excited-CO2 than IR-excited-CO2, the number of them that do not get neutralised by collision but instead relax to emit 15mu IR. Effectively the rate of emission is the same as the rate of IR-excitation of CO2.
And it has to be this way or the laws of thermodynamics won't work.
Concerning your assertion that "These two pieces of evidence are more than sufficient to falsify the hypothesis," can you clarify what "these two pieces of evidence" comprise? Your comment is far from clear in this matter.
-
NOGHE4ME at 05:14 AM on 26 June 2026Greenhouse effect has been falsified
Has the Greenhouse Effect Hypothesis been falsified? I think the answer depends on which version of the Hypothesis you are speaking of. I think we can agree that the Earth's Atmosphere is an isulator that keeps the plant warm and supports life. There are at least two versions. The two versions differ largely on what is the predominent energy transport mode in the "lower" atmosphere. 1) Version 1.0 suggests the 'predominent' energy transport mode in the lower atmospher is conduction and convection (latent heat) and no contribution from IR or CO2. 2) Version 2.0 is IR and C02 predominently driven from the bottom to the top of the atmosphere. Version 1.0 is grounded in basic physics and needs little explanation. Version 2.0 has a least two fatal flaws. #1, The claim that the Earth's Surface emitts 340w m**2 has been disproved experitmentally. I would direct you to Tom Shula's YT video. https://www.youtube.com/watch?v=NS55lXf4LZk. #2) The hypothesis calls for CO2 to asbsorb AND emit IR. Ignoring #1 for a moment, C02 in the atmosphere, while capable of absorbing IR at 15mu, it does NOT re-emit IR as called for. The reason is that the CO2 molecule in the excited state loses it's energy to surrounding non-IR gases (N2 and O2) thru a process called thermalization. The quenching rates for C02 are well documented e.g. Siddles, WIlson, and Simpson. These two pieces of evidence are more than sufficient to falsify the hypothesis.
-
anderl at 03:22 AM on 26 June 2026What Americans can learn from London’s war on cars
When I compare London’s transport policy with that of my home town, I can’t help but feel envious. Brussels essentially consists of 19 boroughs, all of which operate in much the same way as an Outer London borough – that is to say, local politicians respond to public demand (or create it, in order to fuel their populism). The outlying boroughs are extremely poorly served by public transport, whilst in the city centre’s business districts there are so many private car parks that parking management fails to act as a regulatory tool. As in London, this is compounded by the division of society into a progressive wing on the one hand, and a structurally conservative public on the other, which is increasingly tending towards right-wing populism.
-
michael sweet at 07:46 AM on 24 June 2026Plateauing CO2 emissions have slowed atmospheric growth
MA Rodger,
It is interesting to hear the different land uses that compare to the solar needed to power the country. My favorite is still the area of corn grown to make ethanol for gasoline is enough to power the entire US economy. If we put only half of the solar on land unusable for farming and parking lots we would greatly benefit.
Where I live in Florida about 650 sq mi has been strip mined for phosphate. Some of that is converted to lakes but the remainder could generate a lot of energy.
We agree that land for renewable energy can be found. Hopefully the US will work harder on electrification in the future since the Iran war demonstrates that fossil energy is undependable. Over 90% of all electrification in the USA was renewable last year, it is the cheapest energy.
-
MA Rodger at 01:40 AM on 24 June 2026Plateauing CO2 emissions have slowed atmospheric growth
michael sweet @8,
Further to the 'Texas annecdote' @7, the value of 10,000 sq miles as the area of solar PV in Texas to provide all the primary energy used by USA is indeed low. Perhaps 20,000 sq miles would be a better value.A simplistic calculation would run as follows:-
The daily solar irradiance in Texas averages up to 6.6kWh/m^2 = 6.6e3Wh/m^2 = (x 1.6e3^2) 1.7e10Wh/sq mile.
Thus with a 20% PV efficiency, annual output would be (1.7e10 x 0.2 x 365 =) 1.23e12 Wh/sq mile = 1.23e16Wh/10,000 sq mile.
The annual US primary energy use is 2.6e16Wh.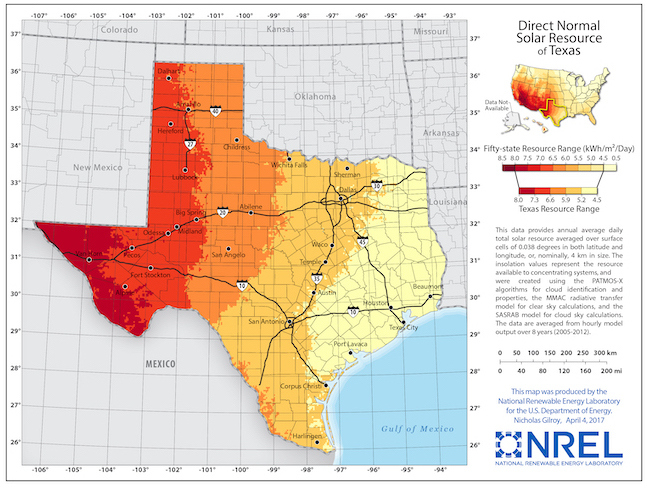
And this result is generally in agreement with this decade-old Fact Check of an Elon Musk statement which was shown correct. This was that 10,000sq km (or 4,000sq miles) of solar PV in Texas would produce the 425GW (= 3,725TWh) of electricity used annually in the US. The calculated output was 500GW (= 4,380TWh). That would equate to (4,380TWh x 2.59 =) 1.13e16Wh, The PV efficiency is put at 24% with the location the slightly-less-sunny NW Texas rather than W Texas.
The other half of the anecdote was the area of US that has been strip-mined for coal. The Ai function on Google offered up a reference that talks of a land area of 4 million hectaes (=10,000 sq miles) in the US that "open-pit mining of 124 billion tons of coal in the United States will destroy." [My Bold] Sadly this is derived from "data released by the National Research Council (NRC) of the United States" but the actual NRC document is not referenced. (The Google-offered reference concerns open-caste coal mining in Mongolia not the USA.)
However, this reference does give a measure of land 'destroyed' by open-caste coal mining. And data on good-old Wikki-thing shows perhaps 30 billions tons of open-caste-mined coal produced in the US since 1945. This suggests the land 'destroyed' by US open-caste coal mining is perhaps 2,500 sq mile.

Mind, there is another comparitor, The electricity that could be generated by that 10,000sq-mile-destroying mining, 124 billion tons would (generously) amount to [2e6Wh/ton x 1.24e11 ton =) 2.48e17Wh, enough to provide all US primary energy for 10 years. As well as the 10,000 sq mile of 'destroyed' land, this coal-use would double global CO2 emissions for that 10 years.
It's a shame the Solar PV required to provide the same annual energy output (and provide it for ever) would be twice the area. Perhaps in the future when the PV efficiencies are improved and if the calorific value of US coal continues to fall, those land areas will be more comparable. -
prove we are smart at 21:50 PM on 22 June 2026The Merchants of Doubt are coming for Extreme Event Attribution science
Best wishes from us all on your research into extreme event attribution science,maybe the courts can affect these money before morals elites.
Good luck to the remaining scientists and climate lawyers fighting their own administrations corporate and trillionaire/billionaire donors. It's not just Americans voting against their own interests, worldwide, we see time lost to start the deep emission cuts for climate stability. climateactiontracker.org/global/cat-thermometer/
These days,I think most in the world are "merchants of doubt" when it comes to believing the USA administration is about mitigating climate change or even if the USA is in fact a real democracy anymore..www.youtube.com/watch?v=GUHm6MfnPvw&t=534s
-
MA Rodger at 05:25 AM on 22 June 2026Plateauing CO2 emissions have slowed atmospheric growth
michael sweet @8,
Regarding the annecdote, I did mention that "I won't vouch for the numbers being right." Indeed, the numbers could all have been nonsense. In the past I recall attempting to find the area of open-cast coal mining in the US but never got anywhere. As for the 10,000 sq mile number I was actually told for this and thus the required area of solar PV to supply all primary energy for the US, that could well be wrong. 10,000 sq miles, 20,000, even 100,000 sq km (=40,000 sq miles) - all are possible but it was just an annecdote 20 years ago. Maybe I should do a bit of scaling of this requirement when I have a moment, something I likely have done previously but then forgotten the outcome.
The message I'd hope to give with the annecdote is that the area of unproductive land needed to power North America (in Texas), or Europe (in the Sahara), or China (in the Gobi) or India (in the Thar Desert) is entirely doable.
-
wilddouglascounty at 05:06 AM on 22 June 2026Cooking up the Climate Stripes, with Ed Hawkins
Thanks for sharing the story! It's such a great tool for helping anyone "get it." Some requests from someone who works with aging populations, folks with disabilities and other sensory processing differences:
-I think it would be a great exercise to make a "climate stick" that uses tactile cues to make the same point. The stick would start quite smooth on one end, and get progressively rougher as the climate warms. Perhaps the climate spiral would also translate into a stick by stretching it into an increasingly thick stick as the climate spiral gets wider and wider.
-For those with severe visual limitations, in addition to a climate stick, perhaps an auditory version by playing with the volume, amplitude and tonal qualities of the global climate representation? It would be interesting to give this task to some musicians to see how compelling and listenable they could make it, because it would be easy to make it increasingly grating, but a challenge to make it all listenable all the way to the present...
-other modalities: how about a room where you could sit in a chair and feel increasingly warm wind blown at you? Or increasingly bright lights? Or increasingly loud tone? Or heavier and heavier rate of raindrops? So many creative directions that this could go...
-
michael sweet at 03:25 AM on 21 June 2026Plateauing CO2 emissions have slowed atmospheric growth
MA Rodger:
I do not know the source of your story about Texas. The entire area of Texas is about 269,000 sq mi (according to Wikipedia). So 10,000 sq mi for all energy is not too much. A detailed post on Quora concluded that 10,000 sq mi would generate about the current electriicty use in the USA.
I have recently seen it posted on line that if we covered with solar only the square miles currently used to grow corn for alcohol used in gasoline we could generate all the energy (everything industry, transportation heating/AC etc) used in the USA. (AI claims there would be excess energy from this conversion but I do not trust AI any more than internet posters).
I have seen scientific posts that suggested we use desert land, roof tops and parking lots to generate the needed solar power and rewild the 35 million acres of corn-for-ethanol (about 55,000 sq mi). I doubt American farmers would like that but it is an interesting claim. Recent estimates of the needed energy to provide All Energy in the USA would be consistent with that plan if you got anywhere near all electricity from 10,000 sq mi.
I recently drove across Texas, New Mexico and Arizona and the amount of land that is not really usefull for agriculture is enormous. Not to mention brownfields from coal mining and oil extraction.
As you mention, the issue is political will and not the amount of land and other materials needed. Hopefully the overbuilt Chinese solar panel factories can be put to good use.
-
MA Rodger at 18:39 PM on 20 June 2026Plateauing CO2 emissions have slowed atmospheric growth
johnpead @6,
I can't accept that CO2 emissions are 'falling'. They are barely staying flat, and that due to reductions in emissions from Land-Use-Change.
To put some numbers on that from the GCP 'budget':-
Average Annual Global CO2 Emission increases... ... ... ... ... Fossil Fuel ... ... [LUC emissions]
1990-2000 .... +82Mt(C) ... ... [+4Mt(C)]
2001-2012 ... +215Mt(C) ... .. [+12Mt(C)]
2013-2024 .... +83Mt(C) ... ... [-48Mt(C)]But to address your question, the additional annual atmospheric CO2 burden is often called the "Airborne Fraction" which very roughly sits a 50% of annual emissions. But this fraction is not a single year thing. The draw-down of our emissions into ocean & biosphere is a multi-year thing. Thus that 50% comprises illustratively 3.00% of year one, 2.90% of year two, 2.75% of year three, etc, this draw-down completed over a millenium when about 75% (or less for high levels of emissions) in total will have been drawn out of the atmosphere. The final tiny-tiny component is absorbed when the last bit of deep ocean water eventually surfaces and absorbs its CO2. The remaining 25% requires geological processes or a helping human hand.
So if emissions level-off, the Keeling Curve will stop bending upwards, accelerating. Identifying that disappeared acceleration amongst the wobbles will take a decade or two. If there were a drop to 50% of our emissions, the Keeling Curve will plateau a while, and if emissions continue to fall below that 50%, the Keeling Curve will dip.
That doesn't sound very encouraging. That is not to say the problem is unnsoilvable. My own view of it is that solar PV is the solution along with its use for hydrogen/ammonia/methane production.
I recall an anecdote from a couple of decades ago. A clever environmentalist tells a dumb climate skeptic that the USA could get all its energy requirements (so all primary energy) from 10,000 sq miles of solar farms in Texas. The skeptic replies that 10,000 sq miles is a massive area - the task is far too great to be delivered. The environmentalist responds that 10,000 sq miles is massive but it is the area of forest/mountain strip-mined for coal in the USA, a far-harder task which didn't prove too great, and that all this mined coal is now burned and gone. With coal you have to keep mining. The solar PV will keep on delivering.
(I won't vouch for the numbers being right.)So there is a solution to hand (and likely other scaleable technologies as well) and if it (they) were embraced as strongly as then-there tech-bro AI projects (and money-wise it has a far far stronger basis for investment) we could deliver that solution.
What is depressing is the evident denial within the political sphere that we are still not doing anything like enough to reach net-zero (& the net-negative that must follow). The graphic below shows the scale of the problem.
In terms of the warming, things are more encouraging. The delay in warming and the delay in draw-down sort-of cancel each other out. Modelling shows that, very roughly, net-zero also brings zero-warming. The draw-down of CO2 drops the climate forcing providing cooling. And that sort-of matches the delayed in-the-pipeline warming. (The detail of this 'matching' isn't entirely forthcoming. CH4 & N2O have shorter atmospheric residency and are substantial contributors to AGW [respectively 25% & 10% of CO2's forcing] and are surely significant in those 'matching' result.)
-
johnpead at 14:55 PM on 20 June 2026Plateauing CO2 emissions have slowed atmospheric growth
MA Rodger. Many thanks for such impressive responses to my two questions. I so enjoyed reading your thoughtful and respectful conversations about whether atmospheric carbon is not just increasing, but may be accelerating too. Especially appreciate your patience and humility in responding to me and others.
Supplementary question. If global carbon emmissions are presently not rising, but starting to fall, when and how will we see that reflected in the keeling curve and then subsequent effects on global warming. What are your hunches? Presumably, the present rate of increase of atmospheric carbon will first start declining (over say 10years)? Then effects on global warming will only commence much much later, after actual atmospheric carbon starts declining (over say 100-1000 years)?
-
nigelj at 07:56 AM on 20 June 2026Plateauing CO2 emissions have slowed atmospheric growth
johnpead @1
You ask - "How confident can we be about estimated annual emmissions?"
I was discussing this somewhere else, and include the following studies I found which indicate we can be reasonably sure about the accuracy of estimated emissions and emissions reported by individual countries:
1) Emanuele Solazzo, Robbie M. Andrew, and Greet Janssens-Maenhout. Annual estimates of global and national CO2 emissions from fossil fuels: tracking revisions to the United Nations energy statistics database input energy data. Environmental Data Science (Cambridge University Press). June 2022
2) Brendan Byrne, David F. Baker, Sourish Basu, et alia. National CO2 budgets (2015–2020) inferred from atmospheric CO2 observations in support of the global stocktake. Earth System Science Data (ESSD). March 2023
3) Christopher W. O’Dell, David Crisp, David F. Baker, et al. The Orbiting Carbon Observatory-3 (OCO-3) mission: Early science results from space-based observations of localized CO2 emissions. Remote Sensing of Environment. December 2022
-
MA Rodger at 14:42 PM on 19 June 2026Plateauing CO2 emissions have slowed atmospheric growth
johnpead @1,
You ask - "How confident can we be about estimated annual emmissions?"
The number cited by the OP come from the 'budgets' of the Global Carbon Project (GCP) who evaluate not just the various anthropogenic CO2 emissions but also the ocean & biosphere uptake of CO2. Perhaps as a gauge of the accuracy of their 'budget' numbers, they provide an annual "budget imbalance" which is where the total emissions do not equal the total for uptakes plus atmospheric increase. This annual "budget imbalance" is usually 2% or 3% of the total emissions and this is on average due to more emissions than uptakes/increase.
So I would suggest the estimates annual emissions numbers are accurate enough to be confident that they don't hide some dreadful mis-reporting.
You also ask - "Why are atmospheric carbon levels still accelerating in growth?"
On a different thread here at SkS, I very recently engaged in a to-&-fro as to whether there is "still acceleration." With all the wobbles in the data, it appears difficult to demonstrate either way. -
Bob Loblaw at 00:21 AM on 19 June 2026Plateauing CO2 emissions have slowed atmospheric growth
Johnpead:
When speaking of emissions of CO2 or other carbon gases such as CH4, you need to clarify whether you are asking about anthropogenic emissions or natural emissions. Anthropogenic emissions related to burning fossil fuels are most easily estimated using production numbers for gas, coal, etc. In general, if we pulled it out of the ground, it got burned. (Oil is also used to produce plastics, but we do track how much is used to produce fuel.) As Eclectic says, it's pretty straightforward arithmetic.
Natural emissions are more complex. But you also need to consider natural uptake/absorption, as the contribution to changes in atmospheric CO2 is the result of the net value of emission minus uptake. You can cause an increase in atmospheric CO2 by reducing uptake, not just by increasing emissions.
Estimating natural emissions or uptake is less certain than anthropogenic emissions. There are two ways to try to measure it directly:
- Global point measurements of uptake and emissions. integrate the values over the entire globe. Not easy, and not really possible to get a network of sites that do this with sufficient coverage, running continuously.
- Global measurements of carbon storage. Changes in storage are the result of changes in the net flux (emissions minus storage). That can't tell you whether it is an emissions increase, an uptake decrease, or a combination of the two, but it will tell you the effect on atmospheric concentrations. Same issues in developing a global observing network as in point 1.
What we are left with is point measurements of uptake, emissions, and storage, which we can use to develop global carbon cycle models that allow for global estimates. For short-term events such as forest fires, such models can use estimates of the forest carbon and fire behaviour to estimate the emitted CO2.
There are several blog posts here at SkS that discuss many of these aspects of the global carbon cycle. Here are a few. (Note that some of these have both a "Basic" and an "Intermediate" tab, with different levels of detail.)
What is causing the increase in atmospheric CO2?
The lines of evidence that humans are raising CO2 levels
How do human CO2 emissions compare to natural CO2 emissions?
Murry Salby's Correlation Conundrum
-
Eclectic at 21:51 PM on 18 June 2026Plateauing CO2 emissions have slowed atmospheric growth
Johnpead @1 :
Please clarify the thinking behind your questions about rising CO2.
The basic arithmetic is straightforward ~ a world economy is expanding gradually year by year, and the energy supplied for that is still around roughly 83% supplied by fossil fuels. Obviously we (collectively) need to try harder with the "renewables" energy supply.
Also, more technological advance (e.g. the new sodium batteries) will take years to come to fruition. And there is much political foot-dragging going on in Washington and elsewhere.
Bushfires/wildfires are largely part of the short-term natural cycle.
My guess is that the wars/conflicts you mention are minuscule in CO2 production, compared with the usual industrial & domestic CO2.
-
johnpead at 11:45 AM on 18 June 2026Plateauing CO2 emissions have slowed atmospheric growth
Terrific article and analyses Zeke about the relationship between emmissions and atmospheric carbon. Just a couple of layperson questions. First, we are confident in the data on atmospheric carbon, validated across multiple sites, however how confident can we be about estimated annual emmissions? How are emmissions from global conflicts included, such as from Ukraine, Gaza, Iran or for example from the increasing frquency of large scale bushfires? Second, the analysis you describe suggests we are turning the corner on emmissions and atmospheric carbon is yet to catch up, so why are atmospheric carbon levels still accelerating in growth? I would have thought that while still increasing, acceleration should be reducing at least? Thanks you for your good efforts Zeke
-
Doug Bostrom at 10:26 AM on 11 June 2026SkS Housekeeping: Updating the Comments Policy
Thank you for your kind sentiment and continued support, Jonas.
Some of us probably imagined we might have retired from this work by now. Nope!
As energy modernization (and decarbonization) occupies proportionately more area beneath the graph of consumption, we're bound to experience new urgency and deal with fresh, innovative methods from the industry sector most threatened by this change (even as there's still a steady drumbeat of stale climate myths). Urgency of oppostion is a proxy metric for success.We'll have to be here for a while, looks like. :-)
-
jlsoaz at 07:03 AM on 11 June 2026It's not bad
I can't seem to edit my post, but actually I'm not sure who the guest author was who posted this, but thanks to them for doing it.
-
jlsoaz at 07:02 AM on 11 June 2026It's not bad
Folks,
For those that may not have seen it, this research was published recently, and the author seems to have made a point of seeing to it that it showed up directly on skepticalscience.com
https://skepticalscience.com/how-many-people-does-heat-kill.html
How many people does heat actually kill?
Posted on 9 June 2026 by Guest AuthorThis is a re-post from The Climate Brink by Andrew Dessler
You have likely seen a headline like this: 62,000 people died from record-breaking heat in Europe:
which leads to here from a couple of months ago:
https://www.theclimatebrink.com/p/how-many-people-does-heat-actually
How many people does heat actually kill?
It depends on how you count it
Andrew Dessler
Apr 13, 2026which leads to here from a couple of months prior to that:
https://agupubs.onlinelibrary.wiley.com/doi/10.1029/2025GH001537
The True Cost of Heat: Evaluating Heat-Related Mortality Estimation Methods in Texas
Jesse R. J. Rutt, Andrew E. Dessler
First published: 11 February 2026
https://doi.org/10.1029/2025GH001537Digital Object Identifier (DOI)
Accessibility issue? Request accessibility update.Anyway, it looks like useful research in this area, and I think can help laymen such as myself, along with scientists, have more uniform and intelligible metrics to understand what is happening, and talk it over with our representatives where appropriate to see if they can understand how deadly this whole climate change crisis is.
-
jlsoaz at 06:51 AM on 11 June 2026How many people does heat actually kill?
Thank you for doing this research and additionally for making sure the skeptical science website has it noted. I have long thought and argued that it is a good idea if we can bring as much attention as possible to credible estimates of the net numbers of people whose lives have been harmed or ended by human-caused climate change.
When I have tried to sift through the peer-reviewed literature to try to make sense of what is out there (as a non-scientist, but as someone who can at least take a reasonable shot at understanding some of what is out there), I have found it intimidating to try to understand. As someone here on skepticalscience.com pointed out, to publish epidemiological research in this area, and adhere to credible methods, can be difficult in a somewhat similar way to how it was difficult for a solid body of work from various scientists was somewhat challenging to build up when the questions were around how to assess the dangers of smoking and how many deaths could be attributed to it. Likewise, we now seem to be going through a period where there are increasing numbers of peer-reviewed articles that come out that help us understand the best efforts of scientists to understand how much mortality is attributable to the different impacts of climate change.
I like your point about the different methods. The excess death method is the one that makes sense to me here for the purposes that I see.
For those seeking to take additional action, I think there are two worthwhile projects, where the door is open for capable people to do them:
- publish a full blown myth and science rebuttal article here on skepticalscience.com, with respect to the myth that “very few if any people are being killed or hurt” by human-caused climate change. As best I can tell, the closest this site comes to this is the top-level myth “it’s not bad”. There is a little bit of good rebuttal in that myth writeup, but I think this myth deserves its own full break-out and discussion and examination.
- publish a permanent web page for the world to see with a credible range estimate of the deaths that human-caused climate change has caused, is causing per year and per day, and will cause in the future.
-
Jonas at 22:14 PM on 7 June 2026SkS Housekeeping: Updating the Comments Policy
I want to pick the opportunity and thank the SkS team for the work it does again. I currently do not often have the time to read comments, but when I did, they often were an additional angle or extension of the topic. I support making moderation work less cranky.
Unfortunately, your work as a whole is still and even more neeed, so I continue donating. The last phrase was on topic in the sense that you need a platform with comments in order to be able to moderate them. -
prove we are smart at 17:50 PM on 2 June 2026Solar, wind, and EVs have knocked out a doomsday climate scenario
Well, that is a welcome headline, so, the CO2 emissions released by us in the 20th century and continuing this 21st century isn't going to doom us.
Because of rapidly increasing renewables, ev's and a slow down in fossil fuel use, there is now a new Business As Usual scenario, but still a very dangerous course to follow.
This new path we are on-( imho )-is a medium emission scenario, ( the new BAU ).
????️ "1. What “new business as usual” actually means
The phrase has shifted over the last decade. Historically, BAU meant something like RCP8.5 — runaway fossil‑fuel expansion. Today, because renewables have grown and coal is declining, BAU is more like:Emissions plateauing or declining slowly, not rapidly
Warming continuing toward ~2.3–2.7 °C by 2100
Carbon budgets for 1.5 °C exhausted within a few years
Planetary boundaries for climate, biosphere integrity, freshwater, and novel entities pushed further into the danger zone
In other words: not worst‑case, but still deeply unsafe.
A BAU world doesn’t just “get warmer.”
It pushes multiple planetary boundaries further into the red, increasing the probability of tipping cascades:AMOC slowdown
Amazon dieback
West Antarctic Ice Sheet collapse
Permafrost thaw
Coral reef collapse
Monsoon destabilisation
Once tipping elements begin to interact, the climate system becomes non‑linear — meaning human control diminishes.
This is the real risk of BAU:
we lose the ability to steer the Earth system back into a stable state.???? 5. What it means for “us”
For humanity, BAU means:A more dangerous, less predictable climate
Shrinking safe zones for agriculture and habitation
Higher economic volatility
Greater geopolitical tension
Increasing pressure on democratic institutions
A world where adaptation becomes permanent, expensive, and unevenly distributed
For the biosphere, it means:
Reduced resilience
Accelerated extinction
Loss of ecosystem services that civilisation depends on
A shift toward a hotter, less biodiverse, less stable Earth".
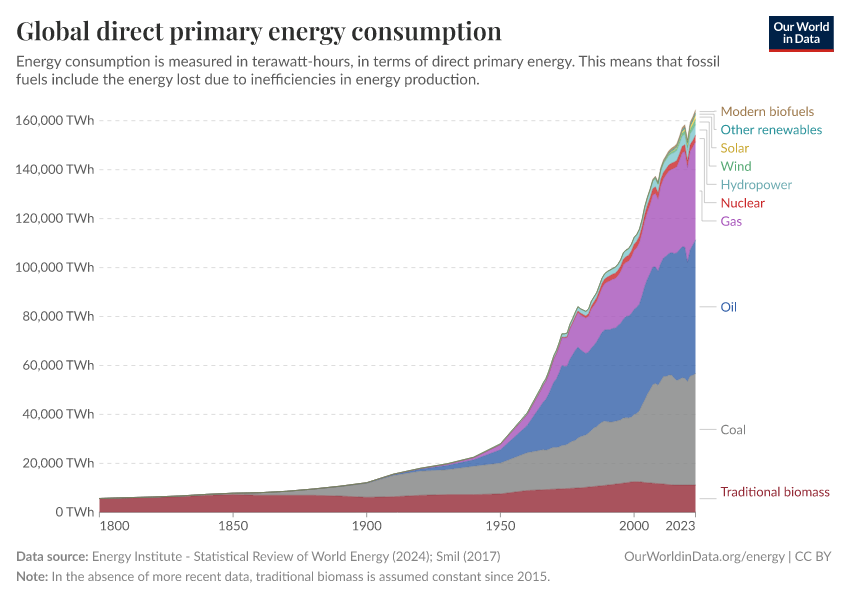
"Approximately one-seventh of the world's primary energy is now sourced from renewable technologies. This is based on renewable energy's share in the energy mix. Energy consumption represents the sum of electricity, transport, and heating". Here is the link to that-we desperately need to move past that 15% , even if it hurts our GDP's now instead of a warming world forcing a lowering of GDP on us later. ourworldindata.org/renewable-energy
-
MA Rodger at 09:37 AM on 1 June 2026On the death of RCP8.5
Mel Reasoner @1,
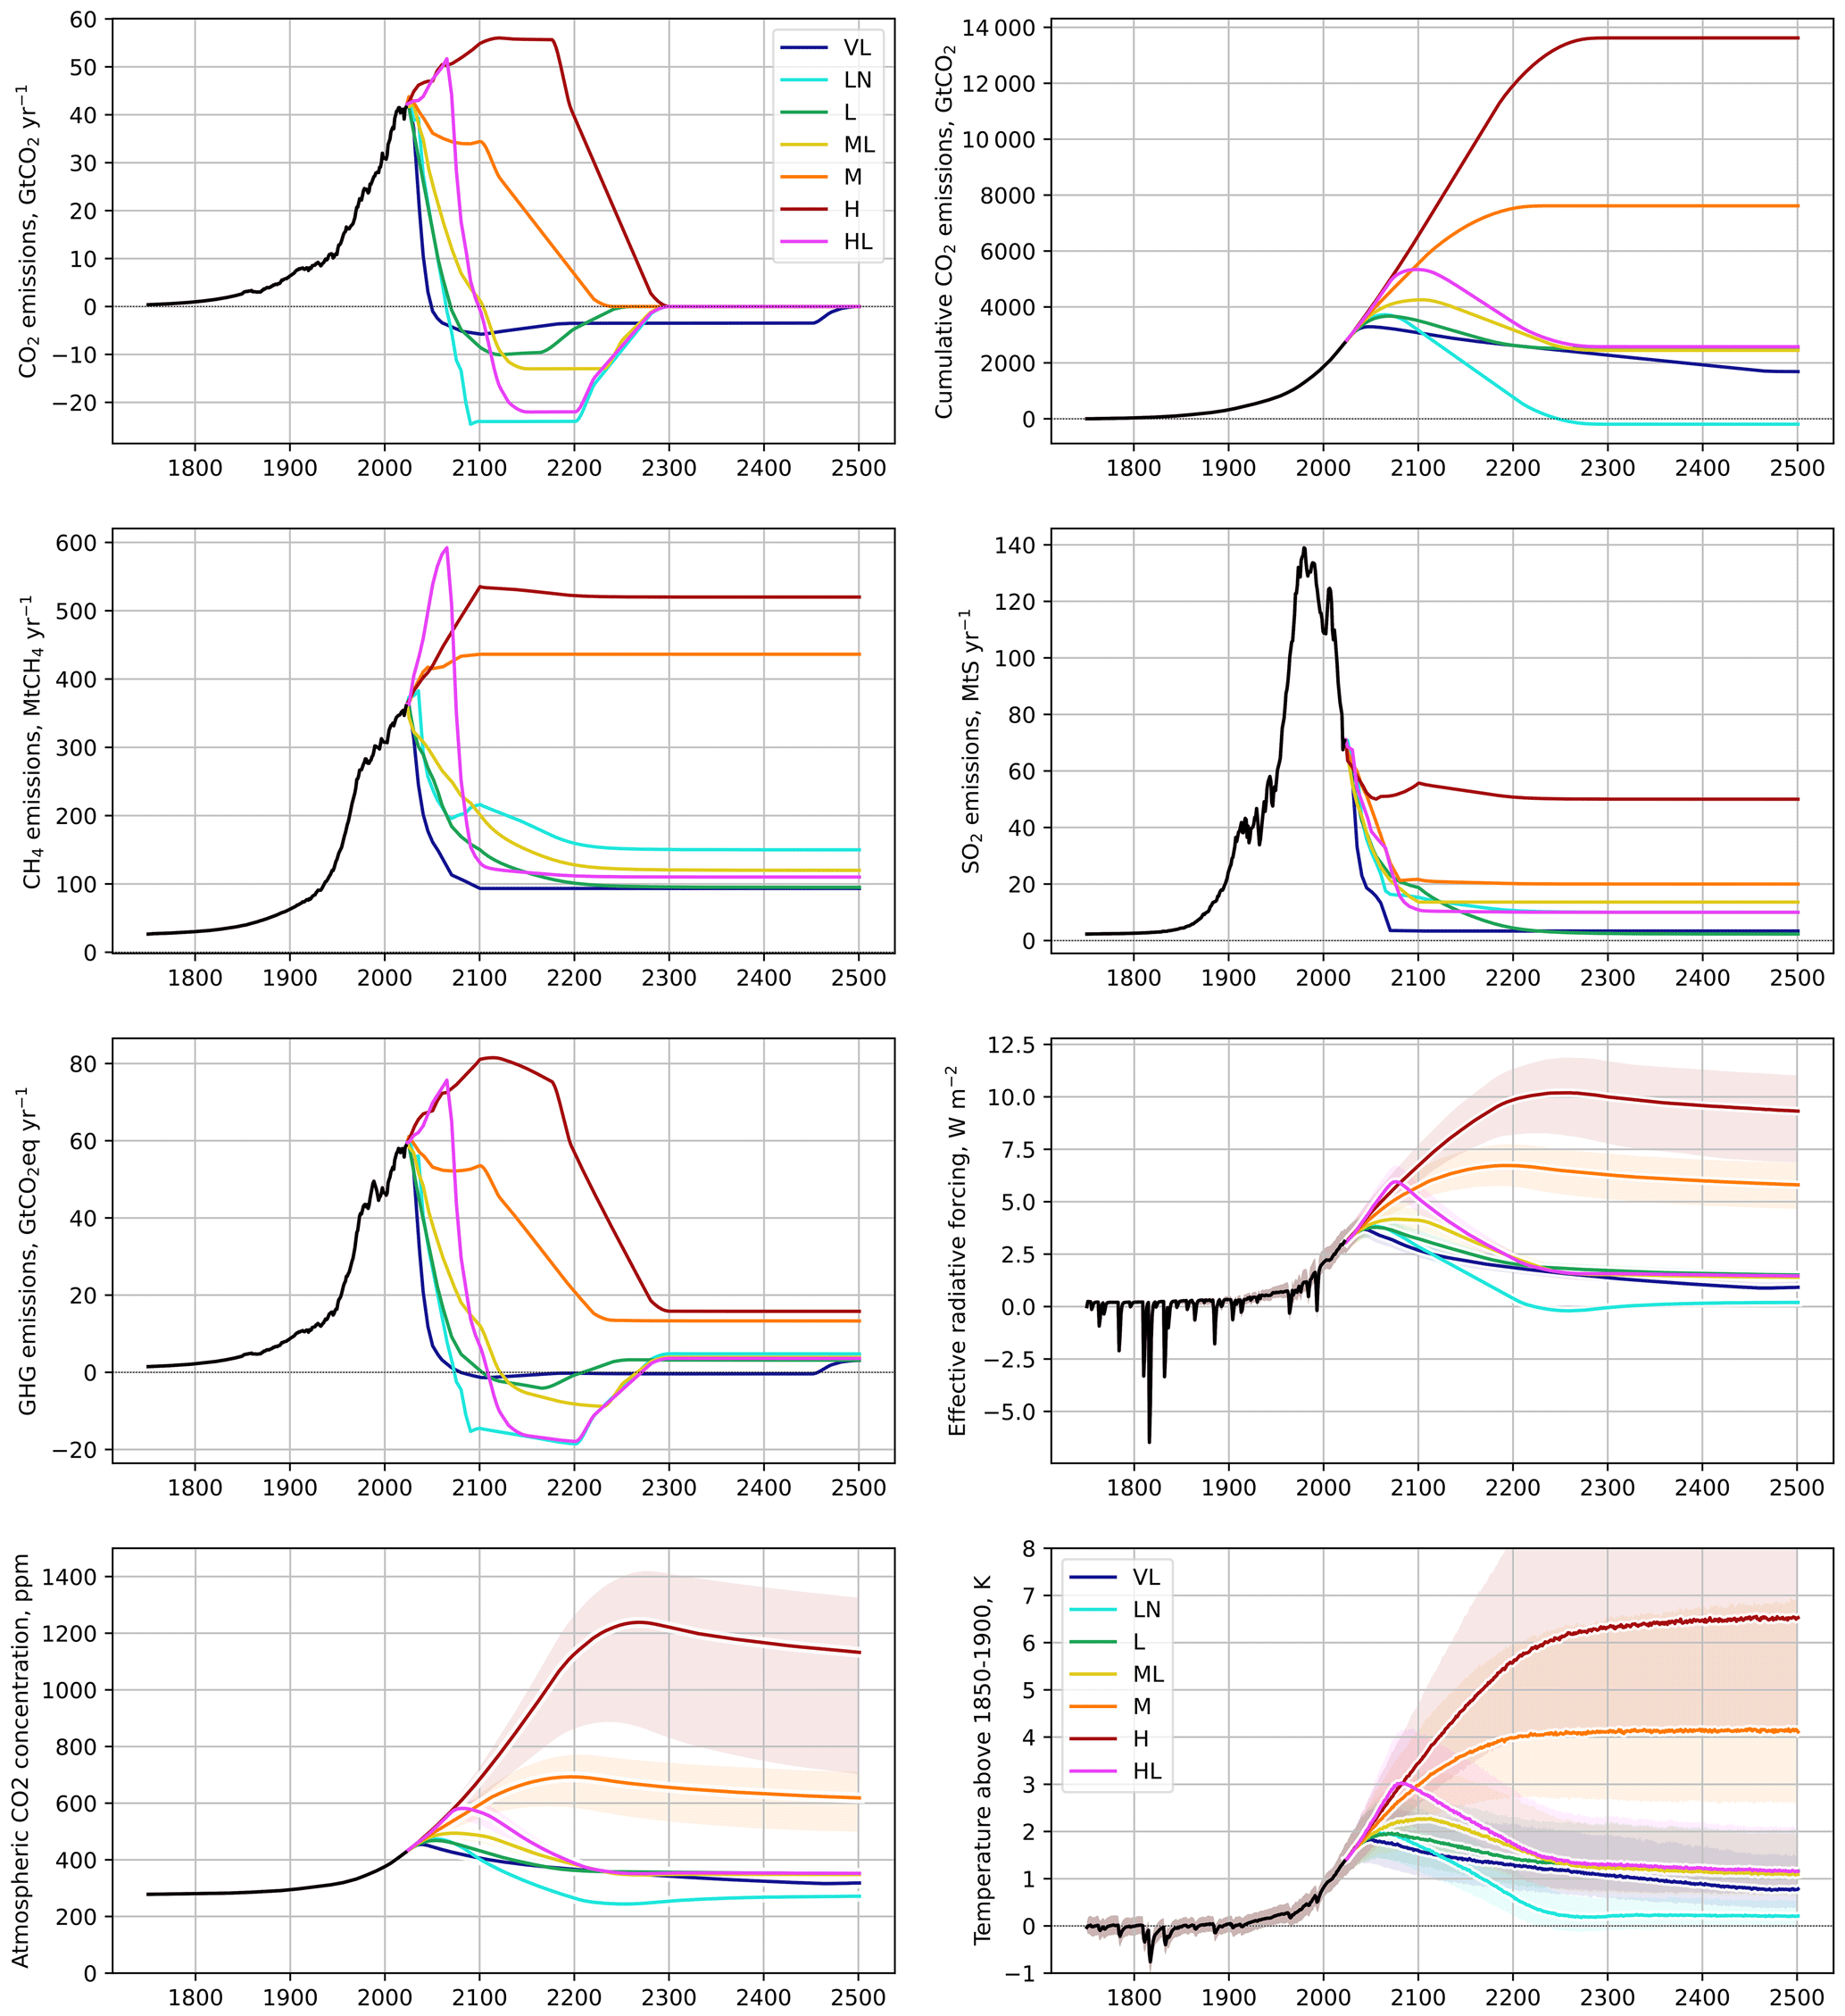
The graphic in the OP does call itself "Illustrative" so it's not trying to pre-empt the actual CMIP7 modelling.
Other than the Forcing inputs (which are so-far yet to be finalised while expected to be "roughly consistent" with those shown), there is a whole lot of other assumptions that could have been input into the 841 FaIR model runs. Van Vuuren et al (2026) present the two-panel graphic in the OP showing "illustrative" temperature outputs and that is putting CMIP7-M for 2100 at +2.7ºC to +3.3ºC. The CMIP7-M is supposed to represent "the current policy situation (as of 2025) and trends continuing over the century" but that is open to some considerable interpretation with 'delivery' often deviating from 'policy' in short order.The graphic below is Fig 2 from Van Vuuren et al (2026). Note the bottom right panel is showing temperature with "shaded regions show the 5–95 percentile range" and the CMIP7-M range at 2100 is something like +2.2ºC to +4.2ºC.
As for the recent rate of AGW, it is certainly no longer running along at the same old +0.18ºC/decade which is where we were up to 2015. The +0.27ºC you quote for the last decade is probably lower than I would calculate. But there are quite a few reasons to expect the longer-term warming under a slightly slower Forcing increase to be significantly slower than this last decade. Conversely, some reasoning says otherwise. -
Mel Reasoner at 04:12 AM on 1 June 2026On the death of RCP8.5
The van Vuuren et al. (2026) “Medium” scenario assumes current climate policies are frozen in place and results in approximately 2.8°C warming above 1850–1900 by 2100.
However, observed human-caused warming over the last decade has been about 0.27°C per decade (Forster et al., 2025), which, if continued linearly, would imply substantially higher warming by 2100 (~3.4°C). At the same time, atmospheric CO₂ concentrations, atmospheric CH₄ concentrations, and Planetary Heat Uptake (CERES) all continue to increase at increasing rates, and a recent paper suggest that global temperature itself may be accelerating (Foster and Rahmstorf, 2026).
My question is: what physical mechanism within a “current policies frozen in place” world causes the warming rate to slow sufficiently to be limited to only ~2.8°C by 2100? -
nigelj at 06:35 AM on 30 May 2026A look back at ‘An Inconvenient Truth,’ 20 years later
MAR @ 39, a lot of the details of OLS and linear regression calcs is above my level of training, however having read your latest explanation, I follow your general mathematical reasoning quite OK. I can see the 2015 nino doesn't really explain such a long lasting slowdown in the acceleration, yet the idea of one or more other natural wobbles adding to the el nino to explain the slowdown does seem very unlikely. It would be one hell of a coincidence.
I do know plotting things like rates of acceleration, first derivatives, second derivatives, that sort of thing can be notoriously deceptive and make it easy to fool yourself, but I can see you have well compensated for that in your technique. So you might be right that theres an acceleration free period after 2015 to presently, and this because annual emissions have flattened off. Its what we would expect to see, but its also possibly explained by a one in a million coincidence of natural factors that could happen over what is a relatively short time period I suppose.
I suggest ask an AI to review the data and your analysis. This is exactly the sort of thing AI is good at. The AI could also potentially evaluate the impacts of all the el ninos and search for other things that may have had a carbon sink effect after 2015 as well as the opposite. You just have to feed the AI absolutely everything you have and spoon feed it very carefully.
-
MA Rodger at 17:33 PM on 29 May 2026A look back at ‘An Inconvenient Truth,’ 20 years later
nigelj @36,
The 26th May 'white' graph titled 'Average 12-Month Increases in CO2' indeed does indicate "an obvious slow down after 2015" in the "rates of yearly acceleration of CO2."
You ask whether this slowdiwn is "just generated by the 2015 el nino."I don't see this could be solely a 2015 El Niño 'thing'. It conceivably could be a 'thing' involving the 2015 El Niño along with the impacts of other wobble-inducing events.
The 26th May 'white' graph is plotting OLS slopes and these are mostly impacted by what is going on at the ends of the OLS periods. There OLS periods are short so having an up-wobble at one end of an OLS period and a down-wobble at the other will result in the OLS for that period shooting away from what would be the underlying trend of a rolling OLS series. (And the same is true for non-linear regression types over short periods.)
Because the short-period individual OLS series in the 26th May 'white' graph are so sensitive (and also in the lower trace of the graphic posted 20th May - another 'white' one**), the 26th May 'white' graph uses varying lengths of OLS in an attempt to sldestep such OLS wobble 'things'. In the 26th May 'white' graph, it is possible the averages of different-lengthed OLS is still even-then showing nothing but a coincidence of wobbles but that would appear to be an improbable event. (** The 20th May 'white' graph used decreasing lengthes OLS hoping to show something before the wobbles took over. And these is is something to see.)
So I propose that what the 26th May 'white' graph (and the 20th May one) is picking up is the remarkably constant CO2 increase (thus an acceleration-free peroid) thro' 2015-to-date. This linearity can be seen directly plotted in yet another 'white' graph posted 22nd May.
So then, the question has to be 'Why does 2015-to-date have a constant rate of CO2 increase?'
It would require more than the 2016 El Niño but, combined with the following El Niños of 2020 & 2024, it could potentially manage it if their various wobble sizes-&-timings obliged.
However, my contention here*** is that linearity results from the annual man-made CO2 emissions having flattened-off. (The emissions data are ploted in the 'blue' graph 20th May.) With a year-or-so for the southern hemisphere to catch up, emissions data do fit the 2015-to-date linearity.
( *** I feel I am on solid ground with this contension. Though I am not well versed in the derivation of the numbers involved in the carbon cycle, an Airborne Fraction calculated from the Global Carbon Budget people has been pretty static of late, thro' 2000-24 at 51% [+/-1.7% 2sd]. Thus a change in carbon uptake by the oceans & biosphere & cement appears unlikely.) -
Evan at 00:12 AM on 29 May 2026A look back at ‘An Inconvenient Truth,’ 20 years later
Bob@37 Thanks for weighing in. Yes, I understand that the x2 coefficient represents half the acceleration. Because MAR was questioning the quadratic, I fitted using a powerlaw and took the second derivative of that. I checked my numbers and they are about half what they should be, but I don't know why. On the other hand, the accelerations from the quadratic are about right. Here they are
- Acceleration fitting 2000-2015 data: 0.015 ppm/yr/yr
- Acceleration fitting 2005-2020 data: 0.063 ppm/yr/yr
- Acceleration fitting 2010-2025 data: 0.029 ppm/yr/yr
Taking some kind of average and applying it over the 2000-2025 time span in question, gives us about the right increase. MAR would say that the acceleration is decreasing and reaching a plateau. But the methods he uses to justify a plateau are difficult to follow. Not saying their wrong, just difficult to follow.
My goal is clear communication that is accepted by experts and novices, and which can be understood by novices. Apparently I am not achieving my goals as evidenced by the back and forth between MAR and myself.
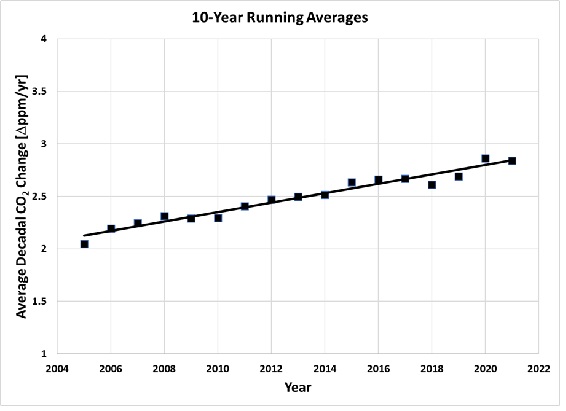
I may simply adjust my discussion to emphasize the 10-year running average rates of increase, as shown here. The method is easy to describe and I don't think challenged by anyone. Whatever it does or does not show about the underlying accelerations, it clearly shows we are far too rapidly going in the wrong direction. I really wonder how many people appreciate what an annual increase of CO2 of 2.5 ppm/yr represents?

-
Bob Loblaw at 23:52 PM on 28 May 2026A look back at ‘An Inconvenient Truth,’ 20 years later
Evan et al:
I have not been following this discussion in detail, but IIRC when using a quadratic equation/second-order polynomial, the x2 coefficient represents half the acceleration. If you (Evan) are just quoting the coefficient from the curve fitting, then that would explain why you are out by a factor of two.
-
nigelj at 09:33 AM on 28 May 2026A look back at ‘An Inconvenient Truth,’ 20 years later
MAR @34, I normally find your comments fairly clear, and extremely hard to fault, but I'm having trouble with your comments on this acceleration of CO2 issue. Regarding the graph you posted at 26th of May showing the rates of yearly acceleration of CO2. There is an obvious slow down after 2015 but isn't this just generated by the 2015 el nino? So its an artifact and temporary thing and is not indicating anything very comforting. I cant see what else it would be, because theres no sign of a slowdown in the keeling curve itself. However I dont have your level of training in maths and physics so I suppose I'm probably missing something.
-
Evan at 09:32 AM on 28 May 2026A look back at ‘An Inconvenient Truth,’ 20 years later
MA Roder@34, yes I agree with you that my accelerations are low by about a factor of 2. Let me get back in the game and see if I can find the inconsistency. The problem I have with your analysis is that I cannot get an intuitive feel for what you are doing. My method is to fit a well-behaved function to a statistically meaningful span of data and then analyze the derivatives. That seems like the logical, consistent approach.
Somewhere there is an inconsistency in my method and I will try to find it.
-
MA Rodger at 03:54 AM on 28 May 2026A look back at ‘An Inconvenient Truth,’ 20 years later
Evan @33,
Indeed. It looks like will not gain anything from continuing the interchange without getting seriously into the weeds.I would suggest the graphic below summarises our differences. (The post-Jan 2025 numbers are not intended as a dig.) I place it in-thread as well as posting it HERE (Posted 27th May 2025).

Beyond our evident differences, I should mention that the values you quote for post-2000 acceleration look to be rather low, I'd assume due to some arithmetical slip.
The rate of CO2 increase is currently running at +2.6 ppm/yr having exceeded +2.0 ppm/yr since 2000. So the average acceleration for the period 2000-25 has to be well above [(2.6 - 2.0) / 25yr =] +0.024 ppm/yr/yr, probably averaging even above +0.032 ppm/yr/yr. Yet your values thro' the post-2000 period sit well below that, with the highest +0.0154 ppm/yr/yr. -
Evan at 21:28 PM on 26 May 2026A look back at ‘An Inconvenient Truth,’ 20 years later
MA Rodger@32, you say that the acceleration peaks in the center of the period 2000-2026. I show the acceleration continuing to increase at the end of this period, but forgetting about nit-picks, my main thesis is that the Keeling Curve continues to show a robust, upward acceleration. Here is my analysis.
As reported in my @30 post, I use powerlaw curve fits to 15-year segments of data, and calculate the acceleration from the powerlaw fit at the midpoint of each of these three intervals to get
- 2000-2015: Midpoint year 2008, acceleration = 0.0102 ppm/yr/yr
- 2005-2020: Midpoint year 2013, acceleration = 0.0120 ppm/yr/yr
- 2010-2025: Midpoint year 2018, acceleration = 0.0139 ppm/yr/yr
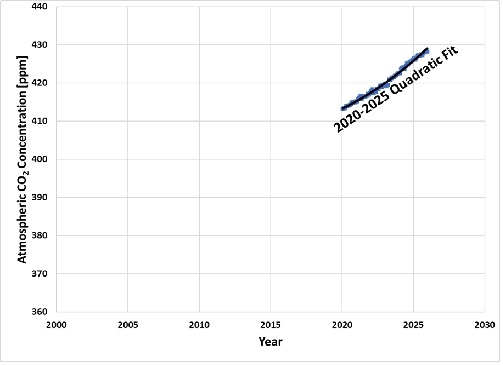
If I add two additional sets to this by fitting the CO2 data from 2015-2025 and from 2020-2025, two periods that I believe are too short for statistically-significant results, I get the following.
- 2015-2025: Midpoint year 2020, acceleration = 0.0144 ppm/yr/yr
- 2020-2025: Midpoint year 2023, acceleration = 0.0154 ppm/yr/yr
These last two results are not statistically-significant, but they certainly don't show any hint of a slowdown.
I appreciate all the work you've put into this friendly exchange, but at this point I have nothing more to offer. Anyway that I look at the data that I feel properly accounts for the large cycles that need to be averaged out, I find CO2 concentration accelerating upwards. And likely that acceleration is increasing. It is not important for me to prove that last point, because even a stable upward acceleration is really bad. In fact, even a stable upward rate of increase is bad.
But thanks MA Rodger for everything you've put into this discussion thread.
-
MA Rodger at 19:40 PM on 26 May 2026A look back at ‘An Inconvenient Truth,’ 20 years later
Evan @30/31.
I'm entirely unfamiliar with "using a robust function." I'm assuming instead that you are actually saying you 'obtained' a "robust" result with the quadratic regression and this 'robustness' is indicated by the Rsq being close to 1. If so, you should consider how that Rsq would look when adjusted for autocorrelation - probably a whole lot less "robust." And shifting to an exponential relationship for the regression (or something else more exotic) can't provide a fix to the quadratic regression results which showed (as does the linear) that acceleration peaks in the centre of the period 2000-26.What you and I are disputing is whether-or-not the level of acceleration in the later part of the 2000-26 period is low enough to consider being zero-acceleration and thus a 'plateau' for the rate of CO2 increase.
Simply stitching curvy regressions together to present some further apparent legitimacy isn't a process I would accept. (This is rather reminiscent my school days and Taylor's Theory.)
You conclude your comment @30 saying you "cannot get it (your analyses) to admit any kind of slowdown in the rate of accumulation of CO2." Have you noticed that the graphic @30 shows the 2000-15 projection diverging from the 2005-20 projection quicker than the 2015-25 projection. That in-itself is symptomatic of your missing 'slowdown.'You re-visit the data @31 using 10-year averages of CO2 increase. (I was for some reason unable to properly duplicate your graphical output. However, it was close enough to continue.)
Your graph is showing robust acceleration but over the whole 2000-26 period. To get a bt more out of the data over the later part of that period (where I see my 'plateau' and you feel you've seen an increase in acceleration), how about using rolling 12-month values for your analysis rather than just annual ones? And how about using longer and shorter periods to see what the appears? So not just 10-year average increase but 4-year, 6-year, 8 year, 12-year, 14-year as well. The more the merrier. And how about taking an average of those 4,6,8,10,12,14?I have up-loaded the result of such analysis HERE Posted 26th May 2026.
-
Evan at 08:14 AM on 26 May 2026A look back at ‘An Inconvenient Truth,’ 20 years later
MA Rodger, here is another way I look at the data. I take the CO2 concentration in a given year, subtract the CO2 concentration 10 years ago and divide by 10, to get the average change in CO2 concentration over that 10-year interval. Then I increment 1 year and repeat. This gives me a series of average annual CO2 changes where I am averaging the behavior over 10 years. I plot this vs year to get an idea how the average rate of increase is changing.
When I do that, I get an upward sloping line, indicating that on average (using 10-year running averages), the rate of CO2 increase, increases each year.
There is nothing in the following graph that suggests to me a plateauing of the trend. Rather, I see a consistent upward trend. If people are tempted to intrepet the slight dip at the upper end of the curve as the start of a plateau, remember we are headed into a monster El Nino this year, which usually causes a short-term spike in CO2 concentrations.
-
Evan at 07:37 AM on 26 May 2026A look back at ‘An Inconvenient Truth,’ 20 years later
MA Rodger@29
I have to admit that some of what you described is a bit above my pay grade. But thanks for your detailed explanation.
I fit the data using a robust function. Quadratics can be dangerous when extrapolated, but in this case the R-square fit parameter is about 0.998, so that extrapolation is warranted. But if you prefer, I can also use a powerlaw expression, which also fit with an R-square of about 0.998, and show exactly the same trends. I hope you agree that powerlaws can be safely extrapolated.
My purpose in extrapolating the functions over one time interval into the future is to show that if we were making progress to slow the rate of rise, then we would expect future CO2 concentrations to fall on or below our extrapolated curves. That they consistently sit above the extrapolated curves says clearly that things keep getting worse, not better. That is, there is no evidence of a plateau in 15-year averages.
So here is a new plot showing powerlaw functions fitted to the CO2 data over intervals of 2000-2015, 2005-2020, and 2010-2025. I again extrapolate each trend line into the future, to show that the actual data consistently sits above what we projected in the past. That is, things keep rising faster than a simple acceleration associated with past trends.
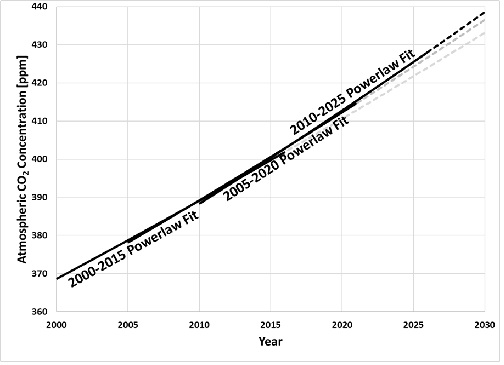
We can take the second derivative of the powerlaw trend lines and evaluate the acceleration at the midpoint of each respective curve.
- 2000-2015: Midpoint year 2008, acceleration = 0.0102 ppm/yr/yr
- 2005-2020: Midpoint year 2013, acceleration = 0.0120 ppm/yr/yr
- 2010-2025: Midpoint year 2018, acceleration = 0.0139 ppm/yr/yr
Not only is the acceleration increasing according to this simplistic analysis, but the rate of increase of acceleration seems to be constant, although I concede that this analysis is far to simplistic to make such a conclusion. But on the other hand, no matter how I cut the data, I cannot get it to admit any kind of slowdown in the rate of accumulation of CO2.
I therefore still maintain, that CO2 concentrations continue accelerating upwards, despite all that we're doing to try to slow it down.
-
MA Rodger at 20:58 PM on 25 May 2026A look back at ‘An Inconvenient Truth,’ 20 years later
Evan @26/28,
I was tempted to roll-back this discussion to that analysis I presented @23 rather than directly address your comment @26. (One reason for such a roll-back is an aversion to using quadratic regressions, something which I am also not very well set up for using.)
But perhaps I should address your comment @26 and say why it is giving you apparent indications of continuing acceleration thro' the recent decade-or-so of MLO CO2 data.Your first graphic shows two overlapping quadratic regressions for MLO CO2, namely for periods 2000-2015 & 2010-2025. So the overlap period is 2010-15.
You say "15 years should be sufficient to average out the effect of wobbles such as El Ninos" but I would be inclined to the opposite view. However, with autocorrelation a issue, such a wobblological assessment is well beyond my pay grade.You project the 2000-15 regression line to out 2025 and it sits below the 2010-25 regression line. The implication of these curvatures of the quadratic regressions does point to accelration and your use of this 'overlap' is potentially showing greater acceleration 2010-25 than 2000-15. Wisely you do not go that far but do see these regressions as demonstrating continuing acceleration thro' 2010-25 and thus conclude there is no 'plateau', a situation you describe as leaving "no room for interpretation."
Part of my aversion to quadratic regression is that I have in the past found there is always far more 'room for interpretation' than you would ever expect.What you are missing in this analysis of the period 2000-25 is the intermediate period sitting between your early & late ones, namely the quadratic regression for the period 2005-20. Such regression shows the acceleration providing the strong curvature thro' the period 2000-25 is happening within this central part of the post-2000 data. I've graphed out these quadratic regressions (2000-26) with a bit more clarity by plotting the data as its deviation from the linear rise between 2000 & today (see HERE Posted 25th May 2026)
Futher, I don't see this analysis providing evidence of continued acceleration and the absence of a 'plateau'. Logically it wouldn't. That same graphic shows the linear rise 2015-2026 and totting up the residuals; the linear rediduals are as big as the quadratic residuals.Concerning testing for accelertion, I wouldn't venture beyond OLS (which proves too sensitive in this present ciscumstances) or rolling averages (which do better) or nigelj's "put a ruler on the graph."
-
Evan at 21:20 PM on 24 May 2026A look back at ‘An Inconvenient Truth,’ 20 years later
Nigelj@27, thanks for your feedback. I would not draw conclusions from my simple graphs about the impact on warming starting in 2012. My goal was to use two 15-year graphs to ensure there was sufficient averaging of wobbles. But there is so much more that goes into determinging warming, such as variations in clouds and atmospheric sulfate particles.
Also, I would not conclude from my graphs that there was an increase in the acceleration rate of CO2 concentration that began in 2012. The sole purpose of my graph is to show that over a reasonable time frame, there is no indication that the Keeling Curve is leveling off, but rather that it shows a continuing, upward acceleration. However, the increase I show would be consistent with an increased acceleration, even if it does not prove it.
Also, I am not inferring anything about emissions with my graphs. The Keeling curve is the net effect of all human and natural emissions, minus all human and natural sinks. Human emissions are just one part of what affects the Keeling curve.
One thing to keep in mind. Human emissions are about 4% of natural emissions. We would not have to change natural emissions or sinks to significantly affect the rate of accumulation of CO2 in the atmosphere. The reason I prefer to follow the Keeling Curve more than reports on what our emissions are doing, is that the Keeling Curve gives the net of effect of our actions on the atmosphere, whereas human emissions are just one component.
-
nigelj at 11:49 AM on 24 May 2026A look back at ‘An Inconvenient Truth,’ 20 years later
Evan @26
Im trying to understand your first graph showing 2 quadratic curves fitted to the graph with the trend of the first curve extended. The second curve is above the extended first curve. Therefore it denotes the second curve means theres an acceleration in the acceleration starting around 2012. Is that all correct?
If that is all correct its interesting because its generally thought theres an acceleration in surface warming starting around 2012, although its not 100 certain. But that suggests the acceleration in warming is more likely due to an acceleration in emissions than the reductions in aerosols.
-
Evan at 22:16 PM on 22 May 2026A look back at ‘An Inconvenient Truth,’ 20 years later
MA Rodger,
I am not sure why you are including "wobbles" in your consideration. Don' we consider sufficiently long data sets so that the effect of wobbles is averaged out?
I show below a graph of a quadratice fit to two, overlapping 15-year intervals: 2000-2015 and 2010-2025. 15 years should be sufficient to average out the effect of wobbles such as El Ninos. I show just the trend lines, without the data, so that the averaged trend can be clearly seen.
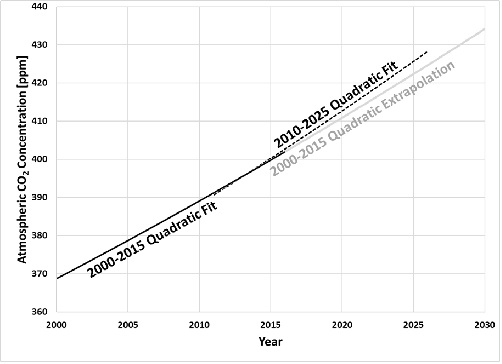
The upward curve of the quadratics clearly indicates upward acceleration. I project the 2000-2015 curve forward to show where we would be had the 2000-2015 baseline trend continued into the future. That we are above that trend line indicates that the rates are increasing above the 2000-2015 baseline.
For me this plot leaves no room for interpretation, because the data is taken over a sufficiently long interval to average out wobbles, and it indicates a trend that is increasing above the 2000-2015 baseline. I don't see any plateau in the acceleration that can be justified in a 15-year interval.
And even if we look at a 5-year interval, which is too short to average out long-term wobbles, we still see a concave trend line, indicating acceleration even over this unjustifiably short, 5-year interval. And considering that we are headed into a giant El Nino later this year, which is accompanied by a spike in CO2 concentrations, that applies even more upward pressure to this unjustifiably short 5-year plot.
I am open to looking at things differently, and will be grateful if you can show me where I'm going wrong in my analysis. I am treating the data over sufficiently long time periods to average out wobbles, and still see unmistakable upward acceleration. These excerpts of the Keeling Curve just don't give me room for optimism. But they do suggest that I should prepare for a future with more challenging conditions.
-
MA Rodger at 16:01 PM on 22 May 2026A look back at ‘An Inconvenient Truth,’ 20 years later
nigelj @21,
It would be nice if it were so simple. But those annoying wobbles manage to get in the way. I've graphed out the NOAA's MLO de-seasonalized CO2 data 2015-to-date and annotated the micro-accelerations-&-decelerations (Green & Red). This approach is not definitive as these Green-&-Red bits would shift about a significant amount with small changes to the start-finish dates of the periods used. See graphic HERE Posted 22nd May 2026
Over the full period since 1958, the overwhelming situation is one of acceleration, and indeed increasing acceleration. The big exception within this trend was thro' the 1990s when rates decelerated due to the Pinatubo eruption, this quite evident in the NOAA 'Annual Increase of CO2 at MLO' graph up thread.
The recent 'plateau' with a period of zero acceleration is so-far a less obvious feature.
-
Evan at 20:38 PM on 21 May 2026A look back at ‘An Inconvenient Truth,’ 20 years later
Nigelj@22, yes, I concur with your assessment. If the curve deviates from a straight line, it is accelerating. And yes, the functional fits I use are quadratic equations, which fit very nicely to the CO2 data.
MA Rodger@23, I must confess I had difficulty following your method, but it may because I am busy preparing for a presentation. One of the benefits of fitting a function to the CO2 data and then analyzing the behavior of that fitted function is that the fitted function smooths out the wobbles. The fitted function extracts the average behavior from the noise. This permits easier analysis of the behavior of the data set by evaluating the behavior of the fitted function.
What I have in mind for my response my be of sufficient length that it is more valuable to simply write a blog post for SkS. You and I could then continue our discussion there, and more people may benefit. I'll try to get a quick response here later today, and then will likely plan a longer SkS post for the full response.
And I will try to give your analysis and better read later today after my presentation.


