


 Arguments


2024's unusually persistent warmth
Posted on 16 September 2024 by Zeke Hausfather
This is a re-post from The Climate Brink
My inaugural post on The Climate Brink 18 months ago looked at the year 2024, and found that it was likely to be the warmest year on record on the back of a (than forecast) El Nino event. I suggested “there is a real chance that the world exceeds 1.5C above preindustrial levels in 2024 in the Berkeley Earth record” but that “it is still more likely than not that 2024 temperatures come in below that level.”
Since that post, I think its safe to say that the intervening year and a half surprised us all. We saw extreme (one might even say gobsmacking) global surface temperatures in the second half of 2023, which pushed the year above 1.5C in the Berkeley Earth record (and just shy of 1.5C in Copernicus).1 This heat arrived far earlier than any of us anticipated; even before the El Nino event that we expected to drive record warmth had fully developed. Global temperature records were shattered by between 0.3C and 0.5C in each month from July to December 2023.
In early 2024 it appeared as if the world had potentially returned to a more predictable (though far from good!) regime, with global temperature records exceeding the prior records set in the winter of 2016 by around 0.1C, which is reasonably in-line with what we would expect to see for a big El Nino event 8 years after the 2016 super El Nino.
At the time I (and others) suggested that global temperatures would likely begin to fall back down to around 1.3C above preindustrial levels by June, and end up well below 2023 for the second half of the year as El Nino faded and La Nina conditions potentially developed. This seemed like a reasonable expectation based on the trajectory of prior El Nino events (e.g. 2016). However, nature had something else in mind:
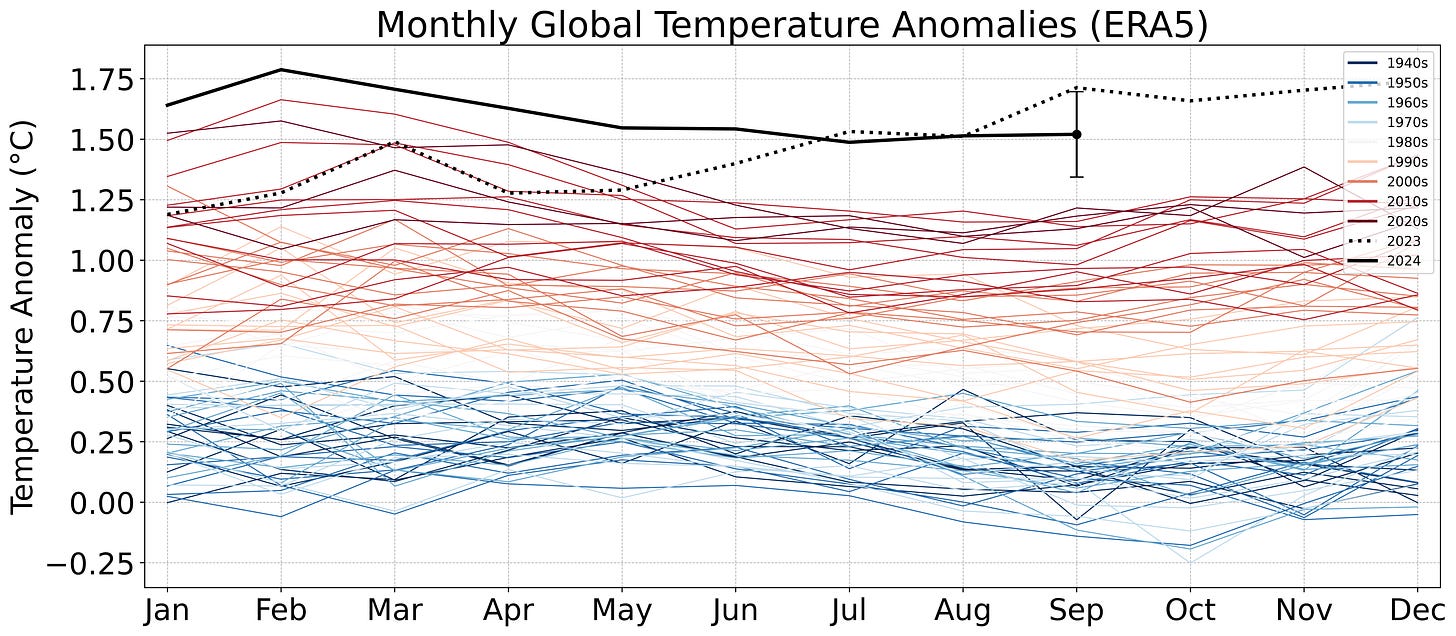
Rather than falling out of record territories, global temperatures have remained highly elevated going into the summer and fall months. We saw new temperature records in May and June, and tied the exceptional heat of 2023 in July and August. Its only in September – which shattered prior records by 0.5C in 2023 – that we will very likely see global temperatures falling out of record territory.2
A different pattern than 2015/2016
Climate scientists tend to assume that, unless there is compelling reasons to expect otherwise, past climate behavior provides a reasonably good analogue to what we expect to see in the future.
To that end, the last big El Nino event (which developed in 2015 and peaked in early 2016) provides a useful point of comparison with what has happened over the past 18 months.
The figure below shows the evolution of global temperatures for both the 2015-2016 period (in blue) and the 2023-2024 period (in orange). A 30-day running mean of temperatures is shown to minimize noise from daily variability in global temperatures, and the x-axis shows a count of days since the start of the period (e.g. 2015 and 2023, respectively). The 2023-2024 temperatures are further normalized by subtracting 0.16C, which is an approximation of the amount of human-driven warming we expect between 2015/2016 and 2023/2024.
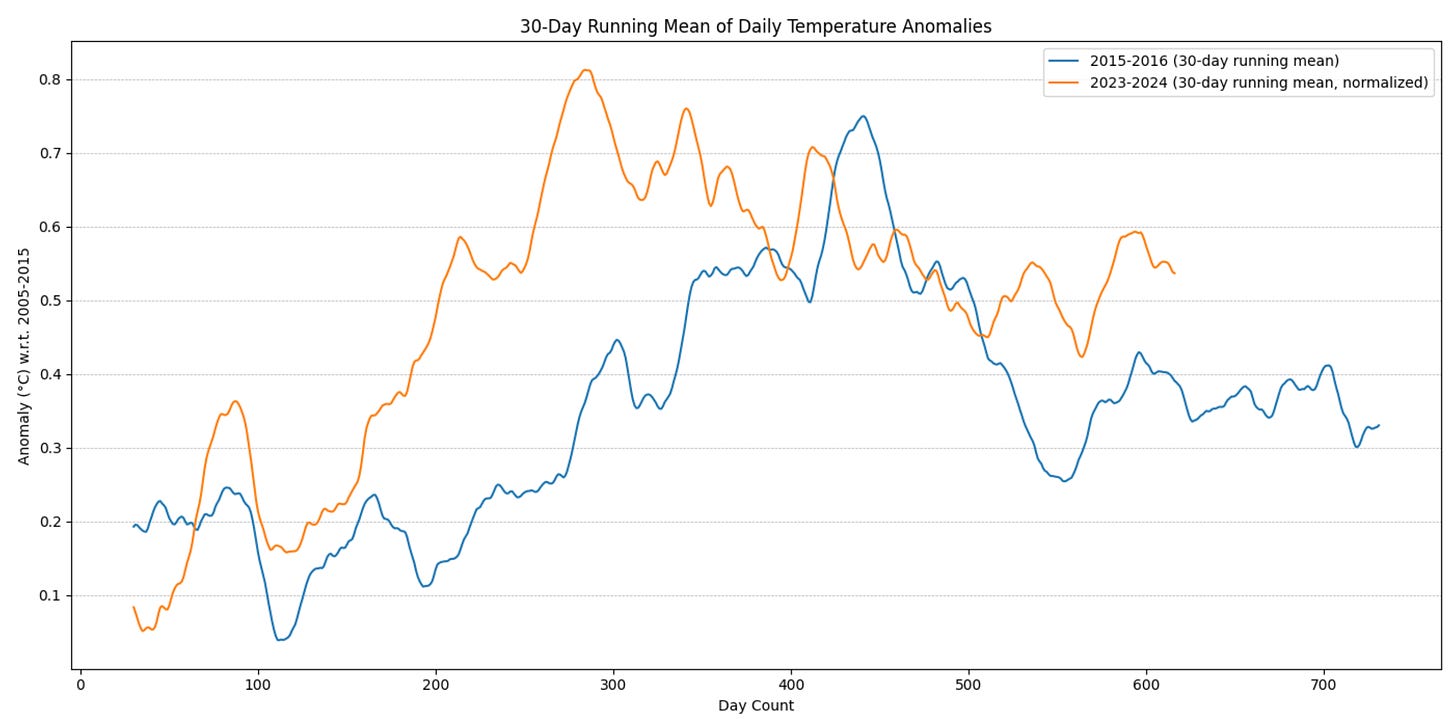
Here two factors stand out. First, the heat arrived much earlier in 2023 than it did in 2015. In 2015, global temperatures only began to be significantly elevated in the last two months of the year (e.g. November and December). By contrast, 2023 saw a rapid increase in temperatures starting in June. Similarly, the 2015/2016 El Nino saw a peak in global temperature response in March 2016, while the 2023/2024 event saw a peak in September 2023.
Finally, in 2016 global temperatures began to fall in mid-May as the El Nino event faded. By contrast, 2024 temperatures have remained elevated through early September (so far) rather than declining.
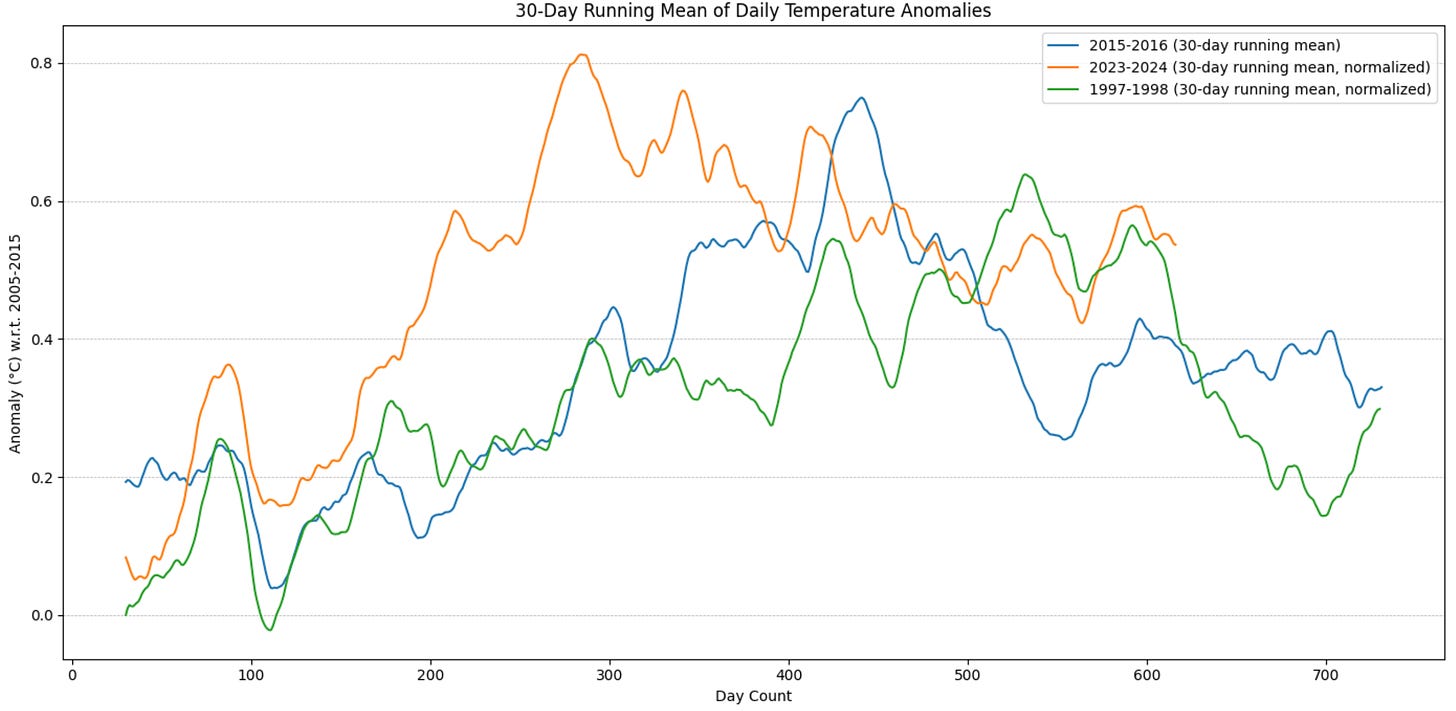
We can also include the prior big El Nino event – 1997/1998 – in the figure below. That El Nino event did see more persistent heat than 2015/2016, with temperatures remaining elevated until the start of September 1998, after which point they rapidly declined.
While its possible that global temperatures will finally start to fall in the next few weeks, given the highly anomalous trajectory of 2023 and 2024 to-date I would not bet on it.
What might this mean going forward?
Unfortunately we still lack a good explanation for what drove the exceptional warmth the world saw in 2023 and 2024. We have a lot of potential mediocre explanations (e.g. low sulfur marine fuel regulations, the Hunga Tonga volcanic eruption in 2022, an uptick in the 11 year solar cycle, El Nino behaving weirdly, etc.). But these have increasingly been modeled, and it is hard to explain the magnitude of the global temperature anomaly the world has experienced even adding all of these estimates together.
Many of us hoped that if 2024 returned to a more predictable post-El-Nino regime it would provide evidence that what happened in the second half of 2023 was a blip – some short lived internal variability that drove a spike in global temperatures but did not persist.
However, with temperatures remaining elevated into September 2024, its looking increasingly less likely that last year’s elevated temperatures were a mostly transient phenomenon. Rather, some combination of forcings or changes in feedbacks may be driving higher global temperatures going forward.
1 It's worth reemphasizing here that while a single year above 1.5C relative to preindustrial is a noteworthy milestone, the Paris Agreement target is interpreted as a long-term (~20 year average) to help isolate the human component of warming from year-to-year variability. We don’t expect the world to firmly pass 1.5C (e.g. >50% of years over 1.5C) until the late 2020s or early 2030s.
2 Beating September 2023 would be truly staggering, and the data available for the first week of the month suggests we are not seeing quite as large a global temperature spike this year. Though I’ve already been wrong enough times about the global temperature trajectory over the past 18 months that who really knows at this point!


Could there be some change in the Oceans other than the El Nino cycle, perhaps chemically or biologically that is limiting the oceans previous ability to absorb as much of the global to absorb as much of the global warming
?
[PS] cleaned up multiple comments
pattimer:
My first reaction is to think "nothing chemical or biological". The energy sink that we see as global warming is entirely physical - thermal energy. Plant photosynthesis does store energy from the sun, but that is essentially offset by the release of energy as biological carbon decomposes.
Most of the energy imbalance (solar radiation absorbed, minus infrared radiation emitted out to space) goes into oceans. The heat capacity of air (the entire atmosphere) is a tiny fraction of the heat capacity of the oceans.
Our routine temperature observations only cover small proportions of the ocean/atmosphere systems. Our most detailed ones are air temperature near the surface - your everyday weather station data. When you see global air temperature fluctuating during El Nino cycles, we are seeing a shift between what stays in the atmosphere and what goes into oceans.
I think it will take time to figure out just what part of the oceans is storing less heat during this period of warmer atmospheric temperatures. And even more time to understand just exactly how the physics has played out.
...but my gut says "physics", not chemistry or biology.
Bob Loblaw:
You may be right, and probably so. However the chemistry of the oceans is changing and changes in biology will affect this outwith photosynthesis. The oceans are becoming more acidic for example (although I am not saying that changes in air borne fraction of CO2 is involved here as that presumably would have been accounted for).
We will see if this pattern of unexplained increased air temperatures persist on the long term or not, through the different phases of the El Nino La Nina.
Certainly worrying regardless.
pattimer:
To have chemistry or biology affect atmospheric temperatures, you need to argue that there is a mechanism by which those changes in chemistry and/or biology lead to a physical change in atmospheric heat storage.
For ocean chemistry, you would need to have chemical reactions that release enough energy to lead to increased ocean temperatures, which would then lead to increased atmospheric temperatures. This seems highly unlikely, but I'm open to suggestions.
For biological activity, the same applies. Photosynthesis is a possible suspect, as that consumes energy at the surface. The energy that goes into photosynthesis would otherwise go into the other energy transfers that occur at the surface: emission of IR radiation back to the atmosphere, transfer of heat (thermal energy) into the atmosphere, transfer of heat into the ocean or land, or the evaporation of water (which then goes into the atmosphere in the form of latent heat, and is released to thermal energy when the vapour condenses again). If there is less photosynthesis, then more energy would go into the other fluxes, but where?
...but photosynthesis is already part of the system (as is heat released as carbon is oxidized), and you'd have to argue a change in biological activity that is pretty large.
Bob:-
Thank you for your reply.
I cannot explain a mechanism for my speculation. It is because I am both concerned and puzzled by these observations that I ask these questions and will keep a look out to see how this pans out as undoubtedly many experts will be following this up.
.... however IF there were enough changes in the surface salinity of the oceans for example resulting in circulation changes with less heat sinking would this be classified as a physical or chemical change? Would it matter anyway what we called it?
Pattimer @ 6:
A change in salinity would be something I would consider to be a change in chemistry, and the resulting change in density would be something I would consider to be a change in physics. As salinity and density are important considerations in global ocean circulation patterns, yes a major shift in salinity could result in changing ocean circulation and changing where in the system (deep ocean, shallow ocean, atmosphere) thermal energy is stored.
In terms of process, higher temperatures usually means more evaporation, which increases salinity. Higher salinity means higher density. But a lot of the small-scale circulation in the upper ocean (60-100m) is wind-driven. Salinity does play a role in larger/deeper ocean circulation.
You may wish to read this SkS repost from RealClimate, from last February, on the Atlantic Meridional Overturning Circulation.
I think we're in agreement that time will tell, as more data comes available and more analysis is done.