


 Arguments


Recent Comments
Prev 1010 1011 1012 1013 1014 1015 1016 1017 1018 1019 1020 1021 1022 1023 1024 1025 Next
Comments 50851 to 50900:
-
scaddenp at 09:48 AM on 28 January 2013The connection between Hurricane Sandy and global warming
If Bob has a contribution towards the "search for truth", then there would be no problem publishing it in lines with scientific norms then would there? -
Rob Honeycutt at 09:13 AM on 28 January 2013The connection between Hurricane Sandy and global warming
And Plantman... I would also point out that linking blog posts and news reprints from someone who is not a researcher in the field in which he's commenting holds very little weight. My suggestion for you would be to spend more time reading peer reviewed literature and comments from scientists who actually work in the field you're trying to understand. You might not get the answers you want to hear that way, but you are far more likely to get an accurate understanding of the science. -
Rob Honeycutt at 09:06 AM on 28 January 2013The connection between Hurricane Sandy and global warming
Plantman... No one is claiming a monopoly on science. We do claim that science needs to be comprehensive and accurate, both of which tend be lacking in Tisdale's work. -
Plantman at 08:55 AM on 28 January 2013The connection between Hurricane Sandy and global warming
There is no monopoly on "science". Science is the search for truth, not the assertion that you have a monopoly on it. Consider these opinions on the Sandy issue: http://blog.nj.com/njv_paul_mulshine/2012/11/did_a_warming_sea_intensify_sa.html and http://bobtisdale.wordpress.com/2012/11/07/october-2012-sea-surface-temperatures-and-anomalies-along-sandys-path-were-not-unusual/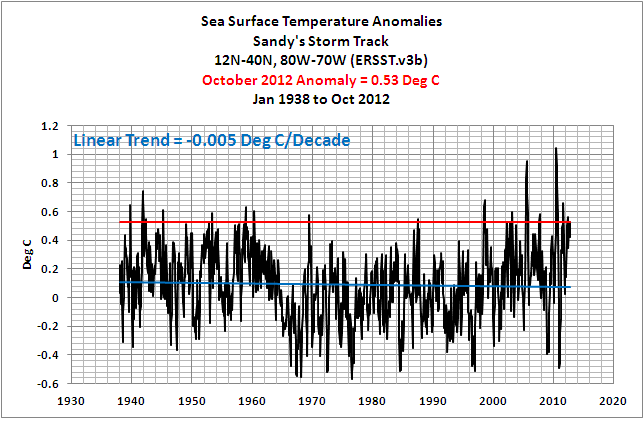 Moderator Response: [RH] Fixed image width. Also note: All caps are against policy. Please review commenting policies before continuing to comment. All caps changed to lower case and italicized.
 -
Andy Skuce at 07:11 AM on 28 January 2013Subcap Methane Feedbacks. Part 4: Speculations
Killian The large areas of ocean methane bubbling up that have been observed in the atmosphere are in the shallow (10's of metres) shelf areas such as the East Siberian Arctic Shelf, not the much deeper (hundreds of metres) ocean basins where methane hydrates are observed (on seismic data) and sampled (by dredging and drilling). I did not claim that the gas chimneys in the Laptev Sea were fed by biogenic methane, quite the contrary. The Cramer and Franke reference at the top of the page concluded that this methane is "thermal gas", that is to say thermogenic or "fossil" methane. Perhaps you could elaborate on why you believe that Archer is "just off". I am sure that he has read most, if not all of the literature since 2007, in fact he has written about a dozen papers between 2008 and 2012 according to his web page. I don't dispute that destabilization of methane hydrates will likely have a significant negative impact on the climate, just that the impact will more likely be spread over centuries or millennia rather than decades. But there are obviously many unknowns and I look forward, somewhat anxiously, to future research being published. -
Kevin C at 07:06 AM on 28 January 201316 ^ more years of global warming
Trunkmonkey: Just to be sure I'm understanding you correctly - are you saying that the deviations of the 'human contribution' (or more correctly the ENSO/solar/volcanic-removed temperature) from linear (or more correctly from anthropogenic forced response) are due to variations in the rate of heat transfer to the deeper ocean? If so, then I think there is another mechanism to consider. A while back Kevin Trenberth was answering questions on a post here, and I asked about the nature of the unaccounted-for radiation imbalance since 2003. If I remember correctly he attributed part of the answer to anomalous cloud response during an ENSO event. In which case it could be that clouds can play a significant role on short timescales. I suspect these two mechanisms account for much of the deviation, but I wouldn't like to guess in what proportion. -
DSL at 06:39 AM on 28 January 2013There is no consensus
Jeff, I don't know where you're attending university, but at the university I teach at, the professors drive students to question them. Any student who produces a useful method or discovery is going to be helped into publication by the professor(s). Your comment strongly suggests you believe a hoax is being perpetrated, and that strongly suggests you have no idea how the scientific process works. And, btw, I've talked with plenty of meteorologists who do not understand the basic theory of anthropogenic global warming. Joe Bastardi leaps to mind. -
william5331 at 05:35 AM on 28 January 2013Video on Climate Change Lines of Evidence by the National Academy of Science
The radiative forcing is indeed greater than the observed temperature rise. This doesn't necessarily mean that the radiative forcing is in error. It could easily be that Giai's feed back mechanisms are "fighting" against the radiative forcing. The possibility is that this is a 'light switch' phenomenon and that when forced far enough, we will see a step change to a warmer world in keeping with the level of radiative forcing. An ice free Arctic ocean in, say, July might be when we will see such a lurch upward. -
sauerj at 05:27 AM on 28 January 2013Video on Climate Change Lines of Evidence by the National Academy of Science
The video is excellent. These are exactly what is needed to help educate the ignorant. I think non-emotional professionally done videos like this have more potential to turn a contrarian-bias mind. 2/3 of these people are nearly a lost hope anyway, and a passionate, overbearing or spiteful message will only further entrench them. For the other 1/3 (who still have a thread of true skepticism), they will only be receptive to these sorts of very educational and fair-balanced, non-polarizing messages. This is the way to go! Unfortunately, there are too FEW of these available. Why is that? In my opinion, the climate change collegiate are, sadly, a dis-organized crew (understandably because their agenda isn't based on contrived cooked information). But, a little more organization would still help a lot. That's what makes this SkS site so good (a clear organized light in the abundant sea of conflicting messages). One obvious omission is a conservative (low-end) projection to 2100 based on BAU, or better yet, a moderate reduction in GH emissions (starting in say 2025). Even a conservative projection like this would be a big eye-opener for many. ... I will be sharing the youtube site. ... Thanks for sharing here! -
scaddenp at 05:16 AM on 28 January 2013CO2 is just a trace gas
The article simply debunked the idea that "trace" means it cant possibly be a problem. The direct radiative effects of CO2 as well as the feedbacks are dealt with in other articles. If you have problems with this, then please see the article Sensitivity is low -
yphilj at 05:10 AM on 28 January 2013Video on Climate Change Lines of Evidence by the National Academy of Science
Pretty nice video with well-produced graphics. I did notice, however, at about 11.5 minutes in, there was a small discussion about atmospheric methane that includes the assertion that its concentration has "leveled-off." The chart shown terminates at 2006. It should be noted that since 2006, atmospheric methane concentrations have increased steadily. More data here: http://www.esrl.noaa.gov/gmd/aggi/ -
Killian at 04:55 AM on 28 January 2013Subcap Methane Feedbacks. Part 4: Speculations
"However, most of the methane produced from dissociating marine hydrates will be consumed by anaerobic processes in the top few metres of sulphate-rich near-sea-floor sediments and all of the rest will be dissolved and oxidized in sea water and will not be released to the atmosphere as methane" And this squares with the large areas of methane bubbling out of the Arctic waters how? Also, are you claiming the large areas of methane seepage, including single chimneys more than a kilometer wide, are coming from bacterial activity and not hydrates? Studies have found that methane hydrates are destabilizing on the ESAS, around Spitzburgen, and even down the US East Coast. So, huh? Oh, and Archer's stuff at RC is just off. Way off. I'm frustrated every time he posts on the subject. It's as if he's only read the literature from pre-2007. -
dvunkannon at 04:47 AM on 28 January 2013NASA Retirees Appeal to their Own Lack of Climate Authority
I haven't gone through all of them, but many of the reports list on the TRCS page http://www.therightclimatestuff.com/StudiesReports.html are actually quite rational. I especially liked the notation "'skeptical' climate scientists in TX = zero" on one of them. ps - I retract saying I was banned on WUWT. My last comment there was delayed, and did not show to me as 'in moderation', but has now appeared. -
trunkmonkey at 03:59 AM on 28 January 201316 ^ more years of global warming
Enthalpy is transferred almost exclusively from the surface to the atmosphere.Oceans constitute 70% of the surface and oceans have continued to warm (albeit very unevenly)over the past 16 years.I suspect the residual shown in the graph above represents the baseline inevitable transfer of energy from a warming ocean to the atmosphere.If I get a minute I'll plot your residual against Reynolds "all ocean" SST's. -
trunkmonkey at 03:30 AM on 28 January 2013Humidity is falling
Judging from the draft, it seems likely the IPCC will report that there is no trend in atmospheric water vapor. -
curiousd at 03:07 AM on 28 January 201316 ^ more years of global warming
Reply to scaddenp in 115: No I have no reason to discount GISTEMP (GHSN) land only index. And I thank you. As a retired professional physicist new to climate science, one of the many aspects I find bewildering is the "alphabet soup" of various temperature records. For anything new I delve into in the climate change area, I find it useful to check out my assumptions first at SKS. There is no one at my University who knows more than thing one about this topic, and therefore this site is for me an information godsend. -
gws at 02:39 AM on 28 January 2013CO2 is just a trace gas
Jeff313, The article does not use the words "equate" or "equivalent" once. Instead it points to the similarity of the (false) "trace-only"-argument in giving examples most people can quickly relate to. -
EliRabett at 02:18 AM on 28 January 2013Lessons From Past Predictions: Ridley vs. IPCC and Hansen
IEHO it would be best to change "but they have almost all been far more accurate than his own" to "all the IPCC predictions have been much more accurate that Ridley's. The only one that has been worse was Hansen's 1988 model because of an assumption of a too high climate sensitivity, something that Hansen acknowledges and corrected in later versions of his model. Eli might add the later GISS model projections to the list, e.g. 1998. -
Tom Curtis at 01:32 AM on 28 January 2013Humidity is falling
Jeff313 @3, you make two substantive claims. The first is that +CO2 - H2O equals no change in greenhouse gases. Apparently this is regardless of the magnitude of the changes in each, as you express no quantities. That is an unusual form of algebra you indulge in, but one I feel no need to follow. The second is that "our graphs are misleading", but our graphs are just reprints of the graphs from Desler & Davis 2010. Further, the purpose of Desler and Davis is to compare all of the reanalysis products. Consequently you are complaining that SkS is misleading because they accurately report the data from a study that looks at all reanalysis products. Frankly, at this point your comment is not making much sense to me. Bad algebra, and an objection to showing all the data seems to be all the counterargument you can muster. You do, of course, claim that all reanalysis products other than NCEP use similar algorithms. Would you care to document that? Or should we add "truth by decree" to your other modes of irrational argument? -
andylee at 01:08 AM on 28 January 2013Skeptical Science and social media - Ask not what SkS can do for you, but what you can do for SkS
I got quite addicted to Twitter, a constant stream of interesting stuff, but it's also sometimes like drinking from a firehose. I'm perhaps a bit over-considerate, and only tweet if I have something useful to contribute, and then only in moderation. It's great for having a chance of reaching an intended audience, as I'm tentatively doing now plugging my latest Arctic Sea Ice Volume animation, with soothing music: Arctic Requiem... (John, you're welcome to add it to the resources, as with the last video.) It's getting some interest and a few retweets, and ad revenue may even eventually cover the cost of the electricty used to render it! -
Jeff313 at 01:03 AM on 28 January 2013Humidity is falling
"To claim that humidity is decreasing requires you ignore a multitude of independent reanalyses, including newer ones with improved algorithms, that all show increasing humidity" Doesn't changing algorithms that give you what you want to see raise a red flag for anyone? Perhaps they are better algorithms, but the number of times " (-intimations of fraud, impropriety and malfeasance snipped-)". Also, (-intimations of fraud, impropriety and malfeasance snipped-).Moderator Response: [DB] Please review this site's comments policy (link adjacent to the comments box) before making further comments. -
Tom Curtis at 00:45 AM on 28 January 2013There is no consensus
Jeff313 @529, by meteorologist you mean "member of the American Meteorological Society". As not only academic meteorologists, but also broadcast meteorologists (aka, TV weathermen) can be members of the AMS, and do not require any formal qualification, or even study in meteorology to do so, I do claim that some members of the AMS do not have more than superficial knowledge of how the atmosphere works. As it happens, only 52% hold a PhD. Only 56% actively published in the peer reviewed literature in the last five years, and only 12.88% where published primarily on climate change. That is, of those participating in the survey, only 13% have a reasonable claim to be expert on the topic. As it happens, we know from Doran 2009 that around 88% of Climatologists (excluding broadcast climatologists) believe humans are the primary cause of global warming. A little albebra tells us that 45% of responses to the AMS survey where from climatologists with PhD's who agreed that there was global warming, and that humans where the main cause; an only 6% of them doubted any part of that proposition. That the vast majority of climate change "skeptics" in the AMS are broadcast meteorologists, who may or may not have skills beyond those required to look good on camera and read a weather map. Certainly Anthony Watts has repeatedly demonstrated that you can be a broadcast meteorologist (and member of the AMS) and be clueless about atmospheric physics. By the way, even the broadcast meteorologists aren't that fond of AGW "skepticism". 70% of respondents thing that humans have caused at least half of the global warming and only 6% claim global warming was the result of natural causes. Likewise, 76% or respondents think global warming will be harmful, with only 2.4% thinking it is beneficial. Consequently your consensus of the non-experts still falls firmly on the side of the IPCC, despite your best efforts to spin the surveys findings. -
Philippe Chantreau at 00:15 AM on 28 January 2013There is no consensus
How does one being polled have do argue with anyone? -
Daniel Bailey at 00:12 AM on 28 January 201316 ^ more years of global warming
freddyv33, Skeptical Science conserns itself with actual discussions of the science of climate change...and the debunkings of the nonsense spewed about it. While WUWT has the latter (nonsense) in abundance, the utter lack of consistency in moderation practices there makes it impossible to have civil discussions about the science there. Unlike SKS, where the even enforcement of a strong comments policy serves to ensure that actual discussions of the science can happen, free from invective, slander, innuendo, unsupported assertion and character assassination in favor of promulgating false equivalence to support the ephemeral facade of "debate" and "sides". By your "preach to the choir" quip you nakedly reveal your ideological base. -
Philippe Chantreau at 00:05 AM on 28 January 2013NASA Climate 'Skeptics' Respond with Science! Just Kidding.
Freddy you seem to be confused as to what an ad-hominem argument is. It amounts to saying "such and such are bad people who eat little babies for breakfast so what they say is wrong." It is obviously a logical fallacy, since the breakfast habits and moral standards of such and such have no bearing on the validity of their argument. There are objective ways to evaluate the validity of an argument, especially when it pertains to physical reality. I quickly re-read the post, I fail to see where an ad-hom fallacy takes place. The competence of the protagonists is disputed, ndn rightly so, since they show signs of not being familiar with the science that they pretend to dismiss. That is not an ad-hom argument. It does not say anything against me as a person if someone says that I don't know squat about quilting (especially if I demonstrate it by putting my foot in my mouth without even realizing). However, it is relevant when analyzing any opinion about quilting that I would decide to put forth. I could still be right, so my opinion should be examined on its own merit, with the caveat that I don't know squat about the subject. If it turns out to be right, I could be praised for my instinctive understanding, or just called lucky. If it is wrong, it won't be much of a surprise and not of much consequence anyway. In any case, I should be reminded that I don't know squat about the subject and that spouting an opinion is somewhat misplaced. It would be epecially misguided of me to dismiss the findings of real experts in the matters. Anyone reminding me of that would state a very reasonable fact, not make an ad-hom. Someone venturing to question my motive for doing so would still not make an ad-hom argument, since my argument has already been examined for its merit and my competence has been established. So, in the light of this clarification, where in the article above is there an ad-hom argument? -
Jeff313 at 00:01 AM on 28 January 2013There is no consensus
It all depends on what people they choose to exclude. If "Climate Experts" refer to academia involved in climate research, this is extreemly bias as anyone who disagrees with Global Warming would have to agressively argue with senior college professors; anyone who went to college knows this is not a very easy thing to do. However if you consider all the meterologists, a group of people no one can claim is uninformed on how the atmosphere works, the actual poll numbers are far less supportive of the alarmist Global Warming mentality. Only 89% even believe warming is happening, only 59% believe man is the primary contributor to it and less than half are "very worried" about the severity of the damage it could cause. http://www.forbes.com/sites/jamestaylor/2012/03/14/shock-poll-meteorologists-are-global-warming-skeptics/ OR http://www.ametsoc.org/boardpges/cwce/docs/BEC/CICCC/2012-02-AMS-Member-Survey-Preliminary-Findings.pdf -
Tristan at 23:45 PM on 27 January 2013NASA Climate 'Skeptics' Respond with Science! Just Kidding.
"that makes all sorts of adjustments to a data set to deny that global temperature is declining and yet the HadCRUT data says exactly that: global temperature is in a decline over the past ten years." I think a bit of clarity here is important: HadCRUT doesn't measure global temp, it measures global surface atmospheric temp. That's one small slice of the earth's total heat content. No one is denying that a trendline drawn through the past decade of Had4's temps is negative. What the majority of climate scientists dispute is that that is evidence that the earth's total heat content has reduced. -
Tom Dayton at 23:34 PM on 27 January 201316 ^ more years of global warming
trunkmonkey: As Kevin C wrote, the term "'noise'...can include unmodeled signals as well as measurement errors." But Kevin overgeneralized, because in many scientific and mathematical usages, the term "noise" is used to refer to any information that is not the particular information you are interested in, regardless of how systematic that undesired information is, and regardless of whether you know its source. So it is perfectly legitimate to refer to F&R's treatment as removing the noise since we are interested in the trend that is not due to those removed influences. -
Stranger8170 at 23:27 PM on 27 January 2013Water vapor in the stratosphere stopped global warming
Thank you so much. I've been able to use the information I've learned here and at REAL CLIMATE and have gained considerable amount of general knowledge. When you guys go off on the technical side I continue to read it anyway and through the repetition I begin to understand more of it. But when I get someone giving me what I figured was mumbo jumbo from a denier I probably need a little guidance. You’ve really made me scientifically curious after having absolutely no science background. This site has been a great resource and I'm a true fan! -
Jeff313 at 23:26 PM on 27 January 2013CO2 is just a trace gas
There is one problem with this article. It conveniently assumes that the "trace" amounts of CO2 equates to the "trace" amounts of the examples that lie right on the boarder of what is acceptable. For example, arsenic (0.01 ppm is the WHO and US EPA limit) would cause health concerns if doubled via the definition of the EPAs goal of setting limits. However, if arsenic in the water is actually at 0.001 ppm, then doubling would be no problem, in fact you could increase it 10x and still drink the water without a second thought. It is a misleading to use these examples with assumptions that the equivalent "trace" amounts just barely meet the definition of what is acceptable; arsenic at 0.01000001 is no longer a acceptable amount, again by the definition of the EPAs goal of setting limits. With this said, I agree that using the "trace" amount argument without considering anything else is extreemly weak, as it does not include feedback mechanisms. However, to disgard the "trace" amount argument without the hard proof that those feedback mechanisms are as strong as most climate models claim is equally weak. -
BillEverett at 22:54 PM on 27 January 2013Non-English climate science
Ari, quoting from your Mikhail Budyko link: "Budyko's groundbreaking book, Heat Balance of the Earth's Surface, published in 1956, transformed climatology from a qualitative into a quantitative physical science. These new physical methods based on heat balance were quickly adopted by climatologists around the world. [emphasis added]" The book referred to was published in Russian (Тепловой баланс земной поверхности, Л., 1956). Science is now international (and has been for a long time). I don't know of any major Russian journal that is not translated into English. I do know of many minor journals that are not translated (of the type Bulletin of Samara State Technical Pedagogical College). As a general rule, significant work is not submitted to minor journals.Moderator Response: [DB] Fixed hashtag. -
Tom Curtis at 22:40 PM on 27 January 2013New textbook on climate science and climate denial
Stranger @17, I have made some general comments on the issue. Very general, I am afraid, as I am unable to determine the actual point of your respondents argument, and hence respond directly to the claims. -
Tom Curtis at 22:38 PM on 27 January 2013Water vapor in the stratosphere stopped global warming
Stranger @4, sorry for this late response. I saw your post but did not comment because it is discussing an area about which I do not know a lot; and because the claims in your points 1 to 3 seem to have no logical relationship. What, for example, has the amount of acres burnt (in the US?) have to do with water vapour and precipitation? Never-the-less, at your request on another thread, I will attempt a response, and hope we can clarify what your respondent is trying to claim, and possibly bring in some more expert opinion. In so far as your respondent is claiming anything, it appears to be that a large amount of energy is transferred from the ocean to the atmosphere in the form of latent heat, which is true. They possibly want to conclude from this that this heat transport is not accounted for in mainstream climate science (I'm not sure). If, however that is there claim, it is blatantly false. In the famous energy balance by Trenberth, Fasullo and Khiel, evapo-transpiration is listed as transferring, on average 80 Watts per meter squared of power from the surface to the atmosphere. So, we don't have to "calculate that over all the oceans". Climate scientists, those people who study climate rather cherry picked parts of the climate because they think it will make a point, have done so already. In fact, that energy transfer is fundamental to our understanding of atmospheric physics. Without it, the lapse rate (the rate at which temperature declines with altitude) would be the dry adiabatic lapse rate, ie, 9.8 C per kilometer of altitude. But the release of latent heat as moisture precipitates out of the air lowers that. In the extreme case, it lowers it to the saturated adiabatic lapse rate of 5 C per kilometer, but on average it reduces it to 6.5 C per kilometer. All Global Circulation Models include these energy transfers, as they must to be effective. They even determine the change in lapse rate with time as global warming results in more evaporation, and hence more precipitation. Frankly, your respondent appears to be in a position analogous to an enthusiast telling a rally car driver that they are getting everything wrong because they are ignoring the operation of the accelerator. They only think they have discovered something momentous because of their overwhelming ignorance on the subject. Finally, I struggle to make sense of the comment that "it will be laughable to blame stratospheric increase of temperature", which is a complete nonsequitur. Convection only carries air, and hence evaporated water vapour to the tropopause. The result is that the stratosphere is very dry. (It has become more moist recently, but because of water produced in jet exhausts rather than from general circulation.) What ever sense can be made of their other comments (which is little), none can be made of their bringing in the stratosphere which has no bearing on anything they say earlier. Finally, your respondent may be trying to give a garbled account of a paper recently published, of which the editor said,"After extensive deliberation however, the editor concluded that the revised manuscript still should be published – despite the strong criticism from the esteemed reviewers – to promote continuation of the scientific dialogue on the controversial theory. This is not an endorsement or confirmation of the theory, but rather a call for further development of the arguments presented in the paper that shall lead to conclusive disproof or validation by the scientific community."
Eli Rabbet discusses that decision (which is appalling), but also links to some extensive and informed critiques of the theory in question. -
Stranger8170 at 21:59 PM on 27 January 2013New textbook on climate science and climate denial
I’ve been lurking here at SKS for the past 4 years. During that time I’ve never posted. I know the protocol that’s employed concerning off topic statements. You always tell the poster that they should post in the appropriate thread where it can be addressed. Well I finally decided to post so I went to http://www.skepticalscience.com/water-vapor-stratosphere-global-warming.htm to try and figure out what kind of point a denier was trying to make. I’ve read several of your articles on water vapor but all my knowledge is general and his was more technical than I’m use to in a discussion in which I’m involved. Excuse me for posting on a thread that has no relevance to what your discussing but as far as I can tell my post was never noticed or it wasn’t worth commenting on. -
Tristan at 21:52 PM on 27 January 2013NASA Climate 'Skeptics' Respond with Science! Just Kidding.
Which terms do you have a problem with, freddy? -
freddyv33 at 21:47 PM on 27 January 2013NASA Climate 'Skeptics' Respond with Science! Just Kidding.
It's strange how the TOS say that ad hominem attacks are not allowed and (-sloganeering and inflammatory snipped-). (-sloganeering snipped-). Now that is all I stated. But stop for a second and be honest about what you feel about me. You have me pegged as a skeptic and a denier, but in fact I believe that CO2 is warming the planet based on the data I have seen. (-inflammatory snipped-). (-inflammatory tone snipped-).Moderator Response: [DB] Unless you provide specific examples to support your contentions then your comment has no signal and constitutes sloganeering noise. If you wish to be solution-oriented then provide those examples. Or continue to be part of the very problem you unsupportedly assert exists. -
michael sweet at 21:47 PM on 27 January 2013Non-English climate science
The IPCC includes native speakers of all these languages. They are supposed to review all material relevant. Why would the IPCC not include review of all other language sources of information? Many non-English areas publish local reports that are not peer reviewed. The IPCC uses this grey literature in locations where peer reviewed material is not available. They should also pick up non-English. Can you suggest literature you think is relevant that was not included in the last IPCC report? -
ajki at 19:55 PM on 27 January 2013Video on Climate Change Lines of Evidence by the National Academy of Science
In addition to the video series mentioned above, it may be interesting for those who like videos (I really hate! internet videos) that the "German Advisory Council on Global Change" (WBGU) has published another video series recently. It's a kind of "Video Seminar" that adds to a report named "World in Transition – A Social contract for Sustainability" and covers a broad range of topics. For further information you may have a look at: E-Seminar "Transformation" [WBGU, english] -
freddyv33 at 19:49 PM on 27 January 201316 ^ more years of global warming
Concerning YouTube postings, why not do guest postings over at WattsUpWithThat.com? According to Alexa they have significantly more traffic and are just slightly better educated than the audience here. Sure there are some hardcore nuts there but you don't just want to preach to the choir. I read all the climate sites and find there to be a very high level of discussion there compared to many sites. -
Ari Jokimäki at 19:13 PM on 27 January 2013Non-English climate science
Keith, thanks for the good tip. There's another post on the way using the same raw search method as this post, but after that I'll start using these more sophisticated searches. Bill, I know that there are some journals in Finnish, but I don't know what the situation is with same results being available also in English. English version of the Russian journal is a good find. I hope they offer also the past several decades of that journal at least in abstract level some day. It is quite fortunate that researchers write their stuff in different languages so that at least some of their results are available also in English. For example, there is a Russian climate science pioneer Mikhail Budyko who published some work in the above mentioned Russian journal but also published in English. Another interesting language in this sense might be China with many times more search results than Russia, and perhaps behind even stronger language barrier. -
Kevin C at 18:54 PM on 27 January 201316 ^ more years of global warming
Yes, absolutely they are not noise. Weather is more akin to 'noise' in the statistical sense, although the statistical meaning of the term noise is somewhat context dependent - it can include unmodeled signals as well as measurement errors, however if those unmodeled signals are not noise-like they can invalidate your conclusions. So when people describe the F&R calculation as removing noise from the trend, that is certainly an oversimplification. The adjusted time series is the temperature series with the best approximation to the influence of the known natural oscillations subtracted out, which provides therefore provides a better estimate of the residual processes in the system. -
chriskoz at 18:38 PM on 27 January 2013Video on Climate Change Lines of Evidence by the National Academy of Science
I find the video (I did not check the booklet) quite informative and useful as an entry level teaching tool. The only inaccurate (to my liking) detail is: - the suggestion that the current total energy imbalance due to all forcings is 1.6Wm-2. That's is incorrect, because the temps has risen by .6C, therefore increasing the heat loss due to IR by ~1Wm-2 since preindustrial, therefore the current imbalance is 0.6Wm-2 and that (rather than 1.6Wm-2) is the equivalent of 2HBsec-1 they are talking about thereafter. -
trunkmonkey at 16:38 PM on 27 January 201316 ^ more years of global warming
PDO is not noise. El Nino is not noise. They are fundamental processes that define the system. They work in conjunction and they work in antagonism both to each other and other processes and oscillations. The Australian hotspell is noise. A random resonance that defines no fundamental recurring process or oscillation. For a hypothesis regarding thermohaline influence on PDO and ENSO please see: http://geosciencebigpicture.com/2013/01/26/loose-fire-hose-and-the-aborted-nino/ -
chriskoz at 15:49 PM on 27 January 20132013 SkS Weekly News Roundup #4
A piece of bad news from Australia: even worse carbon emissions. Emission "export" to China is a "workaround" the carbon tax or ETS. Weareas Jim Hansen's scheme of fee and divident charged at the point of fossil fuel excavation (when breached the main principle of leaving FF in the ground) charged in the mine and at port of entry (in case of import/export) would have avoided this loophole. -
Riduna at 10:03 AM on 27 January 2013NASA Retirees Appeal to their Own Lack of Climate Authority
H Leighton Steward shows that he is well aware that right wing politics and the view of those who have heavily invested in the fossil fuel industry always outweigh the laws of physics. I'm not sure that age necessarily indicates failure to understand climate science though it certainly limits one ability to keep up[ with its latest developments - I speak from experience. I'm 81. -
A Change in the Weather at 07:58 AM on 27 January 2013NASA Retirees Appeal to their Own Lack of Climate Authority
These are old white guys who don't want AGW to be true. They can't stand the implications. They're in love with the technology they helped advance, and convinced that it's a gift from a beneficent God to his chosen people, us Americans. They're emotionally invested in it not being true because it shatters their worldview. Their God would have betrayed them, and they would have had direct culpability in pushing civilization to the brink of doom. I'd say they're pathetic if I felt sorry for them. But I'm sure they're an arrogant, self-satisfied, and unself-aware tribe of jingoists, impressed with their own ability to find the tiny inconsistencies in the data trees. Meanwhile, they ignore the forest, the obvious and overwhelming evidence that, ironically, can be seen from space: the disappearance of the Arctic ice cap. It's the idiot light at the top of the world. Not to mention all the satellite data NASA collects. NASA should firmly rebut them and categorically disavow any ongoing relationship. These reactions remind me of smokers who denied that tobacco causes lung cancer for decades, even though the evidence was equally obvious. And ultimately fatal. -
Same Ordinary Fool at 06:45 AM on 27 January 2013NASA Retirees Appeal to their Own Lack of Climate Authority
H. Leighton Steward included NASA astronaut Harrison Schmitt among the sixteen scientists (half of them recognizable skeptics) who signed a January23,2012 opinion piece in the Wall Street Journal discounting Global Warming. Steward was also behind the April 10,2012 letter to NASA by 49 former NASA scientists disputing climate change. "While making presentations in late 2011 to many of the signatories of the letter, Steward realized that the NASA scientists should make their concerns known to NASA and the GISS." (The Goddard Institute..., which "emphasizes global climate change") This suggests another possible motivation for anonymity. How many of these 20 report writers had already signed the letter to NASA? It would take a psychologist to work out the group dynamics in this situation. Ex-NASA retirees sitting down to presentations of a new subject. Many of the presenters also being ex-NASA. All united to challenge another part of NASA, GISS. And so we have the rocket scientists challenging the climate scientists, about climate science! -
keithpickering at 06:25 AM on 27 January 2013Non-English climate science
Another Google Scholar tip, for eliminating authors' names from your search: 1. Select "Advanced Search" (to the right of the main search box. 2. Put the desired search text (e.g., "Klima") in the box labeled "all of the words" 3. Put the non-desired author name, preceded by a - (e.g. "-Klima") in the box labeled "Return articles written by". And now you have articles with the keyword "Klima" but not with author "Klima". To get articles about Klima AND also written by Klima, put "Klima" in both boxes. -
scaddenp at 05:42 AM on 27 January 201316 ^ more years of global warming
Do you have some reason to discount GISTEMP (GHSN stations) Land only index ? -
Eric Grimsrud at 03:04 AM on 27 January 2013NASA Retirees Appeal to their Own Lack of Climate Authority
Dvunknnon, FYI, I was also kicked out of WUWT multiple times for similar attempts to inject some science into a few threads. An account of my experiences there can be read at ericgrimsrud.wordpress.com, November archives. For some reason, Mr. Watts get very uncomfortable when a real scientist with a real education background and a real history of research in climate or atmospheric science is in his midst.
Prev 1010 1011 1012 1013 1014 1015 1016 1017 1018 1019 1020 1021 1022 1023 1024 1025 Next


