


 Arguments


Recent Comments
Prev 1022 1023 1024 1025 1026 1027 1028 1029 1030 1031 1032 1033 1034 1035 1036 1037 Next
Comments 51451 to 51500:
-
Cornelius Breadbasket at 07:57 AM on 22 November 2012Wigley and Santer Find the IPCC is too Conservative on AGW
michael Fair point. This site describes the science in 'Basic', 'Intermediate' and 'Advanced'. I wonder if it may be a good model for the IPCC? -
Doug Bostrom at 07:56 AM on 22 November 2012It's El Niño
Do we get to see where all our extra energy is coming from in Kayell's Part 2, or will that be left as an exercise for the reader? Put another way, how is ENSO creating all the extra energy we're seeing? How long can ENSO continue raising the global temperature? If as we've seen the ocean stubbornly continues to warm during the period Kayell is describing, where's the energy source? Or is there a disproportionate increasingly refrigerated cool patch in the E. Pacific we've missed? A simple question with an answer readily to hand, surely? -
M Tucker at 07:32 AM on 22 November 2012Newsflash: A 4°C warmer world can, and must be, avoided - World Bank
These “scientific geniuses” make it sound like the 0.8 degrees we have already had is just fine. Do I really need to list the numerous adverse, extreme weather events we have suffered already? And it’s not just heat waves. We already have unprecedented melting of the Arctic. We have seen the evidence of the Greenland ice sheet melting. We have the evidence of the Iceland ice cap melting. We have the evidence of warming along the Antarctic Peninsula and the resultant collapse of the Larsen ice shelves and rapid melting of the glaciers they once buttressed. All with 0.8 degrees! Who ever said more warming is safe for civilization? If Jim Young Kim is going to “hold warming below 2 C” what will he hold onto? What is the magic brake lever he will grab? "Even if greenhouse gas emissions stopped tomorrow, “climatically important” amounts of carbon dioxide and other compounds emitted today would continue to influence the atmosphere for thousands of years, Caldeira said." (in 2011) "The pioneering study, led by NOAA senior scientist Susan Solomon, shows how changes in surface temperature, rainfall, and sea level are largely irreversible for more than 1,000 years after carbon dioxide (CO2) emissions are completely stopped. The findings appear during the week of January 26 [2009] in the Proceedings of the National Academy of Sciences." Let’s keep whistling past that old graveyard and accept the report from an organization that continues to fund coal power plants in those same poor regions they talk about in their report. As the climate spirals further away from manageable our response seems to get wackier. -
IanC at 07:13 AM on 22 November 2012It's El Niño
Kayell, FIrst off, I should say I appreciate you putting together the summary. I have a few questions regarding the data. 1) Do you have a link to the specific dataset(s)? 2) Is the NINO3.4 data processed in anyway? and if so, how? -
Daniel Bailey at 06:44 AM on 22 November 2012We're heading into an ice age
Nonsense. You forget about the most important forcing present today, the previously-sequestered, anthropogenically-derived fossil-fuel CO2 slug we are injecting back into the carbon cycle. This forcing simply wasn't present at previous interglacial/glacial transitions. But then, actual scientists have already looked into this (as opposed to semimythical cycles); let's examine the facts, shall we: The oceans have been absorbing an extra 2 Hiroshima-bombs-worth of energy, PER SECOND, since 1960. That warming continues to this day, unabated. Per Tzedakis et al 2012“glacial inception would require CO2 concentrations below preindustrial levels of 280 ppmv”
(for reference, we are at about 391 right now…and climbing). Earlier, Tyrrell et al 2007 examined this, concluding that we have already skipped the next glacial epoch. Furthermore, Tyrrell concludes that if we continue our present fossil fuel consumption,"Our research shows why atmospheric CO2 will not return to pre-industrial levels after we stop burning fossil fuels. It shows that it if we use up all known fossil fuels it doesn't matter at what rate we burn them. The result would be the same if we burned them at present rates or at more moderate rates; we would still get the same eventual ice-age-prevention result."
and"Burning all recoverable fossil fuels could lead to avoidance of the next five ice ages."
So no glacial epochs the next million years… Facts, like tiggers, are wonderful things, for those who have them. -
Broadlands at 06:25 AM on 22 November 2012It hasn't warmed since 1998
"Is 1998 actually the hottest year on record?" In the contiguous US 1998 is the warmest year on record. The trend since then, however, has been down. 2012 is almost certainly to be the "new" warmest year on record in the US. Nevertheless, the 1998 record high annual temperature will have to be broken by almost two full °F for the downward trend to be broken. This seems unlikely. But, who knows, 1917 is the coldest year on record and it was replaced by the warmest in just four years. The average annual temperature went up 3.7°F from 1917 through 1921. -
Bob Lacatena at 06:10 AM on 22 November 2012It's El Niño
Kayell, Well, you got me to thinking, and I realized that Tisdale is so close to being right, but he got the most important parts wrong. See, El Niño events confuse everyone because they raise observed atmospheric temperatures, so people think that means "ah ha! warming!" But in reality, the planet sheds more heat during El Niño events, because the warmer atmosphere emits more radiation. It's sort of like a bathtub overflowing. What matters more is La Niña events, where the atmosphere is cool, but this means that the planet doesn't radiate heat well (it's basically trapped in the ocean), so this must be what is really causing global warming (or, rather, a lack of global cooling, as Jo Nova likes to say). So I broke the temperatures up at large La Niña events, and used that to "detrend" the global temperatures. Let's take a look (I helped you out by adding blue vertical bars where I broke the temperature record... the original temperature record is in green, while red is the "detrended" temperatures): Of course I didn't rescale the ENSO and Global Temperatures to match, a step you performed but seemingly failed to mention. Still...
Hmmm. My graph looks closer than yours, using Tisdale's method. So I must be right!!!
Of course I didn't rescale the ENSO and Global Temperatures to match, a step you performed but seemingly failed to mention. Still...
Hmmm. My graph looks closer than yours, using Tisdale's method. So I must be right!!!
 La Niña is causing global warming!!!!
Or is it pirates? Hang on. If I can find a graph of pirate populations, I'm sure I can make pirates the cause of global warming.
[This climate science stuff is so easy! Anyone can do it!]
La Niña is causing global warming!!!!
Or is it pirates? Hang on. If I can find a graph of pirate populations, I'm sure I can make pirates the cause of global warming.
[This climate science stuff is so easy! Anyone can do it!]
-
Robertgj at 05:32 AM on 22 November 2012We're heading into an ice age
The isotope proxies for temperature and glacial ice volume correlate with the Earth’s orbital variations, but the correlations are far from perfect. The “internal” climate drivers of glacial-ice area, oceanic circulation, and water vapor transport interact to cause the large 100,000-year spikes and other noise variation in the long-term records of Vostok ice and ocean sediments. One such driver is the loss of northern perennial polar ocean sea ice due to CO2 warming. That ice may be gone by 2020 according to a simple extrapolation. There is a plausible connection between its loss and the initiation of the last ice age 120,000 years ago, and the next ice age may likewise begin in the next decade – because of our current warming. I am working on it, so stay tuned. -
Kayell at 05:27 AM on 22 November 2012It's El Niño
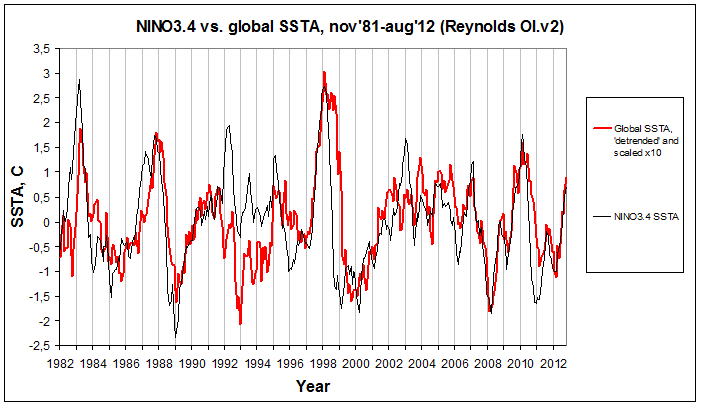
Here is PART 1: Like I said, Tisdale's version of the ENSO argument is pretty straightforward. It is NOT based on some foregone conclusion about the cause of global warming. It is a direct result of an inevitable conclusion arrived at AFTER looking at the real-world observational data at hand, an explanation derived from what we actually see happening in the Earth system as time passes, AND on what we know about the ENSO process and how it is observed to work, both in the Pacific and globally, rather than from a theoretical construct of assumed physical net effects on the complex planetary climate system as a whole. The argument follows the scientific method thus: I (or Bob) start out by observing a curious and, quite frankly, striking similarity between the NINO3.4 and the global SSTA curves over the last 30+ years (well, even much further back than this, but Tisdale's argument was always mainly based on data from the satellite era). This is certainly no new discovery. I think we can all agree on that the primary global temperature swings up and down, the large short-term variations in global temperature, are driven by the ENSO's mighty oceanic fluctuations in the East Pacific (where the NINO3.4 resides) and their worldwide impact being propagated partly by ocean currents, partly by atmospheric teleconnections. The global temperature goes up when NINO3.4 goes up (El Niño). And the global temperature goes down when the NINO3.4 goes down (La Niña). What happens then if we 'detrend' the global SSTA since 1981 and scale it against the NINO3.4? That is, we take away the obvious upward trend in the global to see how close the fit with NINO really is. This is only out of curiosity. Scientific curiosity. No one is yet suggesting or claiming anything. We just want to take a closer look at how the different data relates to one another. So yes, I'm 'manipulating' the global curve, no need to remind me. Here is the result:
Quite an astounding fit. And it will surprise no one. We know why the fit is so good. You will notice the global imprints in 1982-83/84 of the El Chichón eruption and especially in the wake of the powerful Pinatubo eruption, ~1992-95. Other than that you will see some 'extra' global heat (extra, that is, relative to a 'normal' (proportional) global response to the NINO signal) piling up during the first directly following La Niña year after a few of the El Niño's along the composite plot. But this extra heat always seems to be dissipated again shortly after this first following La Niña - the global soon after back on level with NINO.
So far, so good. What's next? Yup, that significant global upward trend that I got rid of. It's there, after all. But where does it come from? How do we follow its progression? Where do we look? What do we look for?
I will let you in on a little secret. When I 'detrended' the global SSTA curve in the graph above, I didn't use a statistical tool to remove a general upward trend. All I did was to pull it down at two (2) short sections: two datapoints in the last half of 1987 (July and November) and one datapoint in the beginning of 1999 (January). Why those two intervals specifically? This will become apparent as we move along (in Part 2). Bear this in mind ...
There is another way of showing the exact same thing, only WITHOUT removing the long term trend from the global SSTA:
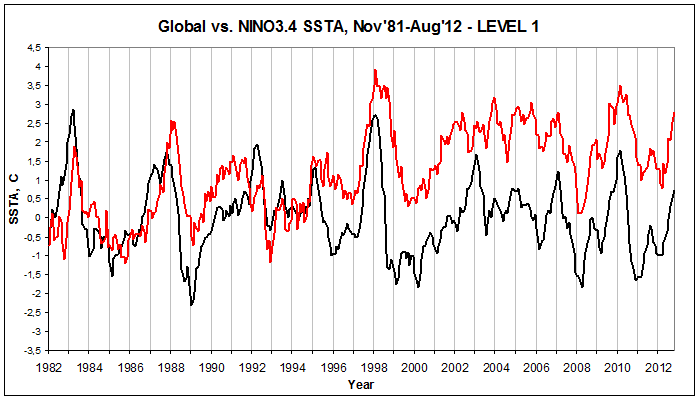 (The NINO3.4 is here alligned with the global curve between 1981 and 1987/88.)
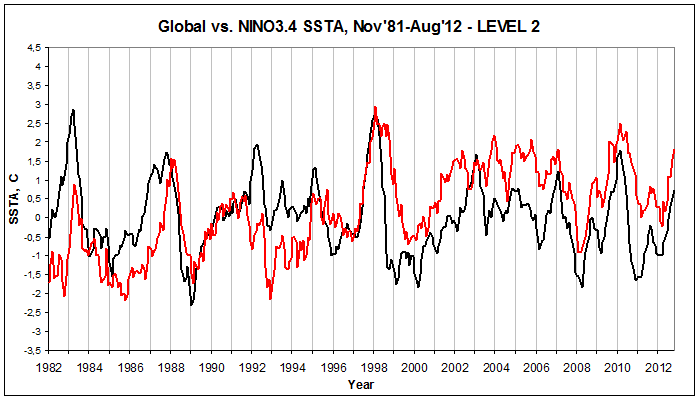 (The NINO3.4 is here alligned with the global curve between 1988 and 1997/98.)
 (The NINO3.4 is here alligned with the global curve between 1998 and 2012.)
Here is a more detailed look at the last 'level', the stretch since 1996, without volcanic impact, across the global upward shift occuring through 1998, and all the way down past the El Niño of 2009/10 and the following La Niña 2010/11:
(The NINO3.4 is here alligned with the global curve between 1998 and 2012.)
Here is a more detailed look at the last 'level', the stretch since 1996, without volcanic impact, across the global upward shift occuring through 1998, and all the way down past the El Niño of 2009/10 and the following La Niña 2010/11:
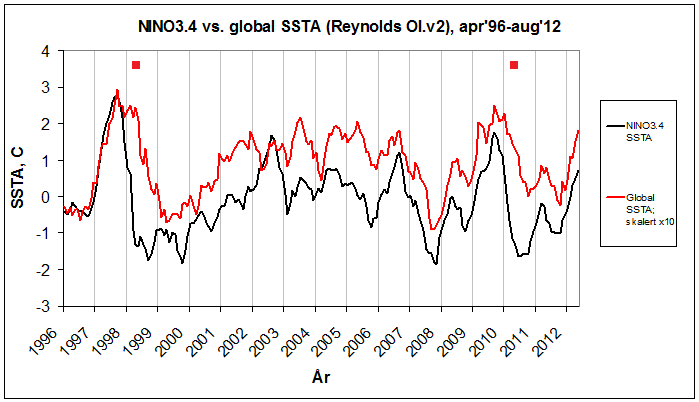 (The two red squares mark the conspicuous piling up of extra heat globally during the transitions between the particular ENSO events of El Niño 1997/98 and La Niña 1998/99 and El Niño 2009/10 and La Niña 2010/11. The first is followed by a raised global level in mean SSTA relative to the NINO3.4 curve. The second one isn't. At least, not yet.)
What can we conclude from all this? Not much as of yet. Except this: Global SSTA follow and mimic the major up and down temperature swings (El Niños and La Niñas) of the East Tropical Pacific on interannual time scales. AND, they also seem to follow the TREND in NINO3.4 rather slavishly over the last 30-31 years, that is, barring two (2) specific instances of marked and sudden global upward shifts relative to NINO.
That is, along virtually the entire record there is no need for an explanation of the evolution of the global curve besides the well-known relationship between it and the East Tropical Pacific - the already mentioned short-term variations, the primary ups and downs. Here there simply is no extra global warming trend outside of this close relationship, no increasing divergence between the two.
But then there are the upward shifts. The only places where the global curve diverge permanently from the NINO curve. There are only (and by that I mean ONLY) two cases between 1981 and 2012 where the extra heat piled up globally after an El Niño and during the transition to the first following La Niña is never fully made up for before the ENSO pendulum turns and the heat comes in again, both in the NINO3.4 region and globally. This is during and after the second and final peak of the 1986/87/88 El Niño, on the NINO way down towards the bottom of the very deep La Niña of 1988/89, and during and especially after the peak of the 1997/98 El Niño, on the NINO way down towards the bottom of the deep La Niña of 1998/99.
This can be illustrated like this:
(The two red squares mark the conspicuous piling up of extra heat globally during the transitions between the particular ENSO events of El Niño 1997/98 and La Niña 1998/99 and El Niño 2009/10 and La Niña 2010/11. The first is followed by a raised global level in mean SSTA relative to the NINO3.4 curve. The second one isn't. At least, not yet.)
What can we conclude from all this? Not much as of yet. Except this: Global SSTA follow and mimic the major up and down temperature swings (El Niños and La Niñas) of the East Tropical Pacific on interannual time scales. AND, they also seem to follow the TREND in NINO3.4 rather slavishly over the last 30-31 years, that is, barring two (2) specific instances of marked and sudden global upward shifts relative to NINO.
That is, along virtually the entire record there is no need for an explanation of the evolution of the global curve besides the well-known relationship between it and the East Tropical Pacific - the already mentioned short-term variations, the primary ups and downs. Here there simply is no extra global warming trend outside of this close relationship, no increasing divergence between the two.
But then there are the upward shifts. The only places where the global curve diverge permanently from the NINO curve. There are only (and by that I mean ONLY) two cases between 1981 and 2012 where the extra heat piled up globally after an El Niño and during the transition to the first following La Niña is never fully made up for before the ENSO pendulum turns and the heat comes in again, both in the NINO3.4 region and globally. This is during and after the second and final peak of the 1986/87/88 El Niño, on the NINO way down towards the bottom of the very deep La Niña of 1988/89, and during and especially after the peak of the 1997/98 El Niño, on the NINO way down towards the bottom of the deep La Niña of 1998/99.
This can be illustrated like this:
 (Bear with me on the Norwegian labelling. 'Trinn' is simply 'Level'. 'Ekstra varme globalt' means 'Extra heat globally'. Notice that here the pink curve is NINO3.4 and the black one is the global.)
Just give this a moment's thought. All we're doing is looking at the data. I'm just stating what the data at hand is telling us. There simply IS no steadily increasing divergence between NINO3.4 and global SSTA between late 1981 and late summer/early autumn of 2012. The ENTIRE global rise above the NINO3.4 occurs at two specific instances. Not at any other time.
In my world, then these two 'specific instances' are the ones up for closer inspection. THEY need an explanation. Not the rest of the graph. We've found something interesting at specific points in the data record and we want to check them out a bit more closely.
We follow the scientific method and ask ourselves:
How do these sudden and marked global upward shifts come to be? Seeing how extremely influential the ENSO processes are on the regular global temperature amplitudes, it would be a strange scientific approach to all of a sudden exclude ENSO from any further involvement in the ensuing investigation, as a possible factor also in the distinct upward shifts. By all means, it hasn't yet been shown to be the case. But it would be wise to at least follow that lead. To see if something out of the ordinary might have occured in those two particular cases.
Moderator Response: [Dikran Marsupial] Images inserted for readability, hopefully without mistakes. It would be best if the subsequent parts have the images in-line (there is advice on HTML formatting for SkS posts here). However I would recommend that you do not proceed onto part 2 until we have had a chance to digest part 1 and for relevant questions to be answered. Please can everybody respond to this post in a calm and scientific manner.
(Bear with me on the Norwegian labelling. 'Trinn' is simply 'Level'. 'Ekstra varme globalt' means 'Extra heat globally'. Notice that here the pink curve is NINO3.4 and the black one is the global.)
Just give this a moment's thought. All we're doing is looking at the data. I'm just stating what the data at hand is telling us. There simply IS no steadily increasing divergence between NINO3.4 and global SSTA between late 1981 and late summer/early autumn of 2012. The ENTIRE global rise above the NINO3.4 occurs at two specific instances. Not at any other time.
In my world, then these two 'specific instances' are the ones up for closer inspection. THEY need an explanation. Not the rest of the graph. We've found something interesting at specific points in the data record and we want to check them out a bit more closely.
We follow the scientific method and ask ourselves:
How do these sudden and marked global upward shifts come to be? Seeing how extremely influential the ENSO processes are on the regular global temperature amplitudes, it would be a strange scientific approach to all of a sudden exclude ENSO from any further involvement in the ensuing investigation, as a possible factor also in the distinct upward shifts. By all means, it hasn't yet been shown to be the case. But it would be wise to at least follow that lead. To see if something out of the ordinary might have occured in those two particular cases.
Moderator Response: [Dikran Marsupial] Images inserted for readability, hopefully without mistakes. It would be best if the subsequent parts have the images in-line (there is advice on HTML formatting for SkS posts here). However I would recommend that you do not proceed onto part 2 until we have had a chance to digest part 1 and for relevant questions to be answered. Please can everybody respond to this post in a calm and scientific manner. -
SirCharles at 01:06 AM on 22 November 2012Over 31,000 scientists signed the OISM Petition Project
Peter Hadfield AKA potholer54 has a good video on that. "Meet the Scientists" => http://www.youtube.com/watch?v=cMtiyHzUiP4 -
Kevin C at 00:13 AM on 22 November 2012Models are unreliable
On another thread, Snorbert Zangox asked:I wonder why, if that works so well, that the models cannot reproduce the past 16 years of temperatures not following carbon dioxide concentrations.
This one's easy. They can. This is the output from a very simple 2-box model. I wrote it in R in ~20 lines of code. All it does is find the response function which matches forcing to temperature over the past 130 years, with an additional term to account for the substantial impact of ENSO on temperatures. Red is model, blue is GISTEMP. You can see that the model also shows similar 1998 peak with a higher trend before and lower trend after. Why? Because there have been more La Ninas over the past few years, and the difference between an El Nino and La Nina is roughtly equivalent to 15 years of warming (see for example this article). The model reproduces reality very well indeed.
Now, since the ENSO cycle is chaotic, we can't predict when a run of La Ninas or El Ninos will occur, so this couldn't be predicted in advance. But if you look in the model runs for real climate models which reproduce ENSO well, you see exactly this sort of behaviour. The models predict it will happen from time to time, but not when.
There is a second aspect to your question, which you reveal in the 16 year figure. I guess you are referring to the viral '16 years of no warming' story. Ask yourself the following two questions: 'Why do this stories always HadCRUT and not GISTEMP?' and 'Why does no-one ever show a comparison of the gridded data?' Now look at this image which shows the change in temperature between the beginning and the end of the period from various sources. Which datasets have the best coverage? What is going on in the regions omitted in the HadCRUT data? You should now understand why HadCRUT shows less warming that GISTEMP over this period.
This is the output from a very simple 2-box model. I wrote it in R in ~20 lines of code. All it does is find the response function which matches forcing to temperature over the past 130 years, with an additional term to account for the substantial impact of ENSO on temperatures. Red is model, blue is GISTEMP. You can see that the model also shows similar 1998 peak with a higher trend before and lower trend after. Why? Because there have been more La Ninas over the past few years, and the difference between an El Nino and La Nina is roughtly equivalent to 15 years of warming (see for example this article). The model reproduces reality very well indeed.
Now, since the ENSO cycle is chaotic, we can't predict when a run of La Ninas or El Ninos will occur, so this couldn't be predicted in advance. But if you look in the model runs for real climate models which reproduce ENSO well, you see exactly this sort of behaviour. The models predict it will happen from time to time, but not when.
There is a second aspect to your question, which you reveal in the 16 year figure. I guess you are referring to the viral '16 years of no warming' story. Ask yourself the following two questions: 'Why do this stories always HadCRUT and not GISTEMP?' and 'Why does no-one ever show a comparison of the gridded data?' Now look at this image which shows the change in temperature between the beginning and the end of the period from various sources. Which datasets have the best coverage? What is going on in the regions omitted in the HadCRUT data? You should now understand why HadCRUT shows less warming that GISTEMP over this period.
I also wonder, admittedly without having thoroughly read the papers, whether we are using an elaborate logical scheme that is circular.
No, because we are talking about completely different models. If a climate model was being used to determine the aerosol forcing, you would have a potential case, however we are talking about completely different models. Atmospheric chemistry models are used to describe the behaviour of gasses in the atmosphere and are based on physics and chemistry which is observed in the laboratory. The results are combined with radar, IR, microwave and optical measurements to determine the state of the atmosphere - so far everything is empirical. This empirical data is tested against economic variables to determine how well the atomspheric chemistry is predicted by industrial activity. The robust agreement provides a basis for reconstructing atmospheric data from industrial activity before the observation period. The chain of inference is linear, not circular. Furthermore, no climate models are involved. (There appear to be several other approaches. Some involve climate models as a consistency check.) -
michael sweet at 23:42 PM on 21 November 2012Wigley and Santer Find the IPCC is too Conservative on AGW
Cornelius, Originally scientists received complaints that their reports were to numerical and that was hard for non-scientists to understand. "very likely", "likely" and other terms were specifically defined in the IPCC report so that the numbers could be removed. If people now do not understand the well defined terms, how can that be addressed? -
DSL at 23:39 PM on 21 November 2012Wigley and Santer Find the IPCC is too Conservative on AGW
Good news, Snorb! It's actually only Wednesday, not Thursday! You have all day! -
Snorbert Zangox at 22:23 PM on 21 November 2012Wigley and Santer Find the IPCC is too Conservative on AGW
Kevin C and scaddenp It is early morning on Thanksgiving Day here in the US of A, so I have little time to pursue this in detail, but shall do that over the next few days. Kevin C wrote one can estimate fine particle emissions from fuel use data with sensitivity to geographical variations. (-snip-) (-snip-).Moderator Response:[DB] Off-topic snipped.
[KC] Model discussion belongs on this thread where I have addressed your question.
-
ranyl at 20:04 PM on 21 November 2012Newsflash: A 4°C warmer world can, and must be, avoided - World Bank
"Thus, given that uncertainty remains about the full nature and scale of impacts, there is also no certainty that adaptation to a 4°C world is possible. A 4°C world is likely to be one in which communities, cities and countries would experience severe disruptions, damage, and dislocation, with many of these risks spread unequally. It is likely that the poor will suffer most and the global community could become more fractured, and unequal than today. The projected 4°C warming simply must not be allowed to occur—the heat must be turned down. Only early, cooperative, international actions can make that happen." From report, I would put that 2C considering it is all model based and the models so far have underpredicted well almost everything. Also doesn't include the permafrost feedbacks recently reproted, nor the facts that it uses a Climate sensitivity of 3C when appears that CS is higher as reproted by Trenbeth and from Pliocene extrapolations. New York already needs to have a planned relocation. Also uses models with far to optimistic carbon sinks, when the sinks are declining and going to keep doing so and the models in the report don't seem to have the loss sulphates effect (warming) or a full realisation of the lagged warming in the ocean (which I suspect is about to return to the surface through the AMOC circulation dynamics). So an optimistic report overall considering the new papers out since September. Then considering the shifts in mean already being seen to say the Russian heat will become a yearly event at 4C is missing the mean shift reality as it will be an 1:5 year occurance at 2C as the mean will have shifted well to the right by then. Then add in the faster tropical expansion, faster dessertification, more rain and geater extremes being seen than in these models and this wake up report is still painting an optimistic future. And as said above Dr. Anderson clearly says 2C is inevitable and 4C hardto avoid, to stay below 2C we need at most a peak 400ppm and 350ppm by 2100 and even that is only a 1:3 chance ish of being below 2C if the Pliocene data is right, 350ppm, 3-5C hotter! Paradigm shift anyone? Who has considered making room available in their homes for climate migrants yet? Stop flying, leave the car in garage whenever possible, turn the thermastat down and wear longjohns, give up on the modile phone, make gifts for christmas rather than consume more, use less energy willingly? Or is it going to be same old same old, replace what we have with "green bling" (PV panels have a very large environmental impact look up tri-nitrofloride and exactly how they made),when at peak 400ppm needed there isn't any carbon to be spending on such things anyway in an objective assessment. But if this is all doom and gloom, then get over your self, it just means living creatively and with ~90% less power, sharing, creating new employments, a new economic paradigm, a truly fair political system that cares for the masses not exploits them (the disparity between the poor and rich is rhe highest it is has ever been), and so on. This requires a gentle transformation with no enemies at all, to create a truly sustainable, vibrant and equitable world. Energetic engagement is a good cure for depression I find, and I find my depression only stems from thinking that no else will do it, but this situation cuts through all known previous possibilities and the choice is everyone together or no one at all, so fighting is futile and thus all that is left is coming together with purpose. And if you now feel that the time of change is now then change for then those around you will be more likely to change in greater and greater numbers as the reality crystalises in the collective consciousness of the world that global warming is the most serious threatening event to human civilization we have faced and at a time when life on earth is amidst a mass extinction event also caused by us (what does happen to the toxins produced by making PV panels????) We also plough billions into the wars for resources yet shouldn't we putting all our resources (everyone included) into the real war, the war to keep global warming within our adaptative capabilities, and not the wars to secure oil and inequitable wealth? Shoudln't we be planning for mass migrations, New York needs relocating as does, Tokyo, Lagos etc....?? Can't we make a problem into solution, with natural building materials and salvage, New York could be re-built elsewhere (albeit without highrises), and create a productive carbon sequestering prodcutive eco-system within its boundaries and lock tonnes of carbon into the walls of its buildings and how much active employment is that? Can't we all to come together, forget judgemental predjudices (Muslims, Christians, racial groups etc), willingly stop excessive consumption, care that we are all humans, and share any excesses willingly? And if all that seems like impossible rhetoric then maybe but the choice here is at last try or global warming will definately be unpleasant and all inclusive, and how foolish would we feel then, knowing we were pre-warned and did nothing or the wrong thing trying to maintain the power addiction we have? -
Cornelius Breadbasket at 19:29 PM on 21 November 2012Wigley and Santer Find the IPCC is too Conservative on AGW
What I mean is "very likely" is scientific jargon, and misleading in the wrong hands. -
Cornelius Breadbasket at 19:27 PM on 21 November 2012Wigley and Santer Find the IPCC is too Conservative on AGW
dana1981 @ 7. There is a difference between intelligent and educated ;) -
Kevin C at 19:20 PM on 21 November 2012Wigley and Santer Find the IPCC is too Conservative on AGW
And here's another one: link. I've plugged this at Real Climate, but it has received no attention, probably because it's by econometricians and published in a stats journal. But it is a completely empirical approach. -
Doug Hutcheson at 18:52 PM on 21 November 2012Newsflash: A 4°C warmer world can, and must be, avoided - World Bank
jimb @ 1, That talk is a "must listen". I have just sat through all 59 minutes of it and can confirm it has cleared the fog from my understanding of where we are and where we are likely to be by 2050. It is a real wake-up call to those of us who already see AGW as a threat to our future. Although Dr. Anderson finishes on an optimistic note, I was not comforted. If all countries achieve the CO2 targets they are aiming at, we are headed for the diabolical future of at least 4oC warmer world, at which level it looks bad for organised human society. (Sorry about the layout - it looks as though sub /sub and sup /sup tags are not working ...) Good thing I am already on anti-depressants ... -
Doug Hutcheson at 17:33 PM on 21 November 2012Climate's changed before
JasonB @ 330, I have followed both your links with great interest. I am not a scientist, but my reading comprehension may be just about up to the task of understanding the pdf, if I filter it through enough red wine. The subd_zone.htm page is fascinating and, boy, has it expanded my vocabulary! Ultramafic, diapirs, amphiboles: I'm just dying to casually drop a few of those into a conversation some time. "8-) -
Doug Hutcheson at 17:00 PM on 21 November 2012Newsflash: A 4°C warmer world can, and must be, avoided - World Bank
Will Mankind wake up before it is too late?
From polls recently, it seems about half of us are awake and the other half have hit the snooze button on their alarms. That half are being wooed back to sleep by voices soothingly whispering "Don't worry - there is plenty of time, and anyway the alarm is a hoax." Will enough people wake up to tip the balance in favour of effective action, before it is too late? Just because we did it with CFCs and DDT does not mean much, because the cause and effect in each case was close enough in time for the problem to be visible to even the sleepiest. Not enough people live near the Arctic to see what is happening here and now and the voices of those that do see it are being drowned by the sound of snoring. AGW cause and effect are so far apart in time that the sleepyheads cannot see the problem. We continue to advocate change to avoid a future hazard, not one that is clear to the misinformed. Will mankind wake up? Yes. Before it is too late? I doubt it. Our species will get the future it deserves, one way or the other. -
JasonB at 16:59 PM on 21 November 2012Climate's changed before
Doug H, Completely off-topic for this post, but related to the subject of Richard Alley's video: I recently came across research that showed that some subducting plates may make it all the way down to the bottom of the mantle, literally scraping along and piling up on the core, thousands of km down, because rock is such a poor conductor of heat that they take a really long time to melt. I found this image of plates plunging deep within the earth to be quite fascinating, although I can't remember where I read it now. I just did a quick search and turned up this paper: http://www.es.ucsc.edu/~ahutko/Publications/HLGR_Nature_2006.pdf Look at figure 4 in particular. As Richard Alley's song indicates, and this page confirms, the volcanoes above subduction zones are not actually emitting the melted plate (as I had assumed) but rather magma that has melted due to the water being carried down by the melting plate. -
Doug Bostrom at 15:28 PM on 21 November 2012Climate's changed before
JasonB:Three other witnesses aren't sure what they saw and even disagree with each other on what happened, but all agree it couldn't have been murder because that would require the state to raise taxes to employ a police force and one objects strenuously to the 97 others being so certain of what they witnessed.
Touché. -
jimb at 14:38 PM on 21 November 2012Newsflash: A 4°C warmer world can, and must be, avoided - World Bank
I listened to Dr. Kevin Anderson's talk, "Real Clothes for the Emperor" and he seemed quite convinced that restricting the temperature rise to 2 degrees C was pretty well impossible. He seemed to make some good points. His presentation is available in many places, including here; http://climatesoscanada.org/blog/2012/11/19/watch-kevin-anderson-real-clothes-for-the-emperor-nov-6-2012-lecture-at-bristol-university/ My appologies for the clumsy link. -
Doug Hutcheson at 13:20 PM on 21 November 2012Climate's changed before
JasonB @ 327, That is an extraordinary piece of teaching. A 3 minute video I will remember for a long time. I've even emailed the link to my family, so they can all enjoy it. If only science had been this much fun at school, my career path would have been very different. Thanks for posting it. -
JasonB at 12:51 PM on 21 November 2012Climate's changed before
Composer99: You are right, initially I took the large gap before the last two paragraphs as a "quote delimiter" but afterwards it occurred to me that it might still be part of the quote and checking the page at the URL given confirms this. Sorry Bill. Looking at what was written on that page, someone has clearly gone to a lot of effort to put together an argument that a little more effort on research would have told them was attacking a strawman. Even a cursory examination of the IPCC reports shows that mainstream science is well aware that "other factors besides atmospheric carbon influence earth temperatures and global warming" because it even quantifies those other factors in the attribution analysis! That mistake then leads to the erroneous conclusion that all that's required to disprove AGW is to show that other factors must have also influenced climate in the past. The underlying logic is the same as "Lightning has caused fires long before man came along, therefore arson doesn't exist". Or, "murder doesn't exist because people have died of natural causes in the past", used by the defence in a murder trial where the accused was seen by 97 witnesses standing over the body of the victim with a bloody knife in his hand shouting "I'm glad I killed the bastard!". (Apologies to BlackAdder...) (Three other witnesses aren't sure what they saw and even disagree with each other on what happened, but all agree it couldn't have been murder because that would require the state to raise taxes to employ a police force and one objects strenuously to the 97 others being so certain of what they witnessed.) Doug H: If you liked the talk, be sure to check out Ring of Fire. :-) It's hard to reconcile the reality of a funny, geeky climate scientist with the portrayal of them by commentors on sites like WUWT and Climate, Etc. -
Doug Hutcheson at 12:01 PM on 21 November 2012Climate's changed before
JasonB @ 324, Thanks for the link to Richard Alley's talk. He has a great way of making a 45 minute lecture seem to short. What a great teacher. -
Flakmeister at 11:37 AM on 21 November 20122012 SkS Bi-Weekly News Roundup #1
Re: Vroomie Much appreciated, I just celebrated my 6th anniversary at the Drum. Any serious student of Peak Oil has passed through the site. The commentators were guilty of predicting a "fast crash" and that is not being bourne out. They underestimated "The Last Magician of Modern Monetary Theory", i.e. printing a few trillion dollars to throw into a deflationary death spiral can buy time. Personally, I think that we are are on the wrong side of the Event Horizon, in a large part because of Peak Oil... As for AGW, I was never a real skeptic, I just never appreciated how fine the line was upon which our dear species traipses through our existence... I also think that the solution to Fermi's Paradox is now evident; can a technological society overcome the fossil fuel transition and their variation of climate change? Every star warms as it ages, therefore a GHG richer environment is necessary for a liquid water planetary biosphere earlier on. It seems like it is therefore guarenteed for a planet to have more fossil fuels than which it can safely burn... -
Composer99 at 11:37 AM on 21 November 2012Climate's changed before
JasonB: An excellent explanation. That said, I would be careful in attributing too much of Kiwi Bill's comment as his own. As he notes, he is extracting a commentary from a site (in this case, geocraft) and unless I am mistaken, everything after the line "From: (website link)" is from geocraft. (Correct me if I am wrong, Kiwi Bill.) -
JasonB at 10:47 AM on 21 November 2012Climate's changed before
Kiwi Bill, You need to be very careful comparing much earlier times to today because physics tells us that solar output was much less. In fact, the prediction by physics that the sun was much cooler before yet the geologic evidence showed liquid water on Earth was known as the "Faint Young Sun Paradox" which is resolved precisely by noting that CO2 levels were higher then. In other words, the Earth's temperature is a consequence of all forcings acting on it, and if the solar irradiance is less then higher levels of CO2 are required to maintain temperatures similar to today. The next question is what happy coincidence was it that caused the Earth to always seem to gravitate towards a certain range of temperatures, rather than e.g. stay stuck in a snowball Earth forever or boil away the oceans? Why were CO2 levels just the right amount higher then to maintain liquid water on Earth? The explanation is absolutely fascinating to me, and explained exceptionally well by Richard Alley in this thoroughly entertaining talk. Essentially, CO2 acts like a thermostat, automatically adjusting its levels to maintain "nice" conditions on Earth over geologic timescales. When temperatures are too low, ice sheets form, covering the rock -- the same rock that normally CO2 would react with to form carbonates. Since the rock is covered by ice, and CO2 is emitted by volcanos, CO2 levels rise until the greenhouse effect is strong enough to melt the ice, expose the rock, and start reacting with the rock like crazy, bringing CO2 levels down again. Conversely, if CO2 levels are too high, the rate of rock weathering increases because it is a temperature-dependent reaction. Since the injection of CO2 by volcanos is roughly constant over long periods of time but the removal of CO2 by rock weathering increases with temperature, this acts to bring CO2 levels down and therefore lowers the temperature. This means that our current massive increase in CO2 will ultimately be corrected by the system but unfortunately it operates on long timescales (compared to what's important for humans) so it doesn't help us with our current problem. Anyway, watch the video because Richard Alley explains it in much more detail and more entertainingly than I could!Clearly, other factors besides atmospheric carbon influence earth temperatures and global warming.
Of course, climate science has always said that, which means your comment "According to greenhouse theory, Earth should have been exceedingly hot" is not correct because "greenhouse theory" is precisely what explains why the temperatures were what they were then despite the fainter sun. The reason for the focus on CO2 today (and to a lesser extent, other greenhouse gasses) is because they are the main factor influencing the change in Earth temperatures in the recent past. If you look at the official explanation for the early 20th century warming you'll see that much of that is put down to an increase in solar irradiance at that time. If there had been a further increase in solar irradiance in the last 50 years then the temperatures would be even higher and the IPCC reports would have apportioned a greater share of the recent temperature rise to that increase. The fact is, however, that over the last 50 years or so it just happens to have been CO2 that is responsible and, luckily, this is one forcing that we can do something about because it was us that lead to that increase in forcing -- without our CO2 emissions the temperature would have cooled slightly over the last 50 years. -
Kiwi Bill at 09:53 AM on 21 November 2012Climate's changed before
As a scientifically ignorant person, and too old to be trained, could I ask if some of you clever chaps could tell me what is wrong with the picture contained on the following site. It purports to show that despite CO2 levels which were often very much higher than at present, temperatures on the planet stabilised around 22C for most of the planet's geological history, with only three 'relatively' short periods, including the present, when temperatures dropped to current levels. The table included on this site is entitled: "Global Temperature and Atmospheric CO2 over Geologic Time". It has a note following saying: "Late Carboniferous to Early Permian time (315 mya -- 270 mya) is the only time period in the last 600 million years when both atmospheric CO2 and temperatures were as low as they are today (Quaternary Period )". The table is allegedly sourced as follows: " Temperature after C.R. Scotese http://www.scotese.com/climate.htm CO2 after R.A. Berner, 2001 (GEOCARB III) " Please don't ask me to study every thread on every page to find out for myself. That would be a bit like saying no-one should make even an implied comment on a subject unless they know every little detail. From: http://www.geocraft.com/WVFossils/Carboniferous_climate.html ------------------------------------------------------- Similarities with our Present World ------------------------------------------------------- Average global temperatures in the Early Carboniferous Period were hot- approximately 20° C (68° F). However, cooling during the Middle Carboniferous reduced average global temperatures to about 12° C (54° F). As shown on the chart below, this is comparable to the average global temperature on Earth today! Similarly, atmospheric concentrations of carbon dioxide (CO2) in the Early Carboniferous Period were approximately 1500 ppm (parts per million), but by the Middle Carboniferous had declined to about 350 ppm -- comparable to average CO2 concentrations today! Earth's atmosphere today contains about 380 ppm CO2 (0.038%). Compared to former geologic times, our present atmosphere, like the Late Carboniferous atmosphere, is CO2- impoverished! In the last 600 million years of Earth's history only the Carboniferous Period and our present age, the Quaternary Period, have witnessed CO2 levels less than 400 ppm. Global Temperature and Atmospheric CO2 over Geologic Time Late Carboniferous to Early Permian time (315 mya -- 270 mya) is the only time period in the last 600 million years when both atmospheric CO2 and temperatures were as low as they are today (Quaternary Period ). Temperature after C.R. Scotese http://www.scotese.com/climate.htm CO2 after R.A. Berner, 2001 (GEOCARB III) Compare Oxygen (O2) concentrations. See an estimate of CO2 concentrations over the past 15,000 years, based on plant stomata. There has historically been much more CO2 in our atmosphere than exists today. For example, during the Jurassic Period (200 mya), average CO2 concentrations were about 1800 ppm or about 4.7 times higher than today. The highest concentrations of CO2 during all of the Paleozoic Era occurred during the Cambrian Period, nearly 7000 ppm -- about 18 times higher than today. The Carboniferous Period and the Ordovician Period were the only geological periods during the Paleozoic Era when global temperatures were as low as they are today. To the consternation of global warming proponents, the Late Ordovician Period was also an Ice Age while at the same time CO2 concentrations then were nearly 12 times higher than today-- 4400 ppm. According to greenhouse theory, Earth should have been exceedingly hot. Instead, global temperatures were no warmer than today. Clearly, other factors besides atmospheric carbon influence earth temperatures and global warming. -
scaddenp at 09:23 AM on 21 November 2012Wigley and Santer Find the IPCC is too Conservative on AGW
So things you can estimate reasonably well is FF consumption, BC signatures etc in pre-satellite era. Have to derive aerosol from this. see for example this one but following citations etc, you will find a rich literature. For what the forcing used by the GISS group are derived from then, follow the literature trail from Hansen et al 2007, "Climate simulations for 1880-2003 with GISS modelE." You might also be interested in a completely alternative approach (straight curve-fitting of forcings) in Benestad and Schmidt 2009 for the 45-75 dip. I dont see how you leap to "they affect the accuracy of the model predictions. " from the paper. You have a good predictive climate model, so you play with different forcings to compare their efficiecy on climate change. This allows predictions about the importance of specific forcing - in particular the paper was interested in BC and mathane. I suggest you read the whole paper. It is not about model validation. -
Kevin C at 08:57 AM on 21 November 2012Wigley and Santer Find the IPCC is too Conservative on AGW
Snorbert: It's a good question, and by coincidence I've been digging on this one today, although I certainly don't have a full answer. Gavin at Real Climate would be a better person to ask, but we might be able to get somewhere together. The Skeie et al 2011 papers are probably a good place to start, the first is here and the second is here. The Skeie forcings look as though they contain a rather more pronounced mid-century drop than the Hansen or CMIP5 sets. My current impression is that atmospheric chemistry models of aerosols are developed by chemists (these have nothing to do with climate models) and validated against modern measurements (both satellite and ground based, using microwaves, IR, visual and radar). Given that the aerosol effect show considerable geographical variation, this information can be used in addition to time dependence as a validation criteria. That gives you a lot of validation power. The results are then correlated against known fuel use figures. Fuel use figures from earlier dates (e.g. Bond 2007) are then used to reconstruct aerosol emissions from before the direct observations were available. I've only looked at Skeie, I don't know if other studies have taken different approaches. -
Wigley and Santer Find the IPCC is too Conservative on AGW
Snorbert Zangox - Stratospheric forcings estimated from ejecta mass, from regional optical extinction, and then satellite measures (depending on time period), calibrated against the later and better measured values for all of these, is the best data available. Hence it's the best starting place for investigation. Likewise the tropospheric forcings are estimated from sources on how much fossil fuel was burnt, and where (quite good records there) and model estimates of how that got distributed and it's effects (again, based on modern day dispersal patterns). Again, these are the best estimates available to the modelers. There are uncertainties, and there will always be uncertainties, particularly in historic data. But if you want the best model possible from the data, you start from the best estimates of that data you can obtain. I would suggest further discussion of model development take place on a more appropriate thread, such as here. -
Snorbert Zangox at 08:27 AM on 21 November 2012Wigley and Santer Find the IPCC is too Conservative on AGW
I looked at some of the references in the sources that you provided and found two types of information. One was for example estimates of particle concentrations based on estimates of particle loads from volcanic eruptions (based, I suppose on contemporaneous literature descriptions of the events). I find this somewhat troubling as a source for input data to climate, or any other models. The other appears to be use of the climate models to predict past values for forcing agents. For example I found the following text in Hansen et al. Geophys. Res., 110, D18104, doi:10.1029/2005JD005776. "We use a global climate model to compare the effectiveness of many climate forcing agents for producing climate change. We find a substantial range in the "efficacy" of different forcings . . ." This one I find especially troubling in that it sounds like using the models to estimate the effectiveness of albedo changers based on how they affect the accuracy of the model predictions. Is anyone familiar enough with these estimates to describe how they actually work? -
Daniel Bailey at 07:39 AM on 21 November 2012It's El Niño
It is said that it is only in the act of teaching that an educator can truly become the master of what he teaches. Mastery awaits Mr. Tisdale... -
Wigley and Santer Find the IPCC is too Conservative on AGW
Snorbert Zangox - See, for example, the GISS model forcings. These include the references and data for tropospheric and stratospheric aerosols as used in their model. I suggest looking at those references for an overview. Other models and scenarios will have similar sources, although the details will of course vary. -
It's El Niño
As an addendum, Tisdale should also look at John Nielsen-Gammon's analysis, which clearly shows grouped El Nino, La Nina, and ENSO-neutral years all trending upwards in temperatures over the last 50 years. This can hardly be the result of (as Tisdale claims) one or two decades of El Nino heavy ENSO activity.
-
Snorbert Zangox at 07:26 AM on 21 November 2012Wigley and Santer Find the IPCC is too Conservative on AGW
Tom Dayton and Composer99. I understand, in general terms, how the models work; qualitatively they work the same way that the parameterized models commonly used in calculation of flow in pipes work. That is construct a model that contains the appropriate factors, then conduct measurements to define values for the various parameters included with the term for each important factor. My question is how did the modelers find values for the concentrations and particle size distributions of the particles in the air between 1945 and 1975? These parameters, among others, are critical as Composer99 noted, if one is to calculate the albedo change attributable to particle concentrations. -
DSL at 07:09 AM on 21 November 2012It's El Niño
What an excellent chance for Bob Tisdale to argue a specific point and potentially advance the science. Come on, Bob. I'd like to hear your ENSO argument without the heavy sauce of rhetoric. Surely there are at least a few people here who can understand the dynamics as well as you. Surely you're capable of explaining it to the less gifted of us, no? You can preach to the choir all day long at WUWT, and all you'll get is blank-eyed head nodding. Here you have the chance to convince the unconvinced, to put your argument to the test of fire, and to engage in the perfectly healthy behavior of getting feedback from the community. Surely SkS can set up a forum for extended dialogue on a specific issue or two (say ENSO and SST in general or OHC?). I really respect Pielke Sr. more now for wading into the thornbush and having his say. It's refreshing when the discussion isn't rhetorical cruise missiles lobbed from thousands of km away but is instead look-me-in-the-eye-and-tell-me-I'm-not-human dialogue, and I think SkS is the best place for a rhetorically toned-down discussion of the issue: wide reach (continually referenced across the mainstream news network) and a relatively effective comments policy. -
Composer99 at 06:52 AM on 21 November 2012Wigley and Santer Find the IPCC is too Conservative on AGW
Further to Tom's point, since models are physics-based, they should be (and indeed, to my knowledge, are) able to account for cooling periods with known factors (in the 1945-1975 case, the dramatic increase in the aerosol load in the atmosphere) without any "correction factor" whatsoever. While our knowledge of the pertinent physics is currently very good, and improving continuously, it is still not 100% so I would not expect any model to 100% accurately hindcast past temperatures. -
Tom Dayton at 05:55 AM on 21 November 2012Wigley and Santer Find the IPCC is too Conservative on AGW
Snorkert Zangox, first we need to make clear that the models are not simply "corrected" until their temperature outputs match observations. Instead, the modelers notice mismatches between hindcasts/forecasts and observations, then use those as clues to guessing which aspects of the physical models are responsible for those particular mismatches. Then the modelers use independent physical evidence to improve those aspects of the physical models. Finally they run the models again to see if the mismatches have been reduced. Sometimes that helps, sometimes it doesn't and it can even make the mismatch worse. (If a now-improved aspect's error previously was compensating for some other aspect's error in the opposite direction.) -
Snorbert Zangox at 05:42 AM on 21 November 2012Wigley and Santer Find the IPCC is too Conservative on AGW
Will someone please describe to me how the modelers devised the correction factors to their models that accommodate the cooling that we saw between ca 1945 and 1975? Thanks. -
Bob Lacatena at 05:21 AM on 21 November 2012It's El Niño
I'm still waiting for someone to cogently present Tisdale's case (without charging for it). -
vrooomie at 04:56 AM on 21 November 20122012 SkS Bi-Weekly News Roundup #1
Flakmeister@6: As a geologist, who's fairly familiar with the peak oil rationale, your thoughts are quite illuminating, and WAY shorter and to the point than almost any I've seen, even on The Oil Drum. Though I am almost always about being as positive as possible, let me add this much to your last sentence, and this is a position I've held since the early days of using 'corn squeezin's' to augment liquid vehicle fuels: Food-as-fuel is an utterly and totally irrational, immoral, and *stupid* use of inputs as ever there was. It *only* exists because of the monied interested (read: large agribidness welfare, aided and abetted by stupid gummint policies), the evidence of which I see, quite literally, on a daily basis as I live surrounded--to the tune of 30K+ acres--by the stuff. In a world where food shaortages exist, it ought to be outlawed. Bottom line is, the peak oil hypothesis hasn't gone "up in flames:" it has simply been shown to be a hypothesis that has added data, and therefore, becomes a newer, better-supported hypothesis. We *will*, one day, run out of petroleum: I'm not sure we'll survive that long, if current studies are anywhere clsoe to correct, vis-a-vis global temperature rise. Now, Dikran Marsupial will likely moderate me because, as he has stated on a prior occassion, of me "holding back." >;-) -
dana1981 at 04:53 AM on 21 November 2012Wigley and Santer Find the IPCC is too Conservative on AGW
On a related note, in a new blog post today, Judith Curry criticizes UCAR's Michael Morgan for agreeing with the IPCC's global warming attribution statement, apparently because she believes the too-conservative statement is too confident (shades of the Uncertainty Ewok). In the same post she also reveals that she thinks we can improve climate model projections by improving weather predictions, among other face-palm comments. -
Composer99 at 02:43 AM on 21 November 2012It's El Niño
KR: I believe there is only one appropriate response to Tisdale's claim with respect to Skeptical Science & its contributors' ability to "fathom the subject matter" regarding his confusion surrounding ENSO and climate forcings. -
dana1981 at 02:19 AM on 21 November 2012Wigley and Santer Find the IPCC is too Conservative on AGW
Cornelius - it seems to me like the IPCC was assuming its audience is intelligent by assuming they could equate "very likely" with "greater than 90% probability" without having to spell it out. Though they probably would have saved themselves some headaches by just spelling it out each time. -
It's El Niño
Tisdale has now stated that "No one from SkS will never be able to find any flaws, because they very obviously can’t fathom the subject matter." Hmmm - claims that nobody can fathom your understated brilliance? Regarding a blog theory contradicted by historic observations (long term neutral average of ENSO), current observations (TOA spectral changes in GHG absorption that demonstrate GHG causation, not ENSO), and basic thermodynamics (claiming atmospheric warming comes from recent excess of El Nino's over La Nina's, yet the oceans are warming too - where does all that energy come from)? All of which has never been discussed or examined in the peer-reviewed literature, by those who study this data? Let alone the issues with his "evidence" lacking any connection to statistical significance... I was actually rather surprised to find that claims of "nobody can fathom my subject matter" isn't part of the Crackpot Index; it really belongs there. Ad hominem fallacies aside - if you cannot explain your theories well enough to be understood, you probably don't understand them yourself. --- Kayell / Kristian - In answer to your original question, 'theories' such as Tisdale's have no place in a scientific discussion - beyond noting that they don't hold up to examination. -
Cornelius Breadbasket at 22:10 PM on 20 November 2012Wigley and Santer Find the IPCC is too Conservative on AGW
perseus @ 6. I rely on the scientists on this site to do the data collection and number crunching but I do know about communication. The IPCC missed a trick by using the phrase "very likely". If they had used the phrase "greater than 90% probability" they would have been far clearer, more accurate and less condescending. In my experience is is essential to understand that your intended audience is intelligent, something that this site does brilliantly.
Prev 1022 1023 1024 1025 1026 1027 1028 1029 1030 1031 1032 1033 1034 1035 1036 1037 Next


