


 Arguments


Recent Comments
Prev 1044 1045 1046 1047 1048 1049 1050 1051 1052 1053 1054 1055 1056 1057 1058 1059 Next
Comments 52551 to 52600:
-
Bob Loblaw at 03:02 AM on 19 October 2012What Role Did the Arctic Storm Play in the Record Sea Ice Minimum?
Clarification: when I say "the loss rates are on the low side of normal" and "as low as or lower than most previous years" in the above comment, I'm writing from a mathematical perspective where more negative numbers are lower on the graph. As the graph uses positive numbers for gains and negative numbers for losses, lower points on the graph actually represent a greater loss rate - so much of this season shows loss rates that exceed past years. The 2007 record was destined to be history long before the August 2012 storm. -
Bob Loblaw at 02:41 AM on 19 October 2012What Role Did the Arctic Storm Play in the Record Sea Ice Minimum?
Bratisla @ 9 asked about providing a graph of rate of sea ice loss. I did so in late August/early September, in this comment on a post by Neven. The graph shows changes in sea ice extent from the JAXA data, smoothed with a 5-day running mean. Here is the graph again: The August storm is the precipitous loss around day 220. Note that there was also a huge loss around day 160 - roughly two months before the storm. Generally, the loss rates are on the low side of "normal". Clearly, the August storm did affect loss rates, but clearly other factors were in play, too - much of the season prior to the storm shows loss rates as low as or lower than most previous years. Note that 2007 also had a similar minimum (greatest loss) around day 185 - so the August 2012 storm was not unprecedented in causing huge losses.
I've kept watching the data in this manner - the rest of the season has nothing remarkable, so I won't try to post another version of the graph with the updated data. Readers that wish to do so can find links to the data at Neven's blog (or retype the url given on the graph).
To use a baseball analogy, the melt and conditions earlier in the season loaded the bases - the storm was the clean-up batter that hit the Grand Slam home run. After that, the defence crumbled and the batting team just kept getting run after run after run. Although the one pitch that was hit out of the park was significant, you can't blame the blowout on that single factor.
The fake skeptic's claims that everything is normal, other than the August storm, is just bunkum.
The August storm is the precipitous loss around day 220. Note that there was also a huge loss around day 160 - roughly two months before the storm. Generally, the loss rates are on the low side of "normal". Clearly, the August storm did affect loss rates, but clearly other factors were in play, too - much of the season prior to the storm shows loss rates as low as or lower than most previous years. Note that 2007 also had a similar minimum (greatest loss) around day 185 - so the August 2012 storm was not unprecedented in causing huge losses.
I've kept watching the data in this manner - the rest of the season has nothing remarkable, so I won't try to post another version of the graph with the updated data. Readers that wish to do so can find links to the data at Neven's blog (or retype the url given on the graph).
To use a baseball analogy, the melt and conditions earlier in the season loaded the bases - the storm was the clean-up batter that hit the Grand Slam home run. After that, the defence crumbled and the batting team just kept getting run after run after run. Although the one pitch that was hit out of the park was significant, you can't blame the blowout on that single factor.
The fake skeptic's claims that everything is normal, other than the August storm, is just bunkum.
-
Fabiano at 02:31 AM on 19 October 2012The Future We All Want
Hi Doug! Well According to the National Laboratory of the U.S. Department of Energy, Office of Energy Efficiency & Renewable Energy, Solar Water Heaters (SWH) can reduce both energy consumption and carbon dioxide emissions. The document is available here: http://apps1.eere.energy.gov/buildings/publications/pdfs/ush2o/48986.pdf -
vrooomie at 02:28 AM on 19 October 2012What Role Did the Arctic Storm Play in the Record Sea Ice Minimum?
Sph@16, this all brings to mind a thought process I've had brewing, for a bit: We need to creater a new taxon, and taxonomic terminology, to these threads. I'll start the ball rolling: I'm sure the brain trust will polish it better. "Ostrichus climata minimus." On topic; yea, you, and all the other prevaricatin', gravy-train-entrained, conspiratorial, and lyin' *scientists* seem to agree. We did it. It's getting worse. It's not likely to get better anytime soon. I've long ago reached my "Oh, shit!" moment: this years Arctic news just bumps that button harder. Next year is going to be *verrrrry* interesting. -
DSL at 02:23 AM on 19 October 2012What Role Did the Arctic Storm Play in the Record Sea Ice Minimum?
Of course, the ultimate silliness will occur when a big storm arrives when there is no sea ice in September: "Storm prevents sea ice from recovering! If looked at in just the right way, using a 14th order polynomial extrapolation, we can see that extent was set to expand to 30 million km2 by early October! The alarmists keep saying that the planet is warming, but it's really just these pesky storms. What idiots!" -
dana1981 at 02:06 AM on 19 October 2012What Role Did the Arctic Storm Play in the Record Sea Ice Minimum?
It's obviously impossible to answer the question 'would there have been a record minimum if not for the storm?'. My guess is that yes, there would have been, because prior to the storm the sea ice was already declining at roughly the same rate as in 2007, and the ice is thinner than it was 5 years ago. Plus I find it hard to believe that one storm could make a three quarters of a million km difference in the ultimate minimum extent. But as I said, there's no way of knowing, and as Albatross said, the only reason the storm made a significant difference was because the ice was already in such poor shape due to the long-term AGW trend. -
Albatross at 01:51 AM on 19 October 2012What Role Did the Arctic Storm Play in the Record Sea Ice Minimum?
Thanks for the comments. It is odd that some people are having trouble joining the dots when it was all laid out very clearly in the main post. That fake skeptics would try and use the storm as a scapegoat to deal with their cognitive dissonance was predicted by Gareth Renowden on 12 August 2012, not to mention in the introduction to this very post, yet here they are still trying. Gareth said: "It will be claimed that it was all caused by the major Arctic storm that hit in August, and thus can’t be attributed to global warming." This blog post clearly demonstrates that ordinarily(i.e., before anthropogenic global warming initiated this paradigm shift in the Arctic system unseen for millennia) such a storm would have been a non-issue. But, because the ice is so thin, so emaciated, as a result of the rapid warming over the Arctic (most of which is because of anthropogenic warming), this storm did play a role. However, we cannot magically go back in time and remove the storm and then watch how things would have unfolded thereafter. What we do know is that even before the storm struck, the ice was in trouble, despite unfavourable conditions for ice loss. So to ask what would have happened if it were not for the storm is a rhetorical question and as such cannot be answered. To ask that is just looking for excuses as was predicted fake skeptics would do. And lest we try and fool ourselves into thinking that it is "only" the Arctic ice that is in trouble. Greenland experienced a record melt season this past summer, and that was before the melt season was even over: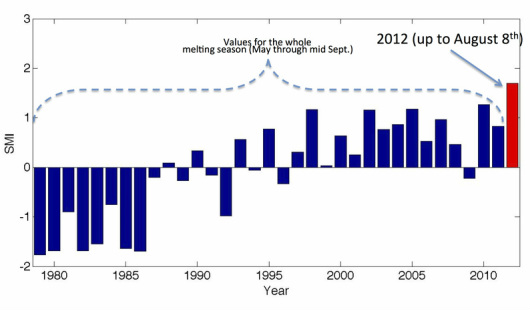 Caption: Standardized melting index (SMI) for the period 1979 - 2012. [T]he years between 1979 and 2011 use the full length season (May through September) where 2012 uses only the available period May through August 8th. Note that 2012 value is much higher than any of the previous years, despite the shorter period. [Source]
Also, the June snow cover over the N. Hemisphere (when the albedo feedback would be greatest) continued its steep downward trend in 2012.
Caption: Standardized melting index (SMI) for the period 1979 - 2012. [T]he years between 1979 and 2011 use the full length season (May through September) where 2012 uses only the available period May through August 8th. Note that 2012 value is much higher than any of the previous years, despite the shorter period. [Source]
Also, the June snow cover over the N. Hemisphere (when the albedo feedback would be greatest) continued its steep downward trend in 2012.
 [Source]
Now putting this all together presents a very coherent and troubling picture. So perhaps it is understandable that some people are in denial.....
[Source]
Now putting this all together presents a very coherent and troubling picture. So perhaps it is understandable that some people are in denial.....
-
DSL at 01:15 AM on 19 October 2012What Role Did the Arctic Storm Play in the Record Sea Ice Minimum?
rugbyguy59, ain't that the truth. Climategate rather convincingly confirmed the proposition that the target audience isn't willing to lift a finger to fact-check. The general situation with climate science communication in mass media strongly suggests that there are no consequences for lying outright. I'm all for limiting the possibility of mis-quoting or recontextualizing, but . . . But this is off-topic. The extraordinary feature of 2012 wasn't the August storm. It was the fact that long before August, area (CT SIA, not extent, which is a more consistent but much less meaningful measure) recorded 14 consecutive days of a 60-day total drop over 6 million km2. That means that for fourteen days, the average daily drop for the preceding 60 days was over 100k km2. Only one such day had occurred in the instrumental record prior (in 1985). Until yesterday, area was on a record anomaly streak of 109 consecutive days. 2012 now holds 137 daily anomaly records. 2007 is second with 69. Regardless of the storm, 2012's massive instrumental record record loss of 11,474 million km2 of area (which beat the previous record by over 534k km2) marks it as a milestone melt season.Moderator Response: [Sph: Requested correction applied.] -
Nick Palmer at 00:58 AM on 19 October 2012Misleading Daily Mail Article Pre-Bunked by Nuccitelli et al. (2012)
Another reason to stop our atmospheric levels getting towards 1000ppm. Elevated Indoor Carbon Dioxide Impairs Decision-Making Performance -
Bob Lacatena at 00:44 AM on 19 October 2012What Role Did the Arctic Storm Play in the Record Sea Ice Minimum?
Readers, Dale said:I'm not disagreeing with the downward trend, or the fact that this year would or would not have set a new record. What I disagree with is the assertion in the article that the storm is not responsible for such a large margin.
Which translates as:I'm not disagreeing with the downward trend, or the fact that this year would or would not have set a new record. What I disagree with is
the assertion in the article that the storm is not responsible for such a large marginthat people should pay any attention to that, when they can instead focus on particular details that confuse the issue and distract them from the fact that the Arctic is melting at an alarming rate and there's going to be hell to pay as a result. -
Riccardo at 00:41 AM on 19 October 2012What Role Did the Arctic Storm Play in the Record Sea Ice Minimum?
It's quite easy to convince oneself that 2012 was unremarkable. Fit a 2nd order polynomial (the highest statistically significant order) and look at the residuals. You'll find it well inside the variability of the last decades. (Dashed lines represent plus or minus 1σ and 2σ)
-
Philippe Chantreau at 00:41 AM on 19 October 2012What Role Did the Arctic Storm Play in the Record Sea Ice Minimum?
Dale is grasping at straws so thin that only one hell bent on shielding himself from reality would reach for them. So what if the storm made it a bigger melt? It was still far from the perfect melting conditions of 07. NSIDC was already predicting a new record before the storm. Perhaps it wouldn't have been shattered weeks ahead of schedule but just broken around the normal time of time of the minimum. Big freakin' difference. Arctic sea ice is still on a death spiral beyond any nightmarish scenario imagined by any specialist only 20 years ago. Dream on Dale, reality will catch you, whether you like it or not. -
Bob Lacatena at 00:40 AM on 19 October 2012What Role Did the Arctic Storm Play in the Record Sea Ice Minimum?
Dale, Go ahead and "believe" what you want to believe. It's what you'll do no matter what. Readers are asked to consider that the vacuous nature of Dale's (and other deniers') argument is going to become painfully clear in coming years as the Arctic ice continues to retreat, with or without such storms. And if such storms become more common because of changes in weather patterns that result directly from the retreat of the ice, what then? Obfuscation and distraction is the denier style. There's always someone else or something else to blame. There's always another reason to doubt and hesitate. There's always a reason to shirk action and responsibility. And there's always, always a carefully constructed reason "why," phrased as a seemingly detached, rational question, one that on the surface may seem perfectly reasonable, like "If the storm had not have occurred, would we still have had that minimum ice extent?" It's a question that so cleverly avoids all of the important facts, like that without warming temperatures the storm was irrelevant, or that storms like that have happened before without the same effect, or -- and this is the most important -- that the exact minimum is irrelevant, so whether or not the storm added an X factor is not relevant. The ice is melting. The globe is warming. This is made painfully and unavoidably obvious by each new summer minimum extent. Harping on nonsense like "the storm did it" is just a good way for people (like Dale) to be able to stick their heads in the ground and act like ostriches. A child could see through this one. Really, it's an embarrassment to deniers everywhere that they are getting this stupid with their arguments. -
Philippe Chantreau at 00:33 AM on 19 October 2012Global Surface Warming Since 1995
"Are they not as pure as the driven snow?" Snow is melting pretty fast these days... -
Composer99 at 00:32 AM on 19 October 2012What Role Did the Arctic Storm Play in the Record Sea Ice Minimum?
Dale: Your analogy does not hold up insofar as you are attempting to ascribe a single causal factor (rainfall) to a phenomenon (a multi-vehicle collision) which necessarily has many contributing causes (weather, baseline road conditions, driver behaviour, conditions of the vehicles involved, and perhaps others). For your analogy to hold, it would have to be the case that previous Arctic summer storms had caused unusual sea ice losses despite comparatively stable ice conditions. The OP notes two pertinent points which I think you have failed to overcome in your attempt to name the August storm in the Arctic as the primary causal agent of the record low:In the past, Arctic summer storms similar to the 2012 event did not have a major impact on sea ice extent or September sea ice minimum. [Emphasis mine.] The 2012 record-breaking minimum can be attributed to a number of factors. The summer storm likely played a role, but [the record-breaking minimum occured] primarily because the ice was thinner, weaker, and less extensive to begin with than in prior years due to its long-term human-caused decline. [Emphasis mine.]
These statements from the concluding remarks are backed up with reference to evidence in the body of the OP, whereas your contrary speculation is not. The two items emphasized, taken together, quite clearly refute your attempted argument by analogy. BWTrainer's criticism appears to me to be more on the mark than not. -
Kevin C at 00:22 AM on 19 October 2012What Role Did the Arctic Storm Play in the Record Sea Ice Minimum?
Dale@11: I disagree. While the 750,000km^2 number can be derived from very simple analysis, it ignores all the other information we have about the system. Estimating from 2007, while useful for providing an upper bound, ignores the Cryosat2, PIOMAS and ice age data, all of which indicate that the ice was thinner than 2007. While a naive analysis says a new record was likely, a less naive analysis will give a stronger result. -
What Role Did the Arctic Storm Play in the Record Sea Ice Minimum?
Dale - "If the storm had not have occurred, would we still have had that minimum ice extent?" (emphasis added) If conditions were different, we would certainly have a different minima - that should go without saying, quite frankly. I believe this falls into the category of a rhetorical question, ie. one asked for the purpose of rhetoric. Follow the trends, look at (as others suggested) predictions prior to the storm. It would likely have been around the 2007 minimum, which I'll note occurred with "perfect storm" of variations towards a minima. That's because the trend is downward, the central expectation is dropping severely. If 2007 did not have all the various factors pushing for low ice, we would have expected about 9mk^2 extent as a minima that year. If we had the same factors in play this year as in 2007, all pushing for low ice (as an "all things equal" comparison), this years minima would of course have been considerably lower than it was. -
Dale at 23:31 PM on 18 October 2012What Role Did the Arctic Storm Play in the Record Sea Ice Minimum?
BWTrainer @10 What's with the insult? Is that the only way you can argue? I'm not disagreeing with the downward trend, or the fact that this year would or would not have set a new record. What I disagree with is the assertion in the article that the storm is not responsible for such a large margin. Conditions being ripe for this occur is irrelevant. If a road develops more and more potholes each year and then suddenly one day it rains and there's a major multi-car accident, what caused the accident? The rain of course, not the potholes. -
Dale at 23:24 PM on 18 October 2012What Role Did the Arctic Storm Play in the Record Sea Ice Minimum?
Kevin C @8 There's really no need to go elsewhere, just looking at the graphs in the article leads one to what I would say would be a fairly accurate estimate. With rate of melt similar to 2007, and being so close to the 2007 levels up to the storm, it's not unreasonable to estimate that minimum ice extent would be around the 2007 mark (specially considering no conducive weather for faster melt was recorded, except the storm). Thus for the purposes of this article, with the storm ice melt was 750,000 km^2 more than it should've been. Note here: NASA said they estimated from satellite photos that around 500,000 km^2 of ice was churned and broken up by the storm. Sorry, but I have to disagree with the comment in the article the storm wasn't responsible for the large margin. The other conditions are basically irrelevant, because if those other conditions were the cause of the large margin, then you need to justify that the melt would still have been as it was with the storm. -
BWTrainer at 23:24 PM on 18 October 2012What Role Did the Arctic Storm Play in the Record Sea Ice Minimum?
Reasoning with fake-skeptic Dale tends to be an exercise in futility, but what the heck, this will only take a minute: That this year set every record is of course important, but it misses the forest for the trees. Look at any graph of extent or volume going back as long as records have been kept, and you see a clear and drastic downward trend. Debating whether 2012 would've been the record in the absence of the storm, or "only" the 2nd or 3rd lowest, really obfuscates the issue. -
bratisla at 22:11 PM on 18 October 2012What Role Did the Arctic Storm Play in the Record Sea Ice Minimum?
I will do a naive comment : maybe calculating and showing the daily/5day average rate of loss of sea ice [i]area[/i] and [i]extent[/i] would be useful for the discussion ? From my (limited) understanding, we should see that the storm did not have a very strong impact on sea ice area (ice is covered by water during the storm, thus fooling the sensors, but reappears thereafter) and a stronger impact on extent. I did not do the calculations, nor I am knowledgeable in Arctic sea ice. I did not see anything on neven's blog about loss rates (but I didn't search that hard). Just thinking aloud. -
CBDunkerson at 22:08 PM on 18 October 2012Misleading Daily Mail Article Pre-Bunked by Nuccitelli et al. (2012)
hank_ wrote: "What on earth is a 'fake skeptic'??" Technically, the term 'skeptic' has long been misapplied to the point that 'person who questions' is now common usage regardless of the validity of the 'questions'. However, the original meaning was more along the lines, 'person who questions facts and assumptions to determine the truth'. Thus, people who uncritically accept complete nonsense (e.g. 'global warming has stopped') are not skeptics under the original meaning of the term and when they seek to apply that original, laudatory, meaning to themselves they are being 'fake skeptics'. They are not questioning the facts, but rather latching on to any easily dis-proven lie with which they can shield themselves from the facts. That the term 'skeptic' has been misappropriated by kooks for so long that it now could be taken to mean, 'person who irrationally disputes without factual foundation' isn't relevant as that clearly isn't the meaning the self-styled 'skeptics' are going for. -
Kevin C at 20:56 PM on 18 October 2012What Role Did the Arctic Storm Play in the Record Sea Ice Minimum?
If you are genuinely interested in the answer, head over to Neven's and go through the threads from early August to see what the predictions were - people posted a variety of predictions using a variety of methods. Or check the SEARCH outlooks, which include predictions from experts and amateurs (you may want to weight them by their past reliability, see Dana's review here). Or take the data and make your own hindcast starting from before the storm. It seems to me that volume would certainly have set a new record, and it is more likely than not that NSIDC, CT and Bremen would also have set records even ignoring anything we know about declining thickness and ice age. -
Dale at 20:34 PM on 18 October 2012What Role Did the Arctic Storm Play in the Record Sea Ice Minimum?
scaddenp @6 Sorry, but that's not really an answer to my question. If the storm had not have occurred, what would the minimum sea ice extent be? -
John Russell at 20:31 PM on 18 October 2012Misleading Daily Mail Article Pre-Bunked by Nuccitelli et al. (2012)
Excellent post on the same topic (includes ref to Nuccitelli et al 2012): http://www.wunderground.com/blog/RickyRood/comment.html?entrynum=239 -
Falkenherz at 20:12 PM on 18 October 2012Shakun et al. Clarify the CO2-Temperature Lag
Hi! The previous discussion seems to have trailed off, so I take the occasion to pick up some comments which describe the "basics" from Shakun, namely Daniel#32, Sphaerica#69, for better understanding. The connection seems to be well explained. But how is, according to Shakun, the physics supposed work when warming drops to cooling? He just seems to have covered the warming part? Also, there may be a difference between the time needed for building up icesheet and the time for melting. How does that figure in the explanations? My background, leading to some connected questions: Coming from the article about climate sensitivity, I have read Hansen&Sato 2011, and they produce matching modelled temperature shifts for the ice core data, based on historic estimated albedo and GHG forcing and current "consensus" climate sensitivity. It looks like a perpetuum mobile after the triggering event. So, I am still unconvinced about the role of the forcing from the insolation event. Its local high radiative forcing seems to be ignored, said to be levelled out globally with the opposite happening on the SH. Isn't that a too easy assumption? A strong local heat is created, and because of the GHG heat trapping function, should have contributed to global warming, compared to a corresponding lower cooling down from a much lower heat level on the SH? Are (natural, global) GHG levels really that fast reactive or even faster reactive than changed albedo from (strong, local) ice sheet alterations? The latter for sure do happen first and thus should direct temperature shifts in a much more dominant way, thereby diminishing the role of the feedback of subsequent albedo/GHG (which first apparently need oceanic processes to even start globally). Which would result in a lower climate sensitivity than current consensus. I understand that albedo usually is part of climate sensitivity, but the special situation here coupled with local insolation makes it seem to be in the beginning more like a (local) driver, resulting of course in more subsequent albedo/ghg/climate feedback. Maybe I stop here, sorry if questions are a bit unsystematic, I am still confused on how things are supposed to play together. I would be happy for some short and clear explanations on my question marks, if possible. -
scaddenp at 17:46 PM on 18 October 2012What Role Did the Arctic Storm Play in the Record Sea Ice Minimum?
Dale, like extreme weather, AGW loads the dice. A good storm could have happened last year and produced similar result. The continued warming means multi-year ice is gone so each bad summer chips away at it. Will next year be lower yet? Probably not. But another big low will happen the next time the weather dice throw bad. Just like you can bet that the next record breaking global temperature will happen with an El Nino rather than in a La Nina year. -
Doug Bostrom at 17:18 PM on 18 October 2012The Future We All Want
Solar domestic hot water is the poster child example of how feckless we are in our energy habits in the United States. Point your browser to the following Google Maps link and cruise around. The location is Sun City, Arizona. Take a look at the rooftops. What's missing? What's under the roof of every single one of those dwellings, consuming about 20% of the household energy input? Meanwhile, Arizona's electrical generation capacity is overwhelmingly powered by fossil fuel including substantial coal generating capacity. Water heaters not using electricity as an intermediary between flaming coal and natural gas are just burning gas directly. When we look at Sun City AZ we're looking at a community of recalcitrant cavemen, just one town of thousands, a few hundred households of hundreds of thousands more. This is basically insane. Solar domestic hot water is deadly dull old-school technology, Joe-the-Plumber state of the art. Dollars and watt-hour equivalents are sleeting down from the sky in positively destructive quantities in Arizona and much of the rest of the United States yet we're so slothful and lazy we won't lay our hands out to grasp any of the free stuff. Crazy. Do we want to be losers? Do we deserve to be losers? Sometimes it seems we convey that impression. -
Fabiano at 16:38 PM on 18 October 2012The Future We All Want
Hi Doug! You raised a very interesting point. Thank you! Yes, solar water heating is by far the best option since this system will reduce the emissions of greenhouse gases. Coal is the main source of energy in Australia as far as I know which is a problem of major concern. Anyhow modern electric tankless water heaters are very efficient in terms of energy consumption and their units do not emit greenhouse gases. -
Dale at 15:56 PM on 18 October 2012What Role Did the Arctic Storm Play in the Record Sea Ice Minimum?
After reading the article I still have this question: If the storm had not have occurred, would we still have had that minimum ice extent? -
Doug Hutcheson at 15:48 PM on 18 October 2012Global Surface Warming Since 1995
Shock! Horror! Andrew Bolt and the Murdoch Empire caught misrepresenting the truth! Who would have thought it? Are they not as pure as the driven snow? Are they not so far above us that their pronouncements should be meekly accepted by the inferior rest of us? This is the most humble day of my life. -
dana1981 at 15:47 PM on 18 October 2012What Role Did the Arctic Storm Play in the Record Sea Ice Minimum?
Doug @3 - thanks, fixed. YubeDude @1 - there's not much we can do about climate deniers quote mining, as we saw during Climategate. All we can do is put the quotes in the proper context when that happens. -
matthewsmar@gmail.com at 15:08 PM on 18 October 2012Global Surface Warming Since 1995
And Yet... Andrew Bolt (Herald Sun Thur 18 Oct "Theory Grows Colder") continues to use this as proof that the "warmists" are wrong -
Doug Hutcheson at 13:56 PM on 18 October 2012What Role Did the Arctic Storm Play in the Record Sea Ice Minimum?
Very interesting to see how all the factors interact. [pedantry]The large swells caused the breakup of large (>1 km) multi-year ice flows up to 5 meters thick, into much smaller flows (100-150 meters).
I think 'flows' should be 'floes'?[/pedantry] -
rugbyguy59 at 13:37 PM on 18 October 2012What Role Did the Arctic Storm Play in the Record Sea Ice Minimum?
Yubedude, While you've done a great job of illustrating the methods of the denialist mob, I don't think much can be done about it. If you're hoping scientists will or can modify their language to stop people from doing such things, I think it's asking the impossible. About all that can be done is to educate people who are interested in truth and hope enough take interest to spread the word. Truth, especially in complex matters with political implications, is always at a disadvantage. Thanks to Skeptical Science for providing us with so much of what is needed to do the job. -
YubeDude at 12:59 PM on 18 October 2012What Role Did the Arctic Storm Play in the Record Sea Ice Minimum?
What Role Did the Arctic Storm Play in the Record Sea Ice Minimum? Here are a few questions I can’t help but ask that come from the heading: Comments from Arctic Experts NSIDC Director Mark Serreze is quoted as saying, "Apart from one big storm in early August, weather patterns this year were unremarkable. The ice is so thin and weak now, it doesn't matter how the winds blow." How does he qualify “unremarkable” and can he empirically prove that “it doesn’t matter how the wind blows”? You quote SIDC scientist Walt Meier saying, "... Arctic sea ice cover is changing....large areas are now prone to melting out in summer." Isn’t it true that Arctic sea ice has always been a seasonal phenomenon with highs in the winter and lows in the summer? Is it not the nature of ice to go through cycles of melt/freeze, a kind of “changing” as temps rise and fall? Claire Parkinson at NASA Goddard Space Flight Center said, "The storm definitely seems to have played a role in this year's unusually large retreat of the ice.” She appears to disagree, and if there is disagreement between the Arctic Experts… Do you see what I did there? Snip, clip, and disregard the bulk of your offering that details actual science in favor of misquoting Experts who I’ve extracted from context and then asking questions that are plausible yet remain fallacious; questions that give the appearance of being reasonable. The battle is over more than just the facts, science and understanding. After all, I am not trying to convince you or those who do the research and publish the papers; you are all in the minority. I’m going after the hardware store owner who won't check the quote to see if I left something out, the wheat farmer who is great with his hands but not with science text books, and that guy on the subway who reads the WSJ and is worried that his portfolio might take a hit anytime someone suggest AGW is real. Your article is excellent by the way and I appreciate your efforts and synopsis of our current status. -
Doug Hutcheson at 11:34 AM on 18 October 2012The Future We All Want
Interesting that in point 5 they say "Gas water heaters should be avoided as they emit greenhouse gasses". In Queensland, govt. regulations now require gas water heaters: we cannot replace our existing electric system with another electric one. I wonder whether the GHG emissions of a gas water heater (storage type, not on-demand) would be greater than the equivalent electric heater, taking into account generation costs and line losses etc. A solar hot water system with heat-pump backup might be the low emission choice, but not cheap. -
Eric (skeptic) at 05:38 AM on 18 October 2012Misleading Daily Mail Article Pre-Bunked by Nuccitelli et al. (2012)
Dana, his book is very serial. All I have seen so far is hints of solar charging, but nothing quantitative and I have not gotten to an explanation of secular warming while answering Rob's question. -
Nick Palmer at 05:32 AM on 18 October 2012Misleading Daily Mail Article Pre-Bunked by Nuccitelli et al. (2012)
If I might repost this comment I left on the Met office blog? While responding to one of the "climate has always varied and natural variability swamps the CO2 signal so AGW is insignificant" types, I came up with an analogy I haven't seen before which I think might be worth passing on for others to use when trying to communicate the subtleties of the sophistry being used to fool a too credulous public. I already know the analogy isn't exact, but it does have power to communicate an idea... ______________________________________________ “But the climate is always changing” Of course it is! Within limits. So what? Climate changes, and has changed, due to natural forcings and cyclic variabilities. That clearly demonstrates that it reacts to forcings. Sticking a load of buried then re-oxidised carbon back up there is imposing a long lasting forcing on the planet that steadily forces the climate to change. The physics shows that the C02 forcing is much larger than the orbital Milankovitch forcings that send Earth into and out of ice ages over millennia. I see several others have come on here and pulled the old “natural variability swamps any CO2 signal”. Did you all miss the analogy above between waves on a beach and the tide coming in? How hard was that to understand? Another analogy I just made up would be a fat person eating, in aggregate, just 200 calories a day more than their body burns averaged over 20 years. Over 20 years plus they are going to get to be a morbidly obese 600 pounds! How would you all regard the intelligence of someone watching them who said that the person sometimes binged on 5000 calories a day for weeks, then went on a crash diet for weeks and their weight varied by 50 pounds cyclically but that the steady average one ounce a day weight gain from those unburnt 200 calories is totally “swamped” by their natural cyclic variability, so therefore is unimportant? I don’t think that is very smart. Do all you “natural variability swamps the CO2 signal” types agree now? Small cumulative dietary forcings add up to one obscenely fat individual over time. Climate forcings in the SAME direction mean steadily accumulating heat. Binges and diets give a wide CYCLIC variability of weight month to month. Just as natural oscillating climate variations give a wide variety of temperatures over decadal periods. So what? A fatty in denial of reality could easily pick and choose start and finish points to draw trend lines on the graph of their weight to fool themselves into thinking they were losing weight or stable – that they were doing fine – but they would be deluded… -
ljonestz at 03:56 AM on 18 October 2012The Future We All Want
Great to see updates on progress in international & national policy arenas, and dimensions of CC on international development. More of these type of posts please. -
Albatross at 02:48 AM on 18 October 2012Misleading Daily Mail Article Pre-Bunked by Nuccitelli et al. (2012)
Further to my above comment, ironically the article that Curry posts (apparently journal articles are not up to snuff for her to use as support for her claims, instead she is relying on a he-said-she-said reported in the media) to try justify her claim of the "pause", includes a statement that calls out the 1997-1998 El Nino start date (the same one used by Rose) as a cherry pick: "Researchers have long argued that using 1998 as a starting point was, then, unfair. "Climate scientists were right that it was a cherry-picked observation, starting with an El Niño and ending with a La Niña," said Robert Kaufmann, a geographer at Boston University who recently studied the hiatus period.." Ultimately what we have is a global radiation imbalance of about 0.6 Wm-2, and so long as there is an imbalance, the climate system will continue to accumulate energy and warm, not always at the same pace, but physics dictates that on time-scales of 20-30 years it must warm. It is not clear to me that Lean acknowledged the "pause" either. In the quote provided by Curry, Lean is instead speaking to the role of the sun in modulating global temperatures. The author claims that Lean attributes the "hiatus" to the sun, but nowhere does Lean explicitly state that. Also, there is a problem with that reasoning, because there was a solar maximum in 2002-2003, so if the sun were the culprit, one could only attribute a slowdown in temperatures after 2003, not since the 97-98 El Nino. Importantly, the warmest year on record, 2010, was observed when the sun was experiencing an unusually prolonged solar minimum. As per usual the "skeptics" (including Curry it seems) want to everyone to focus on the noise and ignore the long-term and much more important big picture. -
Albatross at 02:23 AM on 18 October 2012Misleading Daily Mail Article Pre-Bunked by Nuccitelli et al. (2012)
Dana @37 and 38, This latest sad saga with Curry would be quite entertaining if this were not such a serious subject. If I were you I really would not be too concerned what someone who is wowed by Salby's misguided ideas or believes David Rose's misinformation articles to be "thought provoking". Perhaps I was too unclear earlier as to what is likely going on here. Curry and Rose have a symbiotic relationship. Rose promotes her and feeds her narcissism, she gives him the sound bites and credibility that he can used to mislead and misinform. I'm beginning to think Curry's indignance about being misrepresented by Rose is a ruse. Additionally, as Dikran Marsupial has accurately noted "Judith Curry demonstrates a fundamental lack of understanding about statistical hypothesis testing". That much is very evident when reading her posts. As for Curry trying to weave Trenberth's, Solomon's and Hansen's comments into her narrative. That is disingenuous on her part, because none of them assumes that the increase in global temperatures will be monotonic, and none of them assumes that periodic slow-downs or plateaus suggest that we are not heading for much discomfort and pain in the coming decades if we continue to increase greenhouse gas levels. What is more, using the Solomon quote is inappropriate because Solomon is talking about a shorter and different period than the period cherry-picked by Rose. Solomon was talking about the role of stratospheric water vapor on modulating global temperatures on a decadal scale, specifically their proposed role of cooling between 2000 and 2009, not 1997-2012. And as The Escalator shows one can easily find short-windows with cooling or no warming because of noise in the climate system. Finally, to my knowledge Hansen has not stated that there has been a significant slowdown. And in that quote Curry provides he does not do so either. In fact, Hansen et al. (2010) challenged Solomon's claim of a slowdown: "On the contrary, we conclude that there has been no reduction in the global warming trend of 0.15 C-0.20 c per decade that began in the late 1970s" If anyone doubts that Hansen is concerned they really should watch this incredible talk that Hansen gave at Ted recently. Curry is playing rhetorical games and misrepresenting her peers' positions by not providing the full context of their positions. That she is doing so is shameful and unprofessional. -
Falkenherz at 02:23 AM on 18 October 2012Climate sensitivity is low
Daniel, I do question about reality, and if reality is reality, I am confident that my questions will be answered. scaddenp, Hansen and Sato 2011 are a very difficult to read for me. If I understand their chapter 5 on the Holocene correctly, they use climate forcings calculated from GHG and sea level changes (=ice sheet approximisations) and apply climate sensitivity "consensus" values and thusly produce temperature curves which match the ice core data. Seeing that there is yet another article which again specializes within more details with regards to my questions on the ice core data, I will move on to the discussion of Shakun e.a., link provided by Daniel#295. -
dana1981 at 02:14 AM on 18 October 2012Misleading Daily Mail Article Pre-Bunked by Nuccitelli et al. (2012)
Eric @43 - I'm curious, what does Tisdale propose caused the "charging of Pacific ocean heat in the 80's and 90's"? My problem with Tisdale's argument is that it kind of ignores basic physics. He made a comment the other day that it's misleading to look at global data as measurements of global warming because that leads to the assumption that greenhouse gases are responsible for some warming. I really can't take him seriously after that. -
funglestrumpet at 01:50 AM on 18 October 2012Misleading Daily Mail Article Pre-Bunked by Nuccitelli et al. (2012)
The point about Rose is that his errors would seem to be deliberate. It may be that he has been unduly influenced by Monckton, who makes a habit of such behaviour. If they are deliberate errors and seeing as they have the result of hindering action to combat climate change, we can deduce that his intention is to harm his country. I think that there is a word for such behaviour, but I forget what it is. I know it begins with a 'tr' and ends in 'eason' but the rest escapes me. -
Bernard J. at 00:21 AM on 18 October 2012Misleading Daily Mail Article Pre-Bunked by Nuccitelli et al. (2012)
Lionel at #44. I remember wincing when I hear Phil Jones say that. My immediate response was to wonder why he didn't say something to the effect of:"There is a 94% chance that the observed planetary trajectory toward warming is not due to random fluctuation: that it is in fact reflecting genuine global warming. With another year's worth of data to discern long-term signal from short-term noise that figure will increase to greater a than 95% chance that the planet is warming."
Moderator Response: [DB] Closed blockquote html tag (H/T to Composer99). -
Eric (skeptic) at 22:59 PM on 17 October 2012Misleading Daily Mail Article Pre-Bunked by Nuccitelli et al. (2012)
Rob, yes, it's more than just "some". I agree with Tisdale that ENSO is not a "cycle" per se, but disagreed that it can cause secular warming before reading his book. When I finish reading it I will try to answer your question. The part that seemed worth mentioning is that ocean heat storage and release is a highly episodic process. IMO AGW simply adds to the storage episode which then adds to the release episode. Storage can span multiple La Ninas, neutrals and even weak El Ninos. -
John Russell at 22:38 PM on 17 October 2012Misleading Daily Mail Article Pre-Bunked by Nuccitelli et al. (2012)
For the record: George Monbiot has, in the past, pulled David Rose up on his tendency to mislead. -
Rob Painting at 22:25 PM on 17 October 2012Misleading Daily Mail Article Pre-Bunked by Nuccitelli et al. (2012)
Eric (skeptic)- "It is accepted science that some AGW is stored in the ocean" Some? 93% since the 1960's isn't what I would characterize as some. As for Tisdale, he has some rather unusual ideas about ocean processes. Given that ENSO has probably been around for millions of years, can you summarize how his hypothesis is supposed to work? -
Lionel A at 21:51 PM on 17 October 2012Misleading Daily Mail Article Pre-Bunked by Nuccitelli et al. (2012)
John Brookes @41 This is the exchange between Phil Jones and Roger Harrabin of the BBC which you have in mind:B - Do you agree that from 1995 to the present there has been no statistically-significant global warming Yes, but only just. I also calculated the trend for the period 1995 to 2009. This trend (0.12C per decade) is positive, but not significant at the 95% significance level. The positive trend is quite close to the significance level. Achieving statistical significance in scientific terms is much more likely for longer periods, and much less likely for shorter periods.
Found here: Q&A: Professor Phil Jones . The fake skeptics (and I recognise Hank_'s handle and MO from posts at DesmogBlog) never mention that 95% significance level or its significance. If the plane they were about to board had a just less than 95% significant probability of crashing would they continue?
Prev 1044 1045 1046 1047 1048 1049 1050 1051 1052 1053 1054 1055 1056 1057 1058 1059 Next


