Climate Science Glossary

Term Lookup

Enter a term in the search box to find its definition.

Settings

Use the controls in the far right panel to increase or decrease the number of terms automatically displayed (or to completely turn that feature off).

Term Lookup

Settings


All IPCC definitions taken from Climate Change 2007: The Physical Science Basis. Working Group I Contribution to the Fourth Assessment Report of the Intergovernmental Panel on Climate Change, Annex I, Glossary, pp. 941-954. Cambridge University Press.

Home Arguments Software Resources Comments The Consensus Project Translations About Support

Bluesky Facebook LinkedIn Mastodon MeWe

Twitter YouTube RSS Posts RSS Comments Email Subscribe


Climate's changed before
It's the sun
It's not bad
There is no consensus
It's cooling
Models are unreliable
Temp record is unreliable
Animals and plants can adapt
It hasn't warmed since 1998
Antarctica is gaining ice
View All Arguments...


Username
Password
New? Register here
Forgot your password?

Latest Posts

Archives

Global Surface Warming Since 1995

Posted on 20 April 2012 by dana1981

Santer et al. (2011) examined modeled vs. observed trends in the temperature of the lower troposphere (TLT) and found that climate "skeptics" generally exaggerate the discrepancy between the two.  Nevertheless, based on University of Alabama at Huntsville (UAH) and Remote Sensing Systems (RSS) data, TLT is not warming as quickly as models expect.  That being said, we don't know if the discrepancy is due to models overestimating TLT, UAH and RSS underestimating it (which is a very plausible possibility), or both.

One key finding from Santer et al. is that we must examine at least 17 years of TLT data to discern a human influence on tropospheric temperatures:

"Because of the pronounced effect of interannual noise on decadal trends, a multi-model ensemble of anthropogenically-forced simulations displays many 10-year periods with little warming. A single decade of observational TLT data is therefore inadequate for identifying a slowly evolving anthropogenic warming signal.  Our results show that temperature records of at least 17 years in length are required for identifying human effects on global-mean tropospheric temperature."

Now that another year has passed, we can include 2011 data in this analysis.  What we find according to UAH, the TLT trend since February 1995 is 0.12 +/- 0.21°C per decade (using the Skeptical Science Temperature Trend Calculator), and according to RSS, it's 0.048 +/- 0.21°C per decade.  Both trends are positive though neither is statistically significant at the 95% confidence level.

Misrepresenting Santer et al.

Nevertheless, despite the preponderance of natural effects acting in the cooling direction over much of this period, both data sets do show a warming trend, albeit not statistically significant at a 95% confidence level.  However, climate "skeptics" have misrepresented the work of Santer et al. to argue otherwise:

"Ben Santer recently published research claiming that a 17-year span is the correct period to measure for CO2's influence on global temperatures...Since January 1995, the HadCRUT global temperature anomaly (the IPCC's gold standard) has declined from January 1995's +0.36° to January 2012's +0.22°. Simply put, there has been no statistically significant warming since 1995. And the linear trend over the past 17 years is a minor +0.6°C impact by 2100AD, if that trend were to continue."

[...]

"Conclusion: Human CO2 emissions have had little impact on global temperatures over the near past, which is why there has been no statistically significant warming since 1995."

This quote misrepresents the work of Santer et al. and has many different problems.

First, the 17-year timeframe applied to TLT, not surface temperatures.  A similar analysis could be applied to the surface temperature data sets, but to cite Santer et al. (2011) and then proceed to discuss surface temperatures is a misapplication of their work, and shows that the "skeptics" have not read or understood their research.

Second, it seems highly ironic that in the wake of the climate "skeptic" attacks on Phil Jones and the University of East Anglia during the "Climategate" email thefts, it now seems as though every single climate "skeptic" reference to temperature data uses HadCRUT3.  More importantly, as we seem to be forced to repeat on a weekly basis recently, HadCRUT3 has a known cool bias and has now been superseded by HadCRUT4.  The "skeptics" are relying on a dataset which has been known for more than 2 years to have a cool bias - this is not true skeptical behavior.  Figure 1 shows HadCRUT4 over the latest available 17 years (1994 through 2010) courtesy of the SkS Trend Calculator.

HadCRUT4 17 year

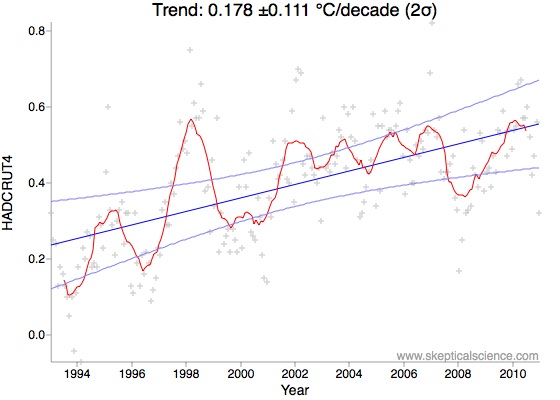
Figure 1: HadCRUT4 linear trend and two-sigma uncertainty for 1994 through 2010

Third, Santer et al. simply said that "temperature records of at least 17 years in length are required for identifying human effects on global-mean tropospheric temperature."  There is no requirement of statistical significance in this comment.  Nevertheless, the trend is statistically significant in HadCRUT4 (Figure 1).

Fourth, even if there were no surface or TLT warming over the past 17 years, that would not be sufficient to conclude that human CO2 emissions have had little impact on temperatures.  Without human CO2 emissions, temperatures would have declined over the period in question.  Solar activity has been down, there has been a preponderance of La Niñas, human aerosol emissions have risen, etc.  The fact that surface temperatures and TLT haven't cooled indicates that there is a warming effect offsetting all of these short-term cooling effects.  

Other Surface Temperature Data Sets

It's also worth noting that according to NASA GISS, the surface temperature trend since February 1995 is statistically significant (0.13 +/- 0.12°C per decade). Also note that the GISS and UAH best estimate trends are virtually identical.  However, according to NOAA NCDC, the trend since 1995 is not statistically significant (0.095 +/- 0.12°C per decade).

What Does 'Not Statistically Significant' Mean?

Climate "skeptics" often conflate "not statistically significant warming" with "no warming," but this is simply wrong. The term essentially means "we can't rule out the possibility that it isn't warming."  However, if you want to argue that there is no warming, then you need a statistical test that rules out the possibility that it is warming, which is a different test altogether.  In most cases with these temperature data sets, the possibility that it isn't warming is a small one.

A More Robust Analysis

Perhaps the best way to avoid conflating short-term noise with the long-term human-caused global warming signal is to filter out that noise, as Foster and Rahmstorf (2011) did.  Using a statistical multiple linear regression approach to remove the effects of the El Niño Southern Oscillation (ENSO) and solar and volcanic acitivity, Foster and Ramstorf revealed the steady underlying primarily human-caused global warming trend (Figure 2).

before/after filtering

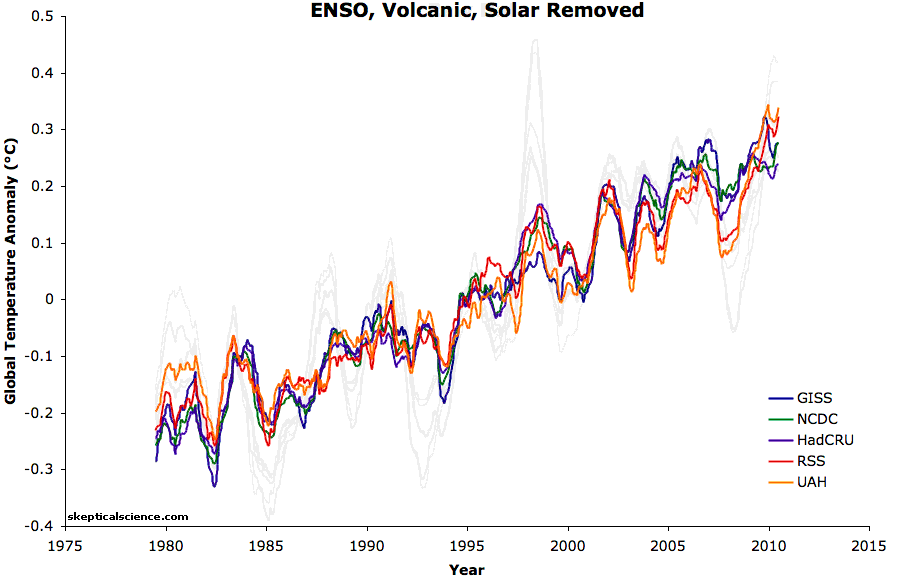
Figure 2: Temperature data (with a 12-month running average) before and after the Foster and Rahmstorf exogeneous factor removal

The trends in the various temperature data sets are also in much stronger agreement after the Foster & Rahmstorf filtering is applied (best estimates for 1995 through 2010 between 0.14 and 0.20°C per decade).

As tamino recently showed, over the past decade these three factors have had a cooling effect of approximately 0.13°C of surface temperatures and 0.21°C of TLT.  Nevertheless, temperatures have continued to rise, albeit more slowly due to these natural cooling effects.

To make a long story short - global warming continues.

0 0

Printable Version  |  Link to this page

Comments

Comments 1 to 17:

  1. Wow, another excellent post. Really too bad most skeptics won't ever read this, and then of those who do, maybe 1 in 5 will grasp it.
    0 0
  2. Oh dear, it's C3Headlines. They seem to be a comedy goldmine. For example, this: http://topologicoceans.wordpress.com/2012/04/04/graphing-out-loud-curves-and-lines/ and this: http://tamino.wordpress.com/2012/01/29/some-questions-for-rutan/
    0 0
  3. re "The term essentially means "we can't rule out the possibility that it isn't warming." I don't think that is a very clear way of expressing what "not statistically significant warming" means in this context. I would prefer to say, "we can't rule out the possibility that the observed warming was caused by relatively short-term natural factors rather than by the long-term effects of human actions."
    0 0
  4. Slioch @3 - the question here is whether it's warming, not the causes of that warming. That quote may not be clear, but it's correct.
    0 0
  5. To me the most egregious misrepresentation of Santer is taking the statement that 17 years of data coverage are needed to compute a trend and then using two individual monthly points separated by 17 years to show no change. These are not even close to the same thing.
    0 0
  6. In my arguments with them, I think I've see where the average fake sceptic goes wrong with these graphs. The problem seems to me that most of them basically draw a line across the top of all the peaks and then claim there's been no warming. In reality, of course, the peaks represent a only small percentage of the warming going on and it's the bulk of time between the peaks and troughs, when there is a steady but unspectacular rise in average temperatures, that tells the real story.
    0 0
  7. #4 dana1981 "the question here is whether it's warming, not the causes of that warming." Hmmm, no I don't think that is correct, but would welcome views on this issue. There are two questions, when examining a segment of a temperatures/time series of global surface temperatures such as HADCRUT or GISS (or lower troposphere UAH or RSS). The first is whether, taking into account the errors in the measurements, one is justified in saying that there has been a warming trend in the data over a particular period. For example, any period of a few years leading up to the great El Nino of 1998 would show warming, and that warming would be statistically significant in the terms that you have used: ie even taking into account the errors of measurement, a statistical analysis of the segment of a few years running up to 1998 would surely (say I, not having done the analysis!) conclude that there is a greater than 95% probability that warming, however caused, was occurring during that segment. Is that not the case? The second is whether any such warming is human induced. It seems to me that the sense in which you are interpreting the term 'statistical significance' is in answer to the first question, but that is not the issue, as far as I understand it it, that Santer was addressing. He was making a similar statement to that of Phil Jones in his famous BBC interview in February 2010, here: http://news.bbc.co.uk/1/hi/8511670.stm BBC - "Do you agree that from 1995 to the present there has been no statistically-significant global warming" Phil Jones "Yes, but only just. I also calculated the trend for the period 1995 to 2009. This trend (0.12C per decade) is positive, but not significant at the 95% significance level. The positive trend is quite close to the significance level. Achieving statistical significance in scientific terms is much more likely for longer periods, and much less likely for shorter periods." As far as I understand it, Santer and Jones were addressing the issue of whether the observed warming was due to human actions or not. After all, that is the interesting question, that is what people want to know: would the observed warming have occurred anyway, in the absence of human influences? Or can we state that there is a 95% probability that the warming is due to human actions and would not have occurred naturally? This the issue that Jones addresses explicitly later in the interview: BBC "How confident are you that warming has taken place and that humans are mainly responsible?" Phil Jones "I'm 100% confident that the climate has warmed. As to the second question, I would go along with IPCC Chapter 9 - there's evidence that most of the warming since the 1950s is due to human activity." That is also the issue that Foster and Rahmstorf (2011) address: if the main natural factors influencing surface or lower troposphere temperatures (solar, ENSO and volcanic) are (more or less) removed from the temperature series, is there a remaining warming trend that can be attributed to human influence? That is the question that they elegantly answer in the affirmative. They were not addressing the question of whether there had been any warming at all, but the causes of it.
    0 0
  8. Slioch - "For example, any period of a few years leading up to the great El Nino of 1998 would show warming, and that warming would be statistically significant in the terms that you have used..." That would be incorrect, considering that the question is not "is it warming/cooling" (think summers versus winters, definite temperature changes), but "whether average temperatures are warming/cooling", a long term (climate) trend over and above normal variations such as ENSO. Such a trend identification requires a fair bit of data - enough that the uncertainties induced by variation and measurement errors are low enough for a "no trend" line to fall outside the generally accepted 2 standard deviation range (95%) range. Second to that is attribution, where we have to look at our available data on possible forcings (insolation, aerosols, albedo, greenhouse gases - anything changing) to see which of those is changing, and how, and for purposes of our own deciding whether to change the forcings under our control. As to your examples, I would have to agree with Jones - complete confidence that the climate is warming, extremely strong evidence that the major part of it in the last half century is due to us. But F&R did not address any attribution issues, they simply looked at better identification of the trend outside identifiable variations. And Santer et al were also looking at trend identification, not attribution. These are different questions.
    0 0
  9. 7, Slioch, No. Santer is only discussing whether or not it has warmed, but from the frame of reference that if there were anthropogenic warming then you would have to have 17 years to see any warming (natural or anthropogenic). Santer is not discussing attribution of that warming, and neither is Phil Jones with his "statistically significant" response, and neither is this post. If you wish to discuss it, please do so on the "It's not us" thread here. Your inclusion of Phil Jones' answer to a later question about attribution and your (mis)interpretation of Foster and Rahmstorf (2011) inappropriately steer the discussion in that direction. No one is saying that it's not an interesting or important question. Only that this isn't the place to discuss it. This thread is about Santer and whether or not the earth has warmed in the past X years.
    0 0
  10. Sphaerica @9 is correct. If only considering temperature data, as with Santer and Jones in the first part of the inteview, the question is simply whether the average global temperature has increased. Attribution of that warming, while an important question of course (one which I've explored in many SkS posts), is a different subject which requires more information.
    0 0
  11. dana1981 Given that global warming is about whether or not the Earth 'system' is warming over time or not, it should be clear to all what is defined as the 'system' and what is a significant time. I think of the 'system' as a spherical shell of air, water and land, bounded by the bottom of the ocean and land surface and the top of the atmosphere. This shell is about 100km thick and has energy entering and leaving at the top and entering from geothermal at the bottom. To stay at equilibrium, the top balance has to be slightly cooling in order to offset the slight warming from the bottom of the oceans. A separate issue is what portion of the warming is caused by human releases of CO2. That portion could be thought of as more than 100%, for if the Earth system would have been naturally cooling and it is now warming, the CO2 effect is offsetting the cooling and then adding some extra warming. Figure 2 suggests that CO2 GHG warming portion is about 100% because the lack of surface temperature increase over 17 years is all due to the cooling effects of Solar, ENSO and Volcanoes. Solar and Volcanoes are accepted as external to the Earth 'system' - ENSO is not - at least over a significant time. Which brings us to what is a significant time. The figure of 15 years has been quoted - 17 years in the above article. My question is whether ENSO should properly be treated as an external forcing over this time period. If not its effects should be excluded from Fig 2.
    0 0
  12. I'm a little unclear on the problem with transferring Santer's 17-year recommendation from the satellite to the surface records of global temperature. To my mind, they are quite similar, even though measuring dfferent properties, and the surface records are less variable (respond less to ENSO) than satellite, thus more likely to be statistically signficant. Eg, the 17-year trends (1994 - 2010 inclusive) for GISS, NOAA, HadCRUt3v and HadCRUt4 are all statistically significant. Not the case for either of the satellite records. Makes me think applying the 17-year 'rule' is even stronger for surface temps. ?
    0 0
  13. #8 KR, #9 Sphaerica and #10 dana1981 Thanks for responding, and I'm sorry to be a little late getting back to you - I've been away for much of the last few days. Having looked at the matter again, I must say, yes, you are right: I had misinterpreted the Jones 1995 statement and he was merely concerned with the question of whether or not there had been warming since then. I still find the Santer paper somewhat ambiguous from the quote given above, since he refers to "identifying human effects on global-mean tropospheric temperature" rather than simply to "warming". As for Forster and Rahmstorf 2011, they show that when ENSO, solar and volcanic influences are removed from the temperature series there is still a warming trend. I cannot see how interpreting that by saying that the remaining warming trend cannot be attributed to ENSO, solar and volcanic influences is incorrect, though my final sentence in #7 went too far.
    0 0
  14. Then there's this latest research by John Nielsen-Gammon, here GISTemp global temperatures, with trends for El Niño, neutral, and La Niña years computed separately. Pinatubo years are excluded Yup, still warming (latest CRU data included, for the nay-sayers)
    0 0
  15. And Yet... Andrew Bolt (Herald Sun Thur 18 Oct "Theory Grows Colder") continues to use this as proof that the "warmists" are wrong
    0 0
  16. Shock! Horror! Andrew Bolt and the Murdoch Empire caught misrepresenting the truth! Who would have thought it? Are they not as pure as the driven snow? Are they not so far above us that their pronouncements should be meekly accepted by the inferior rest of us? This is the most humble day of my life.
    0 0
  17. "Are they not as pure as the driven snow?" Snow is melting pretty fast these days...
    0 0

You need to be logged in to post a comment. Login via the left margin or if you're new, register here.


The Consensus Project Website

THE ESCALATOR

(free to republish)


© Copyright 2024 John Cook
Home | Translations | About Us | Privacy | Contact Us