


 Arguments


Recent Comments
Prev 1058 1059 1060 1061 1062 1063 1064 1065 1066 1067 1068 1069 1070 1071 1072 1073 Next
Comments 53251 to 53300:
-
Tom Curtis at 10:31 AM on 8 November 2012WSJ, Sandy, and Global Warming - Asking the Right Questions
Neven @14, Pielke shows the following graph of normalized annual losses: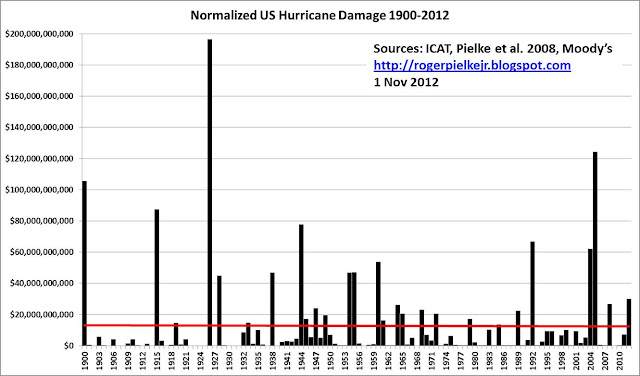 The figures are normalized to 2012 values. Looking at his data for Pielke et al, (2008),he shows only seven land falling hurricanes showing greater than 35 billion dollars damage, normalized to 2005 levels (ie, approx 40 billion normalized to 2012 levels). His claim that Sandy would rank as only the 17th most damaging hurricane is therefore false, assuming Moody's estimates are reasonable.
Oddly, Pielke shows a Sandy estimate of 30 billion, contrary to Moody's, which he cites and links to. Moody's actually gives an estimate of 30-50 billion; from which it appears that Pielke has deliberately reported the low end of the estimated range as being Moody's estimate.
Further, it is illegitimate to quote his "normalized damages" as data for the most costly hurricane. The most damaging hurricane based on his normalized costs was the Great Miami Hurricane of 1926, with normalized losses of 157 billion dollars (normalized to 2005), but the actual cost in 1926 was just 105 million dollars, equivalent to a cost of one billion dollar in constant 2005 value, or 1.15 billion in 2012. Quoting the actual price parity cost is misleading because the increase in costs are largely a consequence of increasing population and wealth; but that does not excuse Pielke's inaccurate language.
What is more, and contrary to Dana, I have severe doubts about Pielke's normalization procedure. As noted, the most highest normalized cost of any land falling Hurricane in the US, according to Pielke is, 157 billion dollars (2005 value). That means normalization has increased the recorded value by nearly 1,500 fold. By contrast, the other two hurricanes making landfall in 1926 have multipliers of 1250 (Hurricane 1, landfall in Florida) and 150 (Hurricane 3, landfall in Louisiana). The second most costly hurricane in Pielke's data was the 1900 hurricane of Galveston ($78,000,000,000; multiplier approx 2,600). That multiplier contrasts starkly with the 160 multiplier of hurricane 4 of 1901.
It is not difficult to recognize the issue involved. Lousiana's population has increased 2.2-fold since 1926, whereas that of Miami has increased more than ten fold in the same period. Galveston is also an area of very high population growth. That population growth has been matched by an increase in land values and in intensive residency. Both population and wealth per capita are factors in Pielke's normalization.
Crucially, however, when cities develop very large populations, construction techniques do not stay constant. Miami, for example has moved from low houses and flats towards large reinforced concrete sky scrapers. The result is a significant loss of vulnerability to storm damage quite independent of any issues related to superior construction techniques for individual housing.
Put simply, dropping a tree on a house destroys it. Doing the same to the Empire State Building will shatter a few panes of glass. You cannot "normalize" the destructive impact of the former relative to the later simply by multiplying costs by the increase in population per square kilometer and the per capita wealth. Such a simplistic approach can only work in regions where the dominant style of construction has remained constant over time, ie, in rural areas and/or small cities and towns.
The crucial point here is that Pielke's flat trend in normalized losses depends on the existence of a very few, very costly (in normalized terms) storms early in the record. Without Galveston 1900, Galveston 1915, Great Miami 1926 and Hurricane 11 1944 (Florida land fall), the trend in normalized damages would undoubtedly be upwards. If Pielke's normalization took proper account of change in building design and standards (demonstrated by Jake above), his data would provide clear evidence that hurricanes are becoming more damaging with increased global temperatures.
The figures are normalized to 2012 values. Looking at his data for Pielke et al, (2008),he shows only seven land falling hurricanes showing greater than 35 billion dollars damage, normalized to 2005 levels (ie, approx 40 billion normalized to 2012 levels). His claim that Sandy would rank as only the 17th most damaging hurricane is therefore false, assuming Moody's estimates are reasonable.
Oddly, Pielke shows a Sandy estimate of 30 billion, contrary to Moody's, which he cites and links to. Moody's actually gives an estimate of 30-50 billion; from which it appears that Pielke has deliberately reported the low end of the estimated range as being Moody's estimate.
Further, it is illegitimate to quote his "normalized damages" as data for the most costly hurricane. The most damaging hurricane based on his normalized costs was the Great Miami Hurricane of 1926, with normalized losses of 157 billion dollars (normalized to 2005), but the actual cost in 1926 was just 105 million dollars, equivalent to a cost of one billion dollar in constant 2005 value, or 1.15 billion in 2012. Quoting the actual price parity cost is misleading because the increase in costs are largely a consequence of increasing population and wealth; but that does not excuse Pielke's inaccurate language.
What is more, and contrary to Dana, I have severe doubts about Pielke's normalization procedure. As noted, the most highest normalized cost of any land falling Hurricane in the US, according to Pielke is, 157 billion dollars (2005 value). That means normalization has increased the recorded value by nearly 1,500 fold. By contrast, the other two hurricanes making landfall in 1926 have multipliers of 1250 (Hurricane 1, landfall in Florida) and 150 (Hurricane 3, landfall in Louisiana). The second most costly hurricane in Pielke's data was the 1900 hurricane of Galveston ($78,000,000,000; multiplier approx 2,600). That multiplier contrasts starkly with the 160 multiplier of hurricane 4 of 1901.
It is not difficult to recognize the issue involved. Lousiana's population has increased 2.2-fold since 1926, whereas that of Miami has increased more than ten fold in the same period. Galveston is also an area of very high population growth. That population growth has been matched by an increase in land values and in intensive residency. Both population and wealth per capita are factors in Pielke's normalization.
Crucially, however, when cities develop very large populations, construction techniques do not stay constant. Miami, for example has moved from low houses and flats towards large reinforced concrete sky scrapers. The result is a significant loss of vulnerability to storm damage quite independent of any issues related to superior construction techniques for individual housing.
Put simply, dropping a tree on a house destroys it. Doing the same to the Empire State Building will shatter a few panes of glass. You cannot "normalize" the destructive impact of the former relative to the later simply by multiplying costs by the increase in population per square kilometer and the per capita wealth. Such a simplistic approach can only work in regions where the dominant style of construction has remained constant over time, ie, in rural areas and/or small cities and towns.
The crucial point here is that Pielke's flat trend in normalized losses depends on the existence of a very few, very costly (in normalized terms) storms early in the record. Without Galveston 1900, Galveston 1915, Great Miami 1926 and Hurricane 11 1944 (Florida land fall), the trend in normalized damages would undoubtedly be upwards. If Pielke's normalization took proper account of change in building design and standards (demonstrated by Jake above), his data would provide clear evidence that hurricanes are becoming more damaging with increased global temperatures.
-
John Hartz at 10:03 AM on 8 November 2012WSJ, Sandy, and Global Warming - Asking the Right Questions
The editorial, Recent storms highlight need for Northeast hurricane mitigation plan posted on Business Insurance on Nov 4, 2012 nicely dovetails with Dana’s OP and undercuts Roger Pielke Jr’s rather shallow analysis. -
dana1981 at 09:21 AM on 8 November 2012WSJ, Sandy, and Global Warming - Asking the Right Questions
Kevin @38:"My objection is that all we're really saying is that ACE is more correlated with ocean temperature than with time"
Indeed, and ocean temperature is of course correlated with human-caused global warming, which is increasing over time. Really you just can't escape the fact that global warming makes hurricanes more intense. Pielke tries to escape that by arguing that this increased intensity hasn't directly impacted economic losses along the US coast yet, which may or may not be true, but even if true, there's no reason to expect this fortune to continue in the future. Which is the point of this post. -
Kevin C at 08:50 AM on 8 November 2012WSJ, Sandy, and Global Warming - Asking the Right Questions
Brian: OK, so the Grinsted and Mann papers achieve a homogenous record but don't measure quite what you want them to. Unfortunately when dealing with proxies you have to take what you can get. If ACE is the only measure which specifically addresses your questions, then I guess we have to work with that. So the next step is to see if we can extract any further information from the ACE. Hurricane activity is certainly correlated with AMO (unsurprisingly, because AMO is primarily a temperature measure). So if we do a multivariate regression with AMO and a linear term, we will get a better fit to the data and thus reduce the uncertainties, unless the extra parameter in the denominator is enough to counter the improvement. I can give that a go over the next few days, but it's a bit of work, so if you have any objections to the methodology then please make them now. (My objection is that all we're really saying is that ACE is more correlated with ocean temperature than with time. I'm very happy to re-frame the discussion in those terms, but unless RPJr is projecting an imminent end to warming I think it is unhelpful to his case.) -
quokka at 08:50 AM on 8 November 2012The View from Germany: Tackling the real questions
@michael sweet There are currently zero nuclear power plants being financed by private money in the entire United States As far as I am aware the Vogtle AP1000s build is privately financed. There is an offer of a federal loan guarantee, but it is not yet agreed and the senior partner, Southern, is saying that it may not be necessary as their financing costs so far have been less than projected. Southern Co CEO says nuclear loan guarantee less enticing Construction is underway, and I would ask for any evidence that Vogtle is not (mainly) privately financed. As I understand it there will be some customer levy to help offset financing costs. I can't see anything wrong with that in principle. In Germany the retail levy paid by consumers to support renewables is to rise to over 5 Euro cents per kWh. I see no problem in principle with that either. The question is whether the money is being wisely spent to achieve decarbonization as rapidly as possible. Surely that goal is the point of all of this. -
Speedy at 08:47 AM on 8 November 2012The View from Germany: Tackling the real questions
DB: That study has been thoroughly debunked: Sloppy statistics kill 14000 people. This is very good example of the anti-scientific "studies" that unite anti-nukes and climate deniers. I'm extremely disappoined that staff on a site that prides itself in debunking anti-science would post this sort of nonsense.Moderator Response:[DB] You have an interesting operational definition of the word debunked. Actually, you gloss over the use of the word "preliminary" in the Moderation Comment you express so much invective about. And then you post as a "rebuttal" a link to a blog-post-about-a-blog-post about the Mangano & Sherman paper furnished you. An interesting source, but hardly a definitive one.
In the real world, as an example, cancer can take many decades from causative source exposure to mass development and detection. Attribution of said exposure can be difficult without proper data and methodological controls.
Given that Mangano & Sherman believed, after data analysis, that an increase in incidence of mortality in the US was detectable after Fukushima, the appropriate and responsible thing for them to do is to then document it in a published paper. And to then undergo the following peer-review. For much, or even most, peer-review occurs post-publication.
Mangano & Sherman will follow that orbit through the peer-review process. If their contribution, after being weighed via other analysis', is found to have merit and make a positive contribution to the literature in their area of expertise, then it will have served a useful role. Note that this is still true even if the results of Mangano & Sherman are found to not have merit.
Perhaps in the field of pro-nuclear advocacy the leaping to conclusions by the excising of published papers not immediately adhering to preformed belief systems is de riguer; if so, that is disappointing to those adhering to the scientific method.
In the meantime, the scientific method and the proper peer-review of Mangano & Sherman proceeds apace...and will achieve the resolution that said peer-review will ultimately come to, agendas notwithstanding.
-
Doug Bostrom at 08:23 AM on 8 November 2012WSJ, Sandy, and Global Warming - Asking the Right Questions
A little further along the lines of Dana's thoughts, Pielke as far as I know has been consistent on a point with which most of us would find agreement: the present model of coastal development is wrong in many ways. That leaves me scratching my head over his employing short term variance in hurricane strikes as an argument against becoming overly excited about hurricanes. We've had a deficit of hurricane strikes that can't be taken as indicative of what the future portends, but we should model our planning on those few years? It's as though he's arguing against his own long-standing advice that we remodel our thinking about coastal development. I doubt that's his intention. Confusing. -
dana1981 at 07:56 AM on 8 November 2012WSJ, Sandy, and Global Warming - Asking the Right Questions
Brian @34 - I'll tell you from my perspective, the reason Pielke gets so much heat is that he (intentionally or unintentionally, I don't know) undermines efforts to actually address the underlying problem with posts like this WSJ piece. For example, as I discuss above, his bogus "hurricane drought" argument is totally useless except as ammunition for certain parties to argue that global warming and extreme weather aren't connected, or are nothing to worry about, etc. In fact it's hard to understand why he wrote the piece at all. As I discussed, there's a clear link between extreme weather intensity (including hurricanes) and global warming, so what's the purpose in writing an article in the WSJ just to say we can't yet make a clear link between global warming and normalized economic hurricane damage (even if that's true, which I still hold is a faulty argument)? If you actually want to get something done to address climate change (though I'm not entirely sure Pielke does), that's a major messaging failure. I know Pielke doesn't see it that way - he thinks those who are making the link are the ones screwing up the messaging - but he's wrong, and that's one of the main reasons for the criticism (aside from the fact that he's on shaky scientific footing at best). -
Doug Bostrom at 07:47 AM on 8 November 2012WSJ, Sandy, and Global Warming - Asking the Right Questions
Brian: They do show a trend in the most intense surge events, which they say correspond to hurricane-level events, but since we already KNOW there's no trend in the number of landfalling U.S. hurricanes, it's hard to know what to conclude about it. I wonder if anybody's done analysis of the general approach speed of storms over the past few decades? Holding other storm characteristics constant, a general slackening of approach speed might produce that result, seemingly. -
Brian B at 07:47 AM on 8 November 2012WSJ, Sandy, and Global Warming - Asking the Right Questions
Composer99 (#21) You say "That's claiming we don't have the data or techniques to tease out the contribution of AGW to natural disasters or to losses therefrom. It seems to me to be much different from claiming that there is no contribution of AGW to disasters, or to disaster losses, which we can examine with reference to physics (e.g. higher sea surface temps mean more powerful storms, higher sea levels mean more dangerous/damaging storm surges, and the like)." The two are indeed different claims. Let me point out that Pielke only makes the first claim, that we haven't been able to see the signal yet. As far as I know, he fully expects that signal to be seen in the future. The fact that he makes fairly mild assertions (not the more dramatic and unsupportable ones) makes it even harder to explain the fierceness of the criticism leveled at him. He's not denying the existence of a signal, only our ability to see it at a statistically significant level. Let's be clear: all the statements we see in the blogosphere and from politicians and other commentators attempt to attribute current losses to AGW. There is no scientific basis for such claims and this is Pielke's point. Those who make such claims are going beyond what science can say. If we are honest, we will criticize them and their misuse of science, not the Pielke's of the world.Moderator Response: [DB] Please refrain from all-caps usage (converted to bold above); also, please review this site's Comments Policy. Thanks! -
Brian B at 07:36 AM on 8 November 2012WSJ, Sandy, and Global Warming - Asking the Right Questions
Albatross (#29), I don't believe I've made any erroneous claims, certainly none has been pointed out above, but I am open to correction if I have. I look forward to your analysis and our future discussion. -
Brian B at 07:10 AM on 8 November 2012WSJ, Sandy, and Global Warming - Asking the Right Questions
Kevin C, Thanks for those numbers. Just by eyeing it up I would have guessed a significantly larger uncertainty, but that's why we do the calculation. Regarding the quote, what part of the Grinsted and Mann papers do you think contradicts what I wrote? Grinsted looked at surge data at only 6 sites, mostly in the SE U.S., so does not provide data for the entire U.S. Even so, they found no trend since the 1920s in the surge index, which they say should be interpreted as a measure of potential threat to infrastructure. They do show a trend in the most intense surge events, which they say correspond to hurricane-level events, but since we already know there's no trend in the number of landfalling U.S. hurricanes, it's hard to know what to conclude about it. The Mann paper measures sediment data at a handful of sites in the eastern U.S. and Caribbean, but the sediments show strong changes in the 20th century that Mann correlates with cylone activity in the entire atlantic basin. The paper explicitly assumes that smoothed landfalling hurricanes rates vary in proportion with basin rates, but this assumption is not valid for the 20th century (since no landfalling trend is actually seen). At no point does either paper show or claim an actual increase in U.S. landfalling hurricanes (frequency or strength) since 1851.Moderator Response: [DB] Please refrain from all-caps usage (converted to bold above); also, please review this site's Comments Policy. Thanks! -
Doug Bostrom at 06:49 AM on 8 November 2012Book review: Rising Sea Levels: An Introduction to Cause and Impact by Hunt Janin and Scott Mandia
Tricky years ahead. How to thread the legal needle of acknowledging necessities imposed by climate change via legislative guidance, policy, budget authority and all the myriad implementation details of civil government, while simultaneously refusing to assign culpability for the needlessly exaggerated scale of the problem? 20+ years of being the subject of a campaign of confusion intent on procrastination is going to cost a terrific amount of money to amend, but nobody's going to be on the hook for reimbursement. The Godzilla of amnesty programs, truly. Refusing to speak the names that must not be uttered will also make it objectively more difficult to do the work of coping with climate change. Thinking about a topic is harder when broad swathes of facts are sanctioned from consciousness. We're very generous with these concessions. Will we be thanked? Probably not. -
Speedy at 06:43 AM on 8 November 2012The View from Germany: Tackling the real questions
(-snip-). Back to the numbers in the Öko-Institut report... When you see numbers for NG that's lower than what you get from burning methane at 100% efficiency, that's reason for heavy skepticism. Digging deeper, I now see how they got there, but (-snip-). At least they show their numbers. The numbers in table 3 are quite useless, IMO, since they're effectively putting oil heating at zero CO2 and then counting saved oil from CHP plants as negative emissions. Table 4 is better, but still skewed in favor of (bio)gas. One problem is that it assumes that the demand for heat is twice the demand for electricity. Things look very different during summer when demand for heat is next to zero. Another issue is the omission of nuclear CHP. It's rare today, but nevertheless an option. Also, why use oil for heating when you have clean electricity? Use electric heating instead, preferably heat pumps. A smaller issue is how to count the emissions from the nuclear fuel cycle, especially enrichment. It's typically calculated based on the energy requirement for enrichment and the average emissions for the local electricity supply. I think is better to subtract the electricity needed from enrichment from the output of the NPP, i.e. if a plant produces 1GW on average and 10MW (this is a made-up number for example only) is used to enrich its you, you calculate emission based on the NPP supplying 990MW. Importing enriched uranium will of course complicate this calculation. Onto German energy policy: The picture of the two new units at the Neurath power plant at the RWE site is a perfect illustration of Germany’s broken energy policy. A brand spanking new lignite plant, with some windmills in the background for greenwashing. To make matters worse, the hill the windmills are built on, Vollrather Höhe, is a spoil tip from the nearby Garzweiler open pit lignite mine. From RWE: In 15 minutes, each BoA 2&3 unit can increase or decrease its output by more than 500 MW. This helps offset fluctuations in the feed-in of renewable energy. An important contribution to Germany's energy U-turn. I also recommend the video on this plant, but take your blood pressure medicine before you start watching it. I stongly doubt that Germany will reach 35% renewables in 2020, and I'm absolutely certain that they won't reach 85% by 2050 (or any time at all really). I think this will go the way of California's 10% ZEV by 2003. (Nothing against electic cars, just an example of a well meant, but unrealistic political goal.) I used to be a much stronger supporter for wind and solar, but the more I've studied them, the less optimistic I've become, to the point that I think they're a waste of time and money for large scale grid integration due to the reliance of dirty and dangerous fossil fuels to ensure reliability and dispatchability, except in regions with lots of hydro. They can be very useful for small scale off-grid applications though. Nuclear power is not perfect, nor will it ever be, but it's the best we have. Thanks to the extreme energy density of nuclear fuel, nuclear requires very little resources compared to other energy sources. Managing spent fuel is a trivial problem compared to GHG and other emissions from fossil fuels, thanks to the tiny volume. Most of the spent fuel from current reactors, is also not waste, but usable as fuel in next generation reactors. There's also some valuable stuff, both radioactive and non-radioactive, among the fission products. Despite what you hear from anti-nukes, nuclear is the the safest energy source we have (measured in deaths/TWh). In fact, I'd much rather have RBMKs (Chernobyl type reactor) than any fossil fuels plants. There are 3.3 million annual deaths from air pollution, mainly from burning of fossil fuels and biomass, but the anti-nukes don't care nearly as much about them as they do about hypothetical deaths from nuclear. The best way to get rid of fossil fuels is to demand the same level of safety and waste management as nuclear power. Doing so would make prices skyrocket. -
dana1981 at 06:11 AM on 8 November 2012WSJ, Sandy, and Global Warming - Asking the Right Questions
Brian @15 - I appreciate you making the effort to defend Pielke's work and comments, since he's unwilling to defend them himself. And you do have a few valid points. For example, I take no issue with Pielke's normalization process. It seems perfectly fine - the problem is that it's limited in that it does not consider technological advancements. Not just in buildings (though jake @25 provides some very useful data on that specific issue), but also in terms of storm barriers, model predictions of hurricane paths, etc. Pielke doesn't even attempt to account for these factors, he just says (as far as I can tell) 'I got the answer I expected to those factors must be negligible'. That's bad science. I also second Kevin's comment @20 that Grinsted at least suggests US hurricane landfalls are increasing (I haven't looked at the Mann paper he references). But even if Pielke is right that the intensity of hurricanes making landfall in the USA isn't increasing, why should we expect that to continue, particularly when Francis predicts more blocking events like the one that pushed Sandy toward the coast to occur as a result of changes in the Arctic? Even if we've been lucky so far in that the increase in Atlantic hurricane intensity hasn't impacted the USA, why assume we'll continue to be lucky when the evidence suggests otherwise? There are just a lot of holes in Pielke's argument, and it seems to be based on ignoring a whole lot of inconvenient data. -
Albatross at 04:49 AM on 8 November 2012WSJ, Sandy, and Global Warming - Asking the Right Questions
Jake @25, Thanks for your informative post. -
Albatross at 04:49 AM on 8 November 2012WSJ, Sandy, and Global Warming - Asking the Right Questions
Brian @15, Others have already corrected some of your erroneous claims/assertions. I'm busy drafting a response to your misleading post, but as is often the case, refuting misleading or erroneous claims takes a lot more time (and effort) than making them. More to follow. -
M Tucker at 04:08 AM on 8 November 2012Book review: Rising Sea Levels: An Introduction to Cause and Impact by Hunt Janin and Scott Mandia
Look, we need to immediately reduce GHG emissions. If we want to avoid even worse disasters than we already face we must act now. But yesterday Climate Progress posted a piece on a new report from PricewaterhouseCoopers. In that report they made the case that we, the world, are nowhere near reducing GHG at a rate that will limit warming to 2 degrees C. It is not the only report that makes that point and I have seen studies that suggest that even if we could stop at 400 ppmv of CO2 we would still experience 2 to 3 degrees. So we must assume the world will continue to warm, the oceans will continue to warm, the ice sheets, ice caps and glaciers will continue to melt and the sea will rise. I think this is an important book but people must realize that cutting emissions will not prevent sea level rise. We must prepare now for the inevitable. We must decide if we want to take on the huge economic burden to save the low lying cities, low countries, and mega deltas. You cannot construct massive levees, seawalls, and storm surge barriers in a few years. You need to decide if you are going to raise streets and buildings. You need to consider reengineering utility infrastructure. You need to investigate if your subway can still run if sea level rises 1 to 3 feet. You need to plan how your sea ports will function with higher sea levels. It is a massive undertaking and I hope this book addresses those issues. Simply reducing GHG emissions will not prevent the inevitable and I am reminded of something a civil engineer said about levees. There are only two kinds of levees: those that have failed and those that will fail. -
Doug Bostrom at 03:30 AM on 8 November 2012WSJ, Sandy, and Global Warming - Asking the Right Questions
Alpinist: Looks like the current estimates for Sandy have risen into the $50 billion range and continue to trend up. For me one of the most striking (and reckless) things about Pielke's op-ed was employment of ~$20 billion as key evidence for his argument. Hasty, risky. -
michael sweet at 02:30 AM on 8 November 2012The View from Germany: Tackling the real questions
Uncle Pete, Here in Florida we have a damaged nuclear power plant that is not economic to repair. They have wasted over $1 billion planning a new plant that will never break ground, it is not economic. In Los Angeles they also have a damaged plant, although it may be worth repairing. There are currently zero nuclear power plants being financed by private money in the entire United States. If nuclear is so good, why is no-one wiling to pay for it? If it is uneconomic to build it cannot do the "heavy lifting". This does not even count shut down costs and waste disposal. Fukushima proved how ineffective current waste storage is. Meanwhile solar and wind installation continue to increase. -
gws at 01:42 AM on 8 November 2012The View from Germany: Tackling the real questions
yes quokka (and speedy), thanks, but no thanks for moving the goalpost one more time. Let me tell you what I hear from you (perception): 1. But ... the source says this ... 2. But ... I do not understand ... 3. But ... they are biased / doing this wrong ... 4. But ... you need to (re-)produce these numbers before I believe it. Hmmh. 1. No it does not 2. Go contact them 3. If you think so, ask them. Argue nicely. 4. No I don't. I refrain from reinventing the wheel. If you want to do that, see answers 2. and 3. And now that we have moved so far away from the topic of my post, I will let this go. Let us know though once you asked them what the result of your argument is. -
jake7351 at 01:08 AM on 8 November 2012WSJ, Sandy, and Global Warming - Asking the Right Questions
should of made it clear, data is for Charlotte County, Florida only. last post on this, i promise :) -
jake7351 at 01:04 AM on 8 November 2012WSJ, Sandy, and Global Warming - Asking the Right Questions
in pic 3 and 4 above, claim severity is in "$/square foot" -
jake7351 at 01:02 AM on 8 November 2012WSJ, Sandy, and Global Warming - Asking the Right Questions
Some info regarding improvement in construction of homes reducing losses... Insurance Institute for Business and Home Safety analysed claims made after Hurricane Charley (2004), finding "frequency of claims was reduced by 60% and the claim was 42% less severe when a loss did occur, for homes built after the adoption of the modern codes. "


-
Jeffrey Davis at 00:58 AM on 8 November 2012WSJ, Sandy, and Global Warming - Asking the Right Questions
IIRC, the connection between AGW and an increase in hurricanes is tenuous. A decline in the difference between temperature gradients might offset the increase in available energy due to the increase in SSTs. Fewer, but stronger, hurricanes. And, as with, Sandy, there might be a radical change in storm tracks. And to iterate the point made in #23, there is no "proof" in science. Anyone who asks for "proof" is either running a con or severely misunderstands science. -
CBDunkerson at 00:30 AM on 8 November 2012WSJ, Sandy, and Global Warming - Asking the Right Questions
This is the same nonsense we got in the tobacco wars; 'You cannot prove that the lung cancer which killed John Smith was caused by his longtime smoking habit. People died of lung cancer before cigarettes too.' 'You cannot prove that the storm which devastated New Jersey was caused by longtime human CO2 emissions. Devastating storms happened before AGW too.' Both arguments are 'true', but deliberately avoiding the point. Smoking causes lung cancer! AGW causes devastating storms! Drunk driving causes car accidents! The perpetual refrain that 'you cannot prove they caused that particular incident' is pure misdirection. We still can't prove that John Smith died because of smoking or that a fatal car accident would not have happened but for the driver's drinking... but that doesn't stop us from recognizing that these things are dangerous. The refusal to do so with global warming is a terrible mix of willful blindness and callous indifference. -
Alpinist at 00:30 AM on 8 November 2012WSJ, Sandy, and Global Warming - Asking the Right Questions
Neven: Looks like the current estimates for Sandy have risen into the $50 billion range and continue to trend up. -
quokka at 00:26 AM on 8 November 2012The View from Germany: Tackling the real questions
The Annual fuel utilization efficiency of gas or oil boilers/furnaces is ~80%. (-snip-). This incidentally, is what it should be about - looking at the numbers. (-snip-).Moderator Response: [DB] Sloganeering snipped. Re-inventing the flat tire is unhelpful. -
Composer99 at 00:16 AM on 8 November 2012WSJ, Sandy, and Global Warming - Asking the Right Questions
BrianB: I have a question with regards to your comment. You state:But Pielke is right that the peer-reviewed literature is clear that attribution of disaster losses to AGW simply is not possible right now. The signal, whatever it might be, is much smaller than the noise.
That's claiming we don't have the data or techniques to tease out the contribution of AGW to natural disasters or to losses therefrom. It seems to me to be much different from claiming that there is no contribution of AGW to disasters, or to disaster losses, which we can examine with reference to physics (e.g. higher sea surface temps mean more powerful storms, higher sea levels mean more dangerous/damaging storm surges, and the like). By way of historical example, if memory serves the global warming signal in surface temperatures only emerged from the noise in the late 80s, and can easily be lost in it if one examines short time frames - or finer spatial resolutions, such as only looking at US records (as if, somehow, the US is the only polity that matters in this discussion). But experiment & physics theory had confirmed by the 50s that enhancing the atmospheric heat trap by emitting carbon gases would cause warming. -
quokka at 00:07 AM on 8 November 2012The View from Germany: Tackling the real questions
@gws, I certainly have read Martin's comment and looked at the reference and it is utterly unconvincing. (-snip-). You would need ridiculously inefficient gas or oil heating that was (-snip-).There has to be some double counting going on.Moderator Response:[DB] Rather than continuing to issue assignations of deception and impropriety, please contact the source for clarification. That would be the "skeptical" thing to do.
Continuing focus on this in lieu of due diligence now constitutes sloganeering and will force moderation of your comments. FYI.
-
gws at 23:22 PM on 7 November 2012The View from Germany: Tackling the real questions
yes, your answers are "speedy", but does impressive highlighting make for them to be relevant? You have not followed through the comment from Martin @32 above, so here again (from that source, below Figure 3, translated for you): "To compare emissions from electricity-only options, like nuclear and wind, with options producing electricity and heat, like CHP, we have to consider the non-electricity but usable heat energy: For that we found the total emissions of the CHP process and subtracted the emissions of a heating process that would deliver the exact same heat" Your belittling of the choice of heating oil for that comparison makes a mountain of a mole hill; contact them, complain to them. And if you actually take the time to look beyond Figure 3, oh, what do you know, next page, you would have found Table 4, which lists your craved-for gross emissions comparison. Wasting my time here ... -
Kevin C at 23:18 PM on 7 November 2012WSJ, Sandy, and Global Warming - Asking the Right Questions
Brian: Concerning this quote:There can be no AGW signal in hurricane losses in the U.S. because there has been no change in landfalling hurricane frequency or strength since record-keeping started.
I don't think this claim accurately reflects the latest evidence. See Grinsted et al (2012) and Mann et al (2009). Both of these address the coverage concerns of Landsea (2007) in different ways, although clearly the issue isn't settled yet. -
Falkenherz at 23:15 PM on 7 November 2012Climate sensitivity is low
Dear Moderator, I am stuck. Apparently, the comment function on the article "Shakun e.a." seems to be bugged. It took several days before my questions actually appeared. Now, sometimes I can see my questions I posted there, sometimes not. I suspect that some answers to my questions might not have gotten through or are stuck. Could you pls check? (http://www.skepticalscience.com/news.php?p=4&t=151&&n=1391) -
Speedy at 22:26 PM on 7 November 2012The View from Germany: Tackling the real questions
gws: My point is that it's physically impossible for NG to be lower than 178g/kWh, so (-snip-).Moderator Response: [DB] Accusations of impropriety and deception snipped. -
gws at 22:09 PM on 7 November 2012The View from Germany: Tackling the real questions
quokka (Speedy) following your link shows that the listed "kWh" is the energy content in the fuel, not the electricity produced ... from that page: "Note! Heat loss - 55-75% - in power generation is not included in the numbers. Again: Contact the Oekoinstitut before you make any bias claims. They have a very high reputation in Germany, and will be happy to defend their choices. -
Kevin C at 22:03 PM on 7 November 2012WSJ, Sandy, and Global Warming - Asking the Right Questions
Brian: To answer your question on statistical significance of the Atlantic ACE trends, the trends and uncertainties calculated using an AR(1) noise model: 1850-2011: 0.30 +/- 0.10 1900-2011: 0.44 +/- 0.19 1950-2011: 0.42 +/- 0.46 1970-2011: 2.31 +/- 0.80 Trends are statistically significant at the 95% confidence level from 1850, 1900 or 1970, but not if you start from the 1950 peak. -
JohnB6223 at 21:34 PM on 7 November 2012Climate of Doubt Strategy #1: Deny the Consensus
An interesting exercise would be for the producers of "Climate of Doubt" to return to North Carolina after "Sandy" and re-interview Bill Cook (State Rep) to see if his confidence in Fred Singer is unshaken. A repeat interview of Stanley Riggs (Univ East Carolina)and NC-20 chairman Tom Thompson at the same locations shown in the original documentary may also be revealing. Did the waterfront infrastructure and beachfront properties in North Carolina survive the storm? I would expect "before" and "after" the storm images would say it all. -
Neven at 21:31 PM on 7 November 2012WSJ, Sandy, and Global Warming - Asking the Right Questions
But Pielke is right that the peer-reviewed literature is clear that attribution of disaster losses to AGW simply is not possible right now. But the fact that a number cannot be put to it, doesn't mean the number is zero. It's the same with externalities. In the WSJ op-ed Pielke writes: "If Sandy causes $20 billion in damage (in 2012 dollars) it would rank as the 17th most damaging hurricane or tropical storm (out of 242) to hit the U.S. since 1900—a significant event, but not close to the top 10." Any updates on that? -
jake7351 at 21:15 PM on 7 November 2012WSJ, Sandy, and Global Warming - Asking the Right Questions
'Scruggs and Benegal (2012)' link needs fixing ("file not found"). thanks -
gws at 21:11 PM on 7 November 2012WSJ, Sandy, and Global Warming - Asking the Right Questions
Thanks for the comment, Brian. You make a number of valid points. For instance, adhoc I cannot find any peer-reviewed studies challenging the Pielke normalization methodology, or offering a better one. However, while it makes sense intuitively, I still find it highly human-centric (aka human population and wealth only is assessed), and snap-shot like. Meaning, long-term effects are not (and maybe cannot be) considered, but would be the baseline to compare against. Also, I think the point in the post about human adaptive development is hardly "misguided". At first glance, there may be no effect, but upon thinking of examples, especially improved drainage system in reponse to urban flooding, I think you will realize that adaptation has indeed taken place. And I would venture to say that the investment into that public infrastructure has paid off. -
quokka at 20:56 PM on 7 November 2012The View from Germany: Tackling the real questions
Which has prompted me to actually look up the emissions per kWh from combustion of fossil fuels Combustion Fuels - Carbon Dioxide Emission Nat Gas: 0.23 kg/kWh Light Oil: 0.26 kg/kWh Crude Oil: 0.26 kg/kWh Kerosene: 0.26 kg/kWh Diesel: 0.24 kg/kWh Natural gas is not just methane which probably accounts for the discrepancy with the above methane figure. From these figures, it would seem that unless the laws of physics have been rewritten, the claims about CHP emissions are not believable. -
markx at 20:47 PM on 7 November 2012Global Surface Temperature: Going Down the Up Escalator, Part 1
(Rob P) - "...See my previous moderator comment. The fallacy in your claim has not been addressed..." Hi Rob. 1. Re the above, sorry, I am really not sure which was the fallacy? The temperatures stated were as published in Levitus etal. The calculated value was from the stated energy accumulation. 2. There are some problems with your comments section. Some very valid criticisms of my methods have disappeared, as have my (slightly humble) mathematical corrections, my temperature calculations being shown incorrectly smaller than they really were by a factor of 10. -
quokka at 20:31 PM on 7 November 2012The View from Germany: Tackling the real questions
@Speedy Combustion of methane is 178g/kWh at 100% efficiency Thanks Speedy. I should have looked it up, but it is kind of obvious that this is in the ballpark that one would expect from quoted thermal performance of CCGTs. -
Speedy at 19:39 PM on 7 November 2012The View from Germany: Tackling the real questions
Martin @32: ...and in Figure 3 it says, that the heat produced (in combined heat-power mode) is accounted as replacing oil heating. (-snip-). (-snip-).Moderator Response: [DB] Accusations of deception and impropriety snipped. -
gws at 19:06 PM on 7 November 2012The View from Germany: Tackling the real questions
Pete at @30 "China is following France's example " Sounds like a leap. While the article you list sounds like China plans to make nuclear its main power source, current production largely satisfies increasing demand. And all PWR. Hmmh, possible in (non-democratic) China maybe, but the world? And oh, it happens so that China does renewables with similar speed and determination. So it follows Germany's example, right? Right. This and your comment @34 suggest that you have not considered the issues I listed @27, and explained in the source I gave. Maybe China has. quokka Good to be skeptical (about lines 5 (CCGT) to 7 (block-CHP on biogas) in that table). Shoot the Oekoinstitut an email and ask, they will answer. These numbers go back to about 1997, so if they were seriously flawed, I am sure the nuclear industry had pointed that out yet. -
ChrisJJ at 18:14 PM on 7 November 2012Book review: Rising Sea Levels: An Introduction to Cause and Impact by Hunt Janin and Scott Mandia
Here's an interesting thought. Any improvements to coastal defences taken to protect against future tidal surges will involve heavy use of earth moving machinery, cement production, quarrying, dredging etc. This will involve the burning of considerable quantities of fossil fuels :-( -
Brian B at 17:13 PM on 7 November 2012WSJ, Sandy, and Global Warming - Asking the Right Questions
Since Pielke has chosen not to comment here, I'll add a few points. Many people claim to see the effect of AGW on disaster losses. With Sandy the claim has focused on hurricane losses in particular. But Pielke is right that the peer-reviewed literature is clear that attribution of disaster losses to AGW simply is not possible right now. The signal, whatever it might be, is much smaller than the noise. This will remain true for at least a century. No amount of wishing is going to make it so. With regard to hurricane losses, the following point can't be stressed enough: There can be no AGW signal in hurricane losses in the U.S. because there has been no change in landfalling hurricane frequency or strength since record-keeping started. The trends, though not significant, are both down, in fact. Until you accept and digest this basic reality, you cannot intelligently address the issue of losses. Pielke's work on normalization of losses is carefully done and has been fully accepted and undisputed in the peer-reviewed literature. It independently confirms what one expects from the data on hurricanes, tornadoes, etc., namely that no trends in weather data imply no increase in normalized, weather-related disasters. Emanuel's work is interesting but not relevant to the issue of LOSSES if the hurricanes don't reach land. Keep in mind that Emanuel argues that the more extensive Atlantic basin data set allows him to detect a trend that is not yet evident in the landfalling data. Whether that detected trend is true or not, he agrees that no attribution of losses can be made to hurricanes since the signal is missing in the landfalling data. Unfortunately, Emanuel's data has problems as well, since long-term coverage of the Atlantic basin storm record is spotty at best and suffers from measurement bias induced by the satellite era. Emanuel's improved statistics are of questionable value given the uncertain status of systematic errors. Please note that the graph given above for Atlantic basin ACE appears to have no statistically significant trend with the noise as large as it is. If you think the trend is significant, please provide the uncertainty. The arguments repeatedly made above about improvements in adaptation, such as better building codes, having an effect on losses are misguided. While substantial improvements in building codes have indeed been made, few of these adaptations are aimed specifically at hurricane losses, but rather at improved day-to-day safety, environmental impact, and cost. Unless structures are designed and built specifically for hurricanes, there's no reason to expect buildings to withstand hurricanes any better. Consider that a colonial-era fieldstone structure is more likely to survive than a modern lumber and siding structure. Is this so hard to understand?Moderator Response: All-caps converted to italics in accordance with the comments policy. -
Uncle Pete at 15:26 PM on 7 November 2012The View from Germany: Tackling the real questions
Energy from fission, energy from fossil fuels. Apples and oranges. Biofuels , at best a niche product. For the heavy lifting in emission free energy the only answer for now is nuclear. I shall again quote my personal prophet Bob Dylan . "Let us not speak falsely now , the hour is getting late" (From all along the Watchtower) -
markx at 12:16 PM on 7 November 2012Global Surface Temperature: Going Down the Up Escalator, Part 1
[SNIP]Moderator Response: (Rob P) - See my previous moderator comment. The fallacy in your claim has not been addressed, and you have simply persisted with this nonsensical notion. This is your 2nd warning for sloganeering (and note that this applies to reasonable dialogue peppered with sloganeering). No more warnings will be given, so please take the time to acquaint yourself with the comments policy -
quokka at 11:56 AM on 7 November 2012The View from Germany: Tackling the real questions
@Martin Vermeer, If you are going to account for emissions by how much oil heating (or gas heating) is displaced, then you need to consider the whole picture. In France, about a third of homes are electrically heated and about 90% of new homes. It's viable due to the low off peak electricity costs due to nuclear power. If you then subtract the emissions saved in heating from the life cycle emissions of nuclear power you will end up with a very attractive figure - possibly negative. This would be a fair comparison with micro gas CHP. The above attempt to show that even gas CHP has lower emissions than nuclear is not valid because it's terms of reference are too restricted and designed to reach a particular conclusion. There are also a number of places around the world where nuclear is used to provide district heating as well as electricity. The UK CCC devotes a large section of the "The Renewable Energy Review" to renewable heat. Their clear preference is for electrification where possible by heat pumps and where not possible by resistive heating. They did consider CHP and district heating, but reserved it as a topic for further study with fairly limited potential.
Prev 1058 1059 1060 1061 1062 1063 1064 1065 1066 1067 1068 1069 1070 1071 1072 1073 Next


