


 Arguments


Doctoring sea level data
What the science says...
| Select a level... |
 Basic
Basic
|
 Intermediate
| |||
|
The claim sea level isn’t rising is based on blatantly doctored graphs contradicted by observations. |
|||||
Climate Myth...
Sea level is not rising
"Together, these two unaltered [sea level] datasets indicate that global mean sea level trend has remained stable over the entire period 1992-2007, altogether eliminating the apparent 3.2 mm/year rate of sea-level rise arising from the “adjusted” data." (Christopher Monckton)
We have a new entry in the contest for most bizarre "skeptic" argument. The "Science" and Public Policy Institute ("S"PPI) Monthly CO2 Report for January 2011, edited by Christopher Monckton, claims on page 29: "Sea level is not rising."
This is of course false. In fact, sea level is not only rising, but the rise is accelerating. Immediately below this false claim, the document contains the following figure:
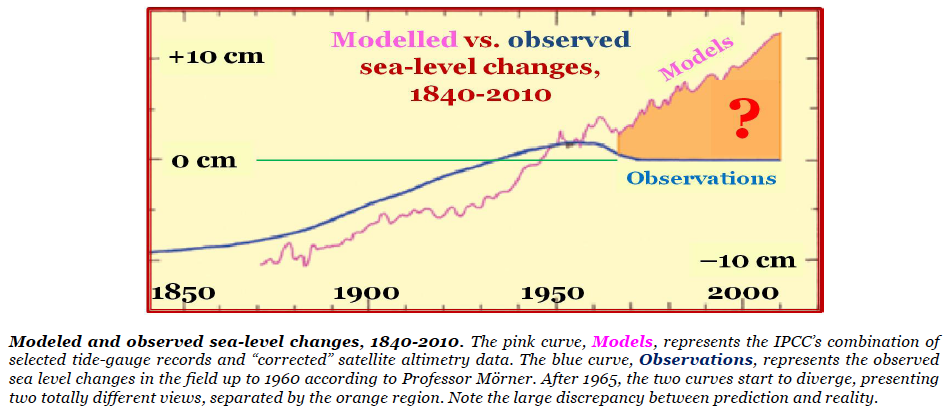
Notice that the caption claims the blue curve is observational sea level data "up to 1960 according to Professor Morner." Of course, after 1960 (when the "observations" are apparently just made up) is not only when the "observations" supposedly diverge from the models, but also when they diverge from reality! Ah, but it gets even worse from here. On page 33, the document presents what may be my favorite figure of all time:
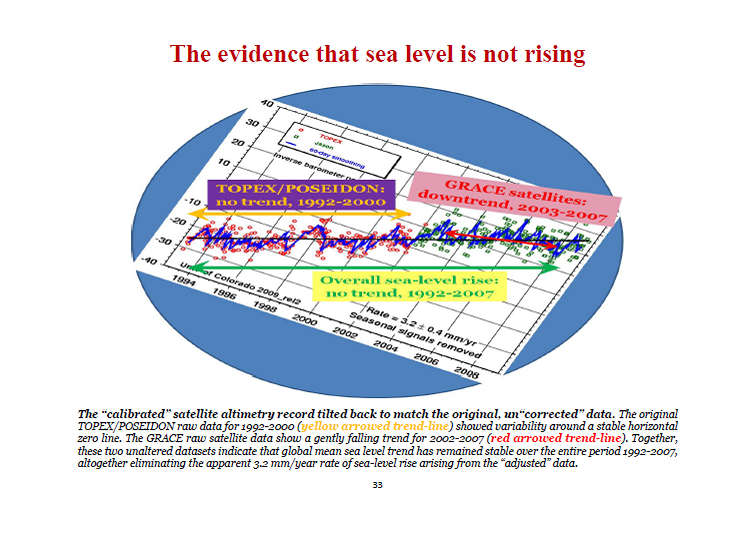
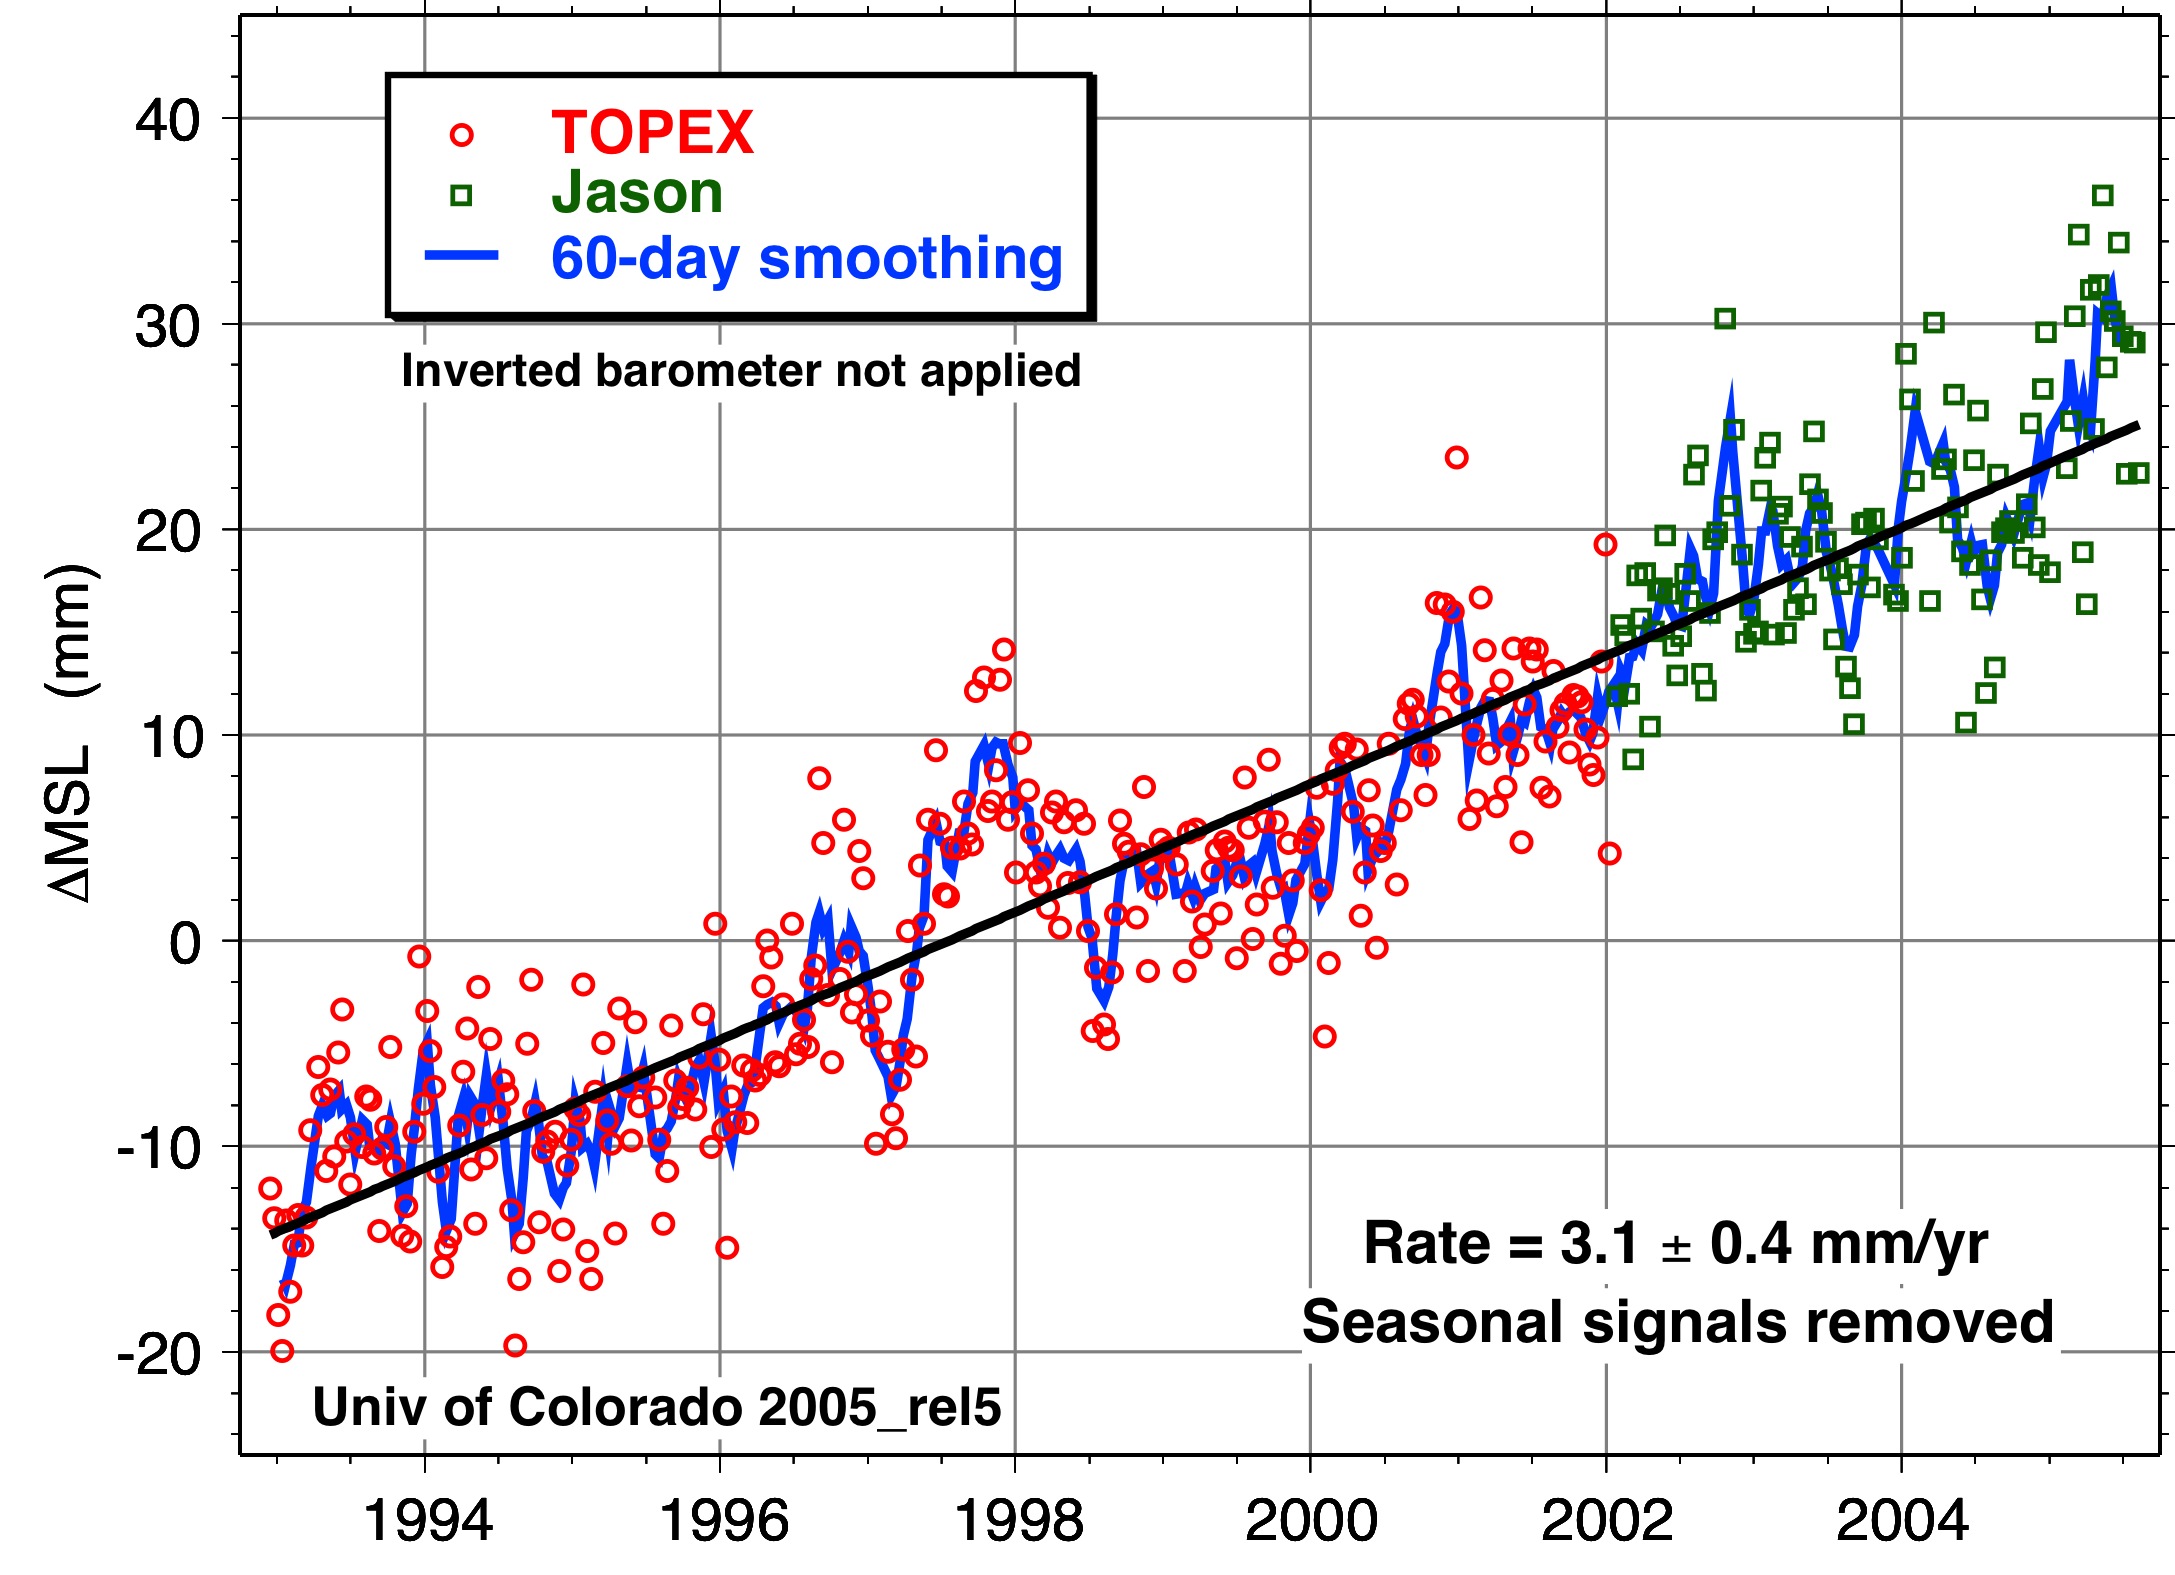
Monckton and "S"PPI have taken the sea level graph from the University of Colorado at Boulder which shows a 3.2 milimeter per year sea level rise trend (as is still visible in the bottom right of the graph), rotated it to make the trend look flat, and claimed that this is what the "unaltered" and "uncorrected" data looks like.
It boggles the mind that Monckton and the "S"PPI think they can convince people that sea level has dropped since 1950 based on nothing more than their own unsubstantiated claims and blatantly doctored graphs which are completely contradicted by the actual observational data.
Basic rebuttal written by dana1981
Update July 2015:
Here is a related lecture-video from Denial101x - Making Sense of Climate Science Denial
This rebuttal was updated by Judith Matz on September 13, 2021 to replace broken links. The updates are a result of our call for help published in May 2021.
Last updated on 8 July 2015 by pattimer. View Archives


Something has been bothering me for a while, but I've found no mentions in the literature. Maybe someone here has knowledge.
We know with increasing storms and precipitation causing massive flooding, landslides and topsoil degrading, the latter is talked about as harming agriculture. All the soil washed away eventually ends up in rivers and then the sea. It has volume, it is increasing. Archimedes?
Is anyone attempting to estimate the volume of loss and its effect on sea level rise added to all the other causes we know about? There are figures for soil loss annually, which one site claimed was the size of Wales, but no volumes and I know nothing about soil scince or erosion. However small, it's bound to add. Additionally, there's coastal erosion which is also adding annually to the eureka effect.
I wonder how Monkton or anyone with a graph they believe disproves rise would care to explain how come the North Norfolk coast is getting increasingly flooded from the North Sea, and the golf course at Brancaster, just to cite one place, is expecting to lose its course by 2020 as it's close to the sea with just dunes protecting. And as no houses on the seaward side of the coast road can get mortgages.
Hi,
Having grown up metres from a beach in the South Island of New Zealand, I would like to offer my observations, thoughts and a question. I personally have not observed any sea-level rises over 50 years (I'm a 63 year old) and have this link to an article on New Zealand's most read news website who btw recently published their policy that the science around climate change is "settled". <a href="https://www.stuff.co.nz/environment/climate-news/109478710/media-council-finds-no-grounds-to-proceed-for-climate-change-complaint">News website to publish only climate change friendly opinions and not skeptical viewpoints</a>
Below is a link to an article on where New Zealand's coastline is rising or falling.
<a href="https://www.stuff.co.nz/science/86784810/where-nz-rises-and-falls--and-how-it-complicates-the-rise-of-sea-levels"> Is it the land that rises and falls, not the sea?</a>
I find it difficult to imagine that any amount of erosion is causing a displacement effect mainly because the sea covers four fifths of the earths surface and the deepest point in the ocean is 10.9 kilometers while the highesthe point Mount Everest, is 8.9 km high.
I would like to be convinced that sea levels are indeed rising (as I have been convinced about increasing levels of residual CO2, explained clearly elsewhere on this site). Is anyone willing to try? Thank-you.
Bart, I find some aspects here a little puzzling. Where has anyone postulated that sea level is rising because of erosion causing displacement? This could only affect very local bays. Seas are rising because of two factors:
1/ Ocean warming. This causes thermal expansion. Because ocean volume is so huge small changes in temperature easily produce mm of rise.
2/ Melting ice. Glacier and icesheet losses are well documented.
As you point out NZ is a lousy place to measure sealevel rise because of tectonics (compare Marlborough sounds -going down - with Kaikoura going up) unless you live in Northland. Even so, on many wide beaches noticing a 10-12cm rise in sea level over 50 years takes a very acute observer.
So it comes down to what evidence do you accept? The primary evidence is from worldwide network of tide guages (publically accessible) which admittedly needs works to deal with subsidence and station changes. Why are these not convincing to you? Because of issues of land up/down, since the early 1990s, we have relied on satellite altimetry instead though the curves closely match the tide guages. If you dont accept the measurements of sealevel from altimetry, then does that mean you dont accept the results of all the other uses for satellite altimetry either?
So to disbelieve sea level rise, you have to deny also the measurements in tide gauges and satellites, that the oceans are warming and that the ice is melting. What kind of evidence would you believe?
You are indeed correct in that skepticism, as the contribution of river sediment delivered to the oceans is about 20 billion tons / year. This sums to about 6 km^3 / yr or ~0.017 mm / yr of sea level rise equivalent (which is about ~1/200 of the current rise rate).
So if the oceans are not rising significantly due to these natural displacement factors, why is it rising? What then are the actual measured major contributors to sea level rise?
Let’s look first at what current SLR levels are: 3.2 mm/year.
Let’s think about what that 3.2 mm/year actually represents, in terms of water volume: 1,184 cubic kilometers per year!
This means that every 5 years, the oceans are rising by the equivalent volume of twelve Lake Erie’s (484 cubic kilometers)! And over a 10-year period, the oceans will rise by a volume almost equivalent to that of Lake Superior! Wow! And that’s just at current rates of SLR!
So where are the various contributions to measured SLR coming from? Let’s look at that.
https://www.earth-syst-sci-data-discuss.net/essd-2018-53/
https://www.nature.com/articles/s41586-018-0179-y
https://www.the-cryosphere.net/12/521/2018/
http://iopscience.iop.org/article/10.1088/1748-9326/aac2f0/meta
https://agupubs.onlinelibrary.wiley.com/doi/abs/10.1002/2017GL074070
http://www.pnas.org/content/114/23/5946.abstract
https://www.the-cryosphere.net/11/1111/2017/
https://link.springer.com/chapter/10.1007/978-3-319-56490-6_5
http://advances.sciencemag.org/content/2/9/e1600931.short
https://agupubs.onlinelibrary.wiley.com/doi/10.1002/2015JF003550
Unfortunately, due to the measured increases in ice sheet mass losses coming from Antarctica (which have tripled since 2012 alone), the rates of SLR are themselves accelerating:
Per Nerem et al 2018:
http://www.pnas.org/content/early/2018/02/06/1717312115
Sea level rise components, from Cazenave et al 2018:
Just one other thought in the question on where land sinks or sealevel rises. Satellite altimetry measures sealevel with respect to the geoid rather than any definition of coast. This height measurement (often referred to ordinary use as "GPS Height" as height from GPS is likewise) can be determined for tide guages too so you can see whether they are moving up or down with respect to geoid.
Whoops! Brain fart. Altimetry and GPS measurements are made with respect to reference ellipsoid not geoid. Sorry about that. However, effect is same (a reference level independent of land up/down).
Thank-you! I am a skeptic of the best kind (one who can accept incontrovertible evidence) and you answers have sure gone a long way.
I calculated myself the expansion factor for 10 deg. (10 to 20) on the entire vol. of the oceans.
Avg. Depth calc done by dividing the surface area at 10 deg. 361740000.0000000000 by the Ocean Vol. 1350000000.0000000000
Doing the same calc at 20 deg. Vol. is then 1352015107.0416000000
Avg. depth at 10 deg C. 3.7319621828
Avg. depth at 20 deg C. 3.7375327778
Difference in Kms. 0.0055705950 or 5.57 metres!
The area that interests me now is the amount of water in vapour that the entire atmosphere can hold for the same amount of warming of the oceans. (10 to 20 deg.) I peronally believe it is a lot and possibly could create equilibrium for the expansion factor of the oceans vol.
[PS] Go for it, but if you think evaporation is offsetting thermal expansion, then you cannot close the water budget - the observed level of sealevel rise cannot be accounted for by observed loss of ice. What is so hard to accept about direct measurement of sealevel rise? Atmospheric water vapour and water vapour equilibrate very quickly. Observed change in water vapour in atmosphere matches the expectation from temperature rise.
bArt @14,
The volume of the ocean water is 1,388M cu km and water has a Coefft of Thermal Expansion of 0.000214. So a universal 10ºC temperature would increase ocean volume by 2.8M cu km, enough to raise the 361Msq km oceans by 7.9m. (This is entirely hypothetical so accuracy is of little consequence.)
The atmospheric water totals 12,900 cu km. An increase from 10ºC to 20ºC would roughly double the saturation vapour pressure. Thus increased humidity in the atmosphere would (assuming constant Relative Humidity) reduce the increased ocean volume by some 13,000 cu km (~0.5%) and the multi-metre SLR by 36mm. It would be a brave man who described this reduction as "a lot."
@15, I had intended to add a more realistic SLR for a 10ºC increase in global temperature.
IPCC AR5 Figure 13.14 (below, minus caption) shows SLR obtained from physical model simulations resulting from themal expansion (a&f), glaciers (b&g), Greenland ice cap(c&h), Antarctica ice cap (d&i) & Total (e&j) at equilibrium (LH column) & after 2,000 (RH column).
Thus a 10ºC increase in global temperature would more realistically see a 4.2m SLR from thermal expansion, reduced by 35mm due to greater evaporation.
Hi, doubting thomas is back again. This website https://hypertextbook.com/facts/2007/LilyLi.shtml states "There is a barrier between the surface water and deeper layers of the ocean that are not mixed. The barrier begins around 100 meters and can extend another few hundred meters downwards. There is a thermo cline meaning there is a quick change in temperature when entering the deeper surface of water. A CTD (Conductivity, Temperature and Depth) instrument (usually placed in the water from a ship or a platform) measures temperature in the deep ocean. Recordings have shown that the average temperature of water ranges from 0-3 degrees Celsius (32–37.5 degrees Fahrenheit)."
This to me means that only the upper levels of the ocean are being warmed and are therefore only expanding over a fraction of their volume. Has this been modelled anywhere that anyone knows about?
Hi bArt,
Your source of information is incorrect. There is a circulation into the deep ocean from both poles where cold surface water sinks all the way to the bottom of the ocean. This sinking water circulates around the world (on the bottom) and then re-emerges at other locations like the coast of Chile. Wikipedia thermohaline circulation explaination. I learned about the thermohaline circulation 50 years ago, it is not news to scientists.
The circulation in the ocean has been modeled. Recent data has shown that scientists underestimated the amount of heat that has been transferred into the deep ocean and the warming is worse than expected. It is typical for scientists to underestimate warming because they are conservative.
It is easy to raise quesitons about AgW if you ignore what scientists understand. I recommend that you stop wasting your time on skeptic disinformation.
bArt @17,
I wouldn't say (as @18) that the short essay by Lilly Li you cite is "incorrect." Rather it is saying (although not very well) that the surface ocean waters are well mixed while lower depths below this mixed layer require circulation to spread the warming. Circulation is a slower process.
Perhaps it would be worth explaining that the bottom of the ocean is 'cooled' rather than 'warmed'. You will be familiar with the high temperatures in the Earth's core. Puddled over the majority of the Earth's surface are the oceans & above that is an atmosphere with a temperature averaging 15ºC. Yet the ocean depths, sandwiched between the molten Earth's core and the sun-warmed atmosphere, are only just above freezing. (Until recently there was parts below 0ºC but reportedly this is disappearing.) So the only way the bottom of the ocean can be so cold is because something is keeping it cold. And that is salty cold water from the poles that tumbles down into the abyss.
Under AGW, the cooling of the ocean depths is less and the warming of the ocean surface is greater. So the whole ocean is warming. A quick look at OHC data shows the 600m ocean layer below the top 100m level (which contains the mixed layer) is warming at a third the rate of the surface 100m layer. Deeper down, the 700-to-2,000m layer is warming a sixth as quick as the surface 100m (these calculated from 1955-2013).
Recommended supplemental reading:
Ocean warming speeds vary with depth by Tim Radford, Climate Home, Jan 10, 2019
It's chock full of embedded references to scientific findings on the subject matter.
More on deep ocean heating and circulation in a paper just out. See here.
The determination of steric sea level rise is done by whole-of-ocean temperature rise as determined by observation, not back-of-the-envelope though admittedly deep-ocean temperature change is poorly constrained and the largest source of error in the estimates.
You are still failing to explain why you dont accept the direct observations of sea level rise (and for that matter ice loss). Any sort of modelling of sea level rise is seeking to understand the actual measurements not the other way round.
When you preclude yourself from reading the actual scientific literature and restrict yourself to contrarian sources, I can see why that might be the conclusion you have been guided to make.
However, the actual science knows that the ocean mixing layer in real life depends upon the time of the season, the location and even the extended weather patterns. Hence, the mixing layer can range from a few meters to the abyssal depths, aided by Ekman trnsport and the above conditions.
The oceans are warming, top-down. Per Cheng et al 2017:
More here.
Cheng and Zhu 2018 - 2017 was the warmest year on record for the global ocean
And, per Zanna et al 2019, global warming has heated the oceans by the equivalent of one atomic bomb explosion per second for the past 150 years (since 1871):
Background SKS posts to read:
scaddenp@21
Thanks for the link to the paper on OHC. In it, it states:
"Our reconstruction, which agrees with other estimates for the well-observed period, demonstrates that the ocean absorbed as much heat during 1921–1946 as during 1990–2015."
I take from that that as much heat was absorbed in the early 1900's as was being absorbed at the turn of the century (44 years later).
You wonder why I fail to explain why I dont accept the direct observations of sea level rise (and for that matter ice loss). Actually I do now accept both, but the extent and attendant risk are aguable. If people are to be forced by law to move away from coastal areas or suffer other penalty due to events that merely might happen, then it is bullying. Why not use education? It's worked on me so far. I used to be a denier (of sorts) although I still think that our planet has amazing self correcting and regulating abilities. There seems to be as much alarmist language as there is the opposite, lets just stick to verifiable facts.
My wife says it is merely the tail end of the huge cooling period (ice age) where the glaciers only continue doing what they have been doing for thosands of years.
Fox Glacier in New Zealand moves at approximately 10 times the speed of other valley glaciers around the world.
Fed by four alpine glaciers, Fox Glacier falls 2600 metres on its 13-kilometre journey towards the coast. It is 300 metres deep and its terminal face is just 5 kilometres from the township. Vertical schist rock walls on either side of the Fox Glacier valley are over one kilometre high. It is said that at one time Fox Glacier fed straight into the ocean, 13 kms. away. That means it's been receeding for quite some time.
Please point out any wrong facts or assumptions I make, thanks.
Gentlepeople:
On the subject of atmospheric water content, the measurement you want is "precipitable water" - the total water vapour in the atmospheric column, as if it were condensed and fell as rainfall. That will tell you how much it can contribute to sea level (or change).
This web site provides a map (updated daily?), showing values ranging from close to zero up to about 70mm.
https://eldoradoweather.com/climate/world-maps/world-precipitable-water.html
This web site gives similar data, and mentions that the global mean is 21.6mm.
https://www.sciencedirect.com/topics/earth-and-planetary-sciences/precipitable-water
If you account for the oceans only covering 2/3 of the world, that means that the 21mm could increase sea level by about 30mm. So, if you doubled atmospheric water vaour concentration (a huge change, much beyod what 3C of warming would cause), you'd lower sea level by 30mm.
Entirely consistent with MA Rodger's numbers in comment #15.
" If people are to be forced by law to move away from coastal areas or suffer other penalty due to events that merely might happen, then it is bullying."
Interesting. Where is that happening? This sounds like something out of a rightwing fake news. Moved by law?? Please provide a link. Insurance companies stand to lose money and so funnily enough study the science quite seriously. They are getting tetchy about properties in highly exposed areas.
" I still think that our planet has amazing self correcting and regulating abilities."
And yet the projected changes are well within past states for the planet. 400ppm of CO2 takes us back to the much warmer Pliocene when we didnt have ice ages. What is worrying about historical evidence, is that rate of change is very very high compared to past and fast rates of change in the past have been very bad for many species. What is informing your belief that the planet will be self-correcting? Hope or facts?
"Actually I do now accept both, but the extent and attendant risk are arguable."
What do you mean about extent? You are still doubting the current measurement of around 3.7mm/yr from satellite and tide guages? Or the more reasonable doubt about how high it go?
"My wife says it is merely the tail end of the huge cooling period (ice age) where the glaciers only continue doing what they have been doing for thosands of years."
The question to ask is why? Scientists are incredibly attached to conservation of energy and temperatures have to rise and fall for a reason. And there is a well understood reason. Past glacial cycles are orbital-driven and happen via mechanisms that only can only operate when other forcings (including and especially CO2 levels) permit persistance of winter snowfall in NH through summer when the orbital forcing result in low insolation. On that basis, instead of warming, we should be very slowly cooling. (see here for details). With CO2 at current levels, it is not going to happen. The change in insolation driving glacial cycle is large but changes at rate of a few milliwatts/m2/ century at latitude 65N. By comparison, greenhouse forcing is increasing at around 3 watts/m2 /century on average over the entire globe.
I know the Fox well (I am in Dunedin) and those West Coast valley glaciers have some special characteristics. There are two main drivers. On hand, the warming Tasman is increasing snowfall in the neve region pushing it forward, especially in El Nino. On other hand, the warming at terminus is increasing the melt rate. Its retreat/advance is the balance of those factors.
I still find it astonishing that you could contemplate some hand-wavy explanation instead the hard work of thousands of scientists accumulating data over decades.