


 Arguments


Rising Ocean Temperature: Is the Pacific Ocean Calling the Shots?
Posted on 5 September 2014 by Rob Painting
- Even though the ocean has warmed strongly, global 'surface' warming in the 21st century has been slower than previous decades. One of the prime suspects for this has been an increase in trade winds which help to mix heat into the subsurface ocean - part of a natural oscillation known as the Interdecadal Pacific Oscillation (IPO).
- A recently published research paper, Chen & Tung (2014), claim that changes in the saltiness (salinity) of seawater in the North Atlantic is responsible for the decadal-scale variation in ocean heat uptake, rather than the IPO, as increased saltiness makes surface water denser and therefore facilitates the sinking of water transported poleward.
- Chen & Tung's own analysis, however, shows that North Atlantic Ocean warming peaked in 2006 and has declined since that time whereas deep ocean warming, as a whole, has not.
- This new research affirms earlier work (Meehl et [2011] & Meehl et al [2013]) implicating the increased, albeit likely temporary, mixing of heat down into deeper ocean layers as a key contributor to the slower rate of surface warming in the 21st century.
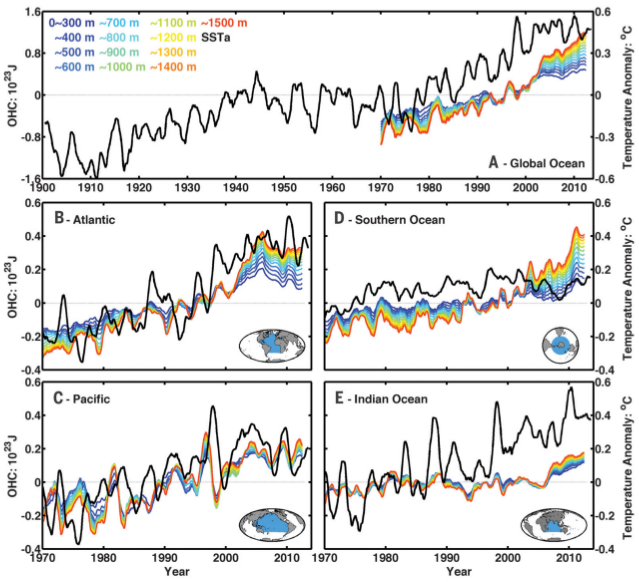
Figure 1 - Ocean heating rates for the global ocean and individual ocean basins down to 1500 metres. The coloured lines represent the various ocean layers. Notably the observations show greater warming in the deeper layers, with the strongest deep ocean warming occurring in the Atlantic & Southern Ocean. Image from Chen & Tung (2014).
Ocean Warming: Background Context
The oceans are currently warming because of the extra greenhouse gases that human industrial activity has added to the atmosphere. Not only do greenhouse gases trap heat in the atmosphere, but they alter the gradient in the cool-skin layer of the ocean, which results in less heat escaping the ocean and thus warming over time.
Despite this increasing greenhouse gas-induced warming of the oceans, the ocean doesn't warm in a linear manner due to a number of factors, one of these being a natural decadal-scale variation in the way heat is mixed into the oceans by winds - the Interdecadal Pacific Oscillation (IPO). The IPO is, essentially, an oscillation in the strength of winds (primarily the tropical Trade Winds) which promote the mixing of heat down into the ocean interior and thus affect sea surface temperatures.
The main mechanism for wind-driven mixing into the deep ocean (down to around 2000 metres) is via convergence of warm tropical surface water in the subtropical ocean gyres. These subtropical ocean gyres are large rotating masses of surface water which occupy the mid-latitudes of each ocean basin. Surface water is transported to the subtropical gyres because of the winds drag on the sea surface. Rather than travelling in the same direction as the trade winds, the net flow of water in the surface layers affected by the wind are 90 degrees to the direction of travel - to the right in the Northern Hemisphere, and to the left in the Southern Hemisphere. This occurs because the Earth is rapidly rotating beneath the surface currents and results in an 'apparent deflection'. The impact this has is very real however.
Figure 2 - annual wind stress (i.e. the average wind) for the global oceans between 1982-2004. The lime green splotches near the equator in each hemisphere depict the trade winds, and the areas from about 35° poleward show dominant mid-latitudes westerlies. From the location and direction of these dominant winds we get convergence of ocean currents at around 30-40° in each hemisphere. Image from NOAA GODAS.
As the warm tropical surface waters travel poleward they encounter an equatorward flowing current created by the mid-latitude westerlies and this surface convergence causes the centre of the gyre to pile up water mass. With nowhere else to go, the surface convergence forms a vertical current known as Ekman pumping (Ekman [1905]) which transports heat down to the depths. In order to maintain a balance, there is a return flow of water, at depth, back toward the equator and poles. Note that there is also poleward transport in the shallow currents at the western edge of each subtropical ocean gyre - known as western boundary currents.
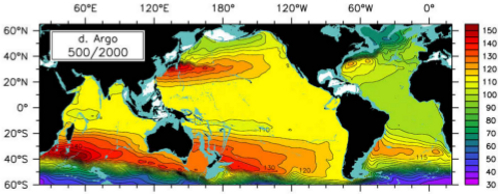
Figure 3 - A strengthening of the gyre circulation between 2004-2008 is indicated by the gain in steric height for the 500 decibar pressure level (near 500m) relative to 2000 decibar (near 2000m). Image adapted from Roemmich & Gilson (2009).
The Atlantic Ocean: A Driver, or a Passenger?
Chen and Tung (2014) analyse the ocean heat content data maintained by a Japanese research group, Ishii et al (2005), and make a number of statements about the cause of multi-decadal fluctuations in ocean heat mixing rates. Chief among these claims is that the change in salinity in the North Atlantic ocean is responsible for the decadal fluctuations, not changes in the trade winds and mid-latitude westerlies (the IPO) - as suggested by Meehl et al (2011), Meehl et al (2013) and England et al (2014) for instance. One of the rationales given by Chen & Tung for dismissing the role of the IPO in deep ocean warming is the expectation that the Pacific Ocean basin should have warmed more during the current (2000-to present) IPO negative phase. In a press release Tung states:
“The finding is a surprise, since the current theories had pointed to the Pacific Ocean as the culprit for hiding heat”
And in the paper itself the authors write:
"Nevertheless, neither data set supports the model result of Meehl et al. that the heat uptake in this layer (300-700m) in the Pacific dominates over other ocean basins during hiatus periods."
This is not quite correct. As shown in figure 4, Meehl et al's climate model simulations had the bulk of the ocean heat storage occurring in the Southern Ocean and the Pacific, but most deep ocean storage during IPO-equivalent decades was in the Atlantic and Southern Oceans. Two reasons why this should be so in the real world are that, first, the Southern Hemisphere subtropical gyres are situated mostly in the Southern Ocean and South Atlantic, and second, that some of the heat coming into the Pacific Ocean basin doesn't actually stay there. Not only is heat transported poleward to, and via, the gyres, and there's only one subtropical gyre in the Pacific (the North Pacific), but there is 'leakage' out of the Pacific with currents travelling through the Indonesian Archipelago into the Indian Ocean. And 'leakage' out of the Indian Ocean and Pacific Ocean (via the Drake Passage) into the Atlantic (Dong et al [2011], Backeberg et al [2012]). Additionally, the Atlantic Ocean is the only basin in which there is an equatorward warm surface current (part of the Meridional Overturning Circulation) and this ultimately carries heat to the North Atlantic - where it sinks.
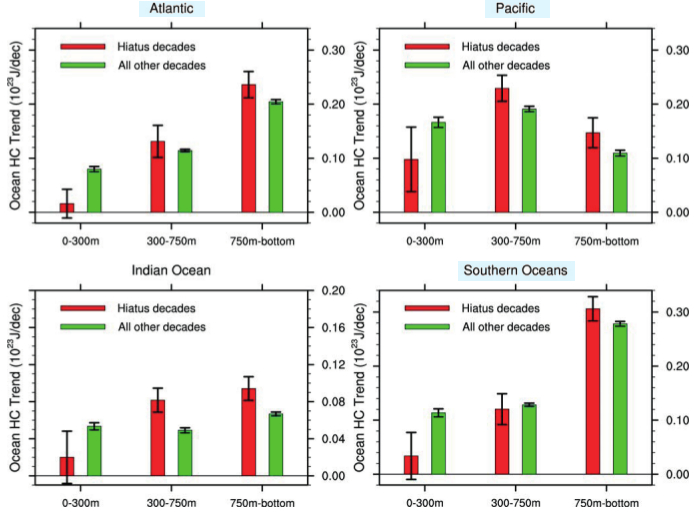 Figure 4 - ocean heating rates for each ocean basin for hiatus decades (little or no warming) and all other decades in the climate model experiments carried out in Meehl (2011).
So, despite most of the heat entering into the ocean via the Pacific, there's no realistic expectation that all the heat storage during the current negative phase of the IPO would be stored there. The NCAR climate model used by Meehl et al may not simulate the duration of the IPO (each phase being only around 10 years long instead of 25-30 years) and the exact manner of ocean heat storage correctly, but it has simulated the majority of deep ocean storage taking place in the Southern and Atlantic Oceans. The extraordinary intensity of the trade winds in recent times (Merrifield [2011], England et al [2014]) may go some way toward explaining these discrepancies, or maybe the climate model is just deficient in this regard.
The Salinity Mechanism
Chen & Tung claim that changes in salinity in the North Atlantic is the driver of decadal variation in ocean mixing, rather than the IPO. Unfortunately the authors provide no analysis or specifics to back up this claim. Nor do they provide an explanation as to why, when North Atlantic warming and salinity has decreased since 2006, total deep ocean warming has continued. The Atlantic Meridional Overturning Circulation (AMOC) - the transport of warm tropical surface water northward - is indeed propelled by dense water sinking in the North Atlantic and travelling equatorward in the deeper layers, but it also has a wind-driven component to it.
A more likely explanation for strong warming in the North Atlantic, and one that would explain many of the worldwide observations, is that the strengthening trade winds from the mid-1990's onwards are mainly responsible. As the North Atlantic subtropical gyre spun-up in response to the trade wind-forcing, the gulfstream, the powerful ribbon-like western boundary current travelling north along the North American coast at the edge of the gyre, intensified. A greater-than-normal volume of warm salty tropical water was transported north with the current and this was drawn down into the ocean in the region around 60°N - where dense water sinking occurs.
In a negative IPO phase we should expect to see two regions of heat downwelling in the North Atlantic; in the area where dense water sinking takes place (near 60°N), and beneath the North Atlantic subtropical gyre (between 30-40°N) where surface convergence occurs. This is shown to be the case in Chen & Tung's analysis.
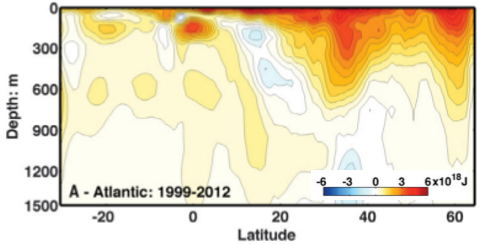
Figure 5 - Atlantic ocean warming down to 1500 metres for the 1999-2012, a period covering the majority of the current negative IPO phase. Image adapted from Chen & Tung (2014).
Accelerated Surface Warming May Come Sooner Than Expected
In the concluding paragraph of their paper, Chen and Tung write:
"The next El Nino, when it occurs in a year or so, may temporarily interrupt the hiatus, but, because the planetary heat sinks in the Atlantic and Southern Oceans remain intact, the hiatus should continue on a decadal scale"
The authors are referring to the slowed rate of surface warming since 2000. They maybe right about it continuing for a while yet, but their analysis may also suggest a rather different outcome. As mentioned previously, the North Atlantic warming and salinity anomaly peaked in 2006 and declined up to 2012 - the end of the analysis period. As Chen & Tung quite rightly point out, the extensive warming in the North Atlantic ocean (and the ongoing disintegration of the Greenland ice sheet) should have caused an influx of freshwater and made surface waters there more buoyant - perhaps slowing the sinking of dense water. This could help explain the slowdown of the Atlantic Meridional Overturning Circulation (AMOC) from 2006 onwards, but regardless, the slow down of the AMOC might help shift the climate system back toward the positive IPO phase.
Perhaps the quickest way of illustrating this, without going into a long-winded explanation, is to look at the 'accelerated warming decades' from Meehl (2013) - an analogue for the positive phase of the IPO. Characteristic features of 'accelerated warming decades' are anomalous cooling on the surface of the North Atlantic subpolar gyre (a clockwise circulating gyre south of Greenland), and cooling of all the subtropical ocean gyres as they begin to spin-down in response to the weak wind-forcing. The reason for the decline in sea surface temperatures at these locations is because of the reduced heat transport along the ocean surface from the tropics - where solar heating is most intense.
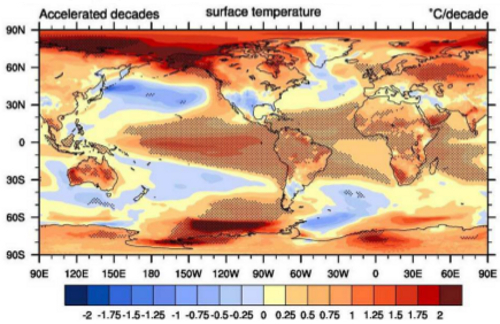
Figure 6 - surface temperatures for accelerated warming decades (positive IPO phase) in the CCSM4 climate model. Image adapted from Meehl (2013).
Not only has the AMOC slowed down (Cunningham et al [2013]), but sea surface temperatures in North Atlantic subpolar gyre have begun falling, as have sea surface temperatures in the North Pacific subtropical gyre - best illustrated by the Pacific Decadal Oscillation (PDO) being strongly positive this year. These observations hint at a slow down in the transport of heat from the tropics - at least in the North Atlantic and North Pacific. Whether they are just aberrations or an indication of a forthcoming change in phase of the IPO will become clearer in time.
Global Warming Stuck on 'Play'
The global oceans comprise some 93.4% of Earth's global heat reservoirs, and despite a slower rate of surface warming over the last 16 years, the atmosphere has still warmed and the oceans have warmed even more strongly than before. As revealed by earlier research (Levitus [2012], Nuccitelli [2012] & Balmaseda [2013]), not only are the oceans warming, but the deep ocean is warming in an unprecedented manner.
Building on earlier work, the climate model examined by Meehl et al (2011) & (2013) demonstrated that hiatus decades (decades in the model with little or no surface warming) occurred when anomalous heat was being taken up by the deep ocean. The pattern of surface temperatures in the hiatus decades is very similar to the negative phase of the Interdecadal Pacific Oscillation (IPO). So, despite some discrepancies, the model implicates the IPO as one of the causes for the slower surface warming.
Since Meehl et al's initial study, a handful of papers have been published tending to support their key findings (e.g. Kosaka & Xie [2013]) Although these authors intimate otherwise, Chen & Tung (2014) is another paper in that vein. They confirmed that the oceans have warmed substantially, most notably in the deeper layers, and that the strongest warming during this current negative IPO phase has been in the deep of the Southern and Atlantic Oceans. In so far as their proposed salinity mechanism as a driver for the decadal variation in ocean heat mixing is concerned, they provide little in this paper to support it.


Sorry to go off-topic here but it appears that the denialosphere (one blogger in particular who shall remain nameless) have already picked up on SKS's sidebar gray flash countdown thingy. They are hurling insults already without even knowing what it's for. (what IS the meaning of it?)
Jen.
[JH] "Patience is a virtue."
FYI - The comment threads for Weekly Digests and News Roundups are open threads.
Excellent!
Thank you Rob.
Reposted at: citizenschallenge.blogspot.com/2014/09/global-warming-wheres-heat.html
Thanks. Interesting article. So the hiatus could end soon or go on for another 15 years?
Would it be the case that because the heat is going down deep and at mid latitudes the thermal expansion would be reduced? This would be because it's occuring at low temperatures and the coefficient of expansion gets smaller as it approaches 0 deg C.
BC
Yep! Sea level rise with heat accumulation isn't anywhere nearly as simple as X Joules = Y millimeters. Here is another mechanism that might be involved. As heat moves to diferent points in the ocean this influences the how much density change occurs in different locations. In turn this impacts on the gravitational effect that each part o the ocean has on every otherr ppat, prhaps altering the Geoid slightly. And this might inflluence the rrate of the earth's rotation ever so slightly, in turn influencing how much the oceans bulge out at the equator.
These efects might be small but they highlight that sea level is not simple.
In the label of Fig. 1 you write that it shows the Ocean heating rates. Are the rates or the total heat content plottet in the graphs? I took it for the absolute change of heat content relative to a time average.
I find it interesting to see that the HOC is increasing the strongest around antartica in the deep while the see ice area (not volume) shows slight increase and surface temperature is more or less constant. Are there any effects on ocean currents expected from a changing gradient in this region?