Climate Science Glossary

Term Lookup

Enter a term in the search box to find its definition.

Settings

Use the controls in the far right panel to increase or decrease the number of terms automatically displayed (or to completely turn that feature off).

Term Lookup

Settings


All IPCC definitions taken from Climate Change 2007: The Physical Science Basis. Working Group I Contribution to the Fourth Assessment Report of the Intergovernmental Panel on Climate Change, Annex I, Glossary, pp. 941-954. Cambridge University Press.

Home Arguments Software Resources Comments The Consensus Project Translations About Support

Twitter Facebook YouTube Mastodon MeWe

RSS Posts RSS Comments Email Subscribe


Climate's changed before
It's the sun
It's not bad
There is no consensus
It's cooling
Models are unreliable
Temp record is unreliable
Animals and plants can adapt
It hasn't warmed since 1998
Antarctica is gaining ice
View All Arguments...


Username
Password
New? Register here
Forgot your password?

Latest Posts

Archives

Is sea level rise accelerating?

What the science says...

Looking at global data (rather than tide gauge records just from the U.S.) show that sea level rise has been increasing since 1880. The recent rate of sea level rise is greater than its average value since 1930. As for future sea level rise, these predictions are based on physics, not statistics.

Climate Myth...

Sea level rise is decelerating

"A former research director with the Army Corps of Engineers and a former civil-engineering professor at the University of Florida decided to put the sea-rise claims to the test. They gathered U.S. tide-gauge readings from 57 stations where water levels had been continuously recorded for as long as 156 years. The result did suggest the sea level was increasing in the western Pacific, but this was offset by a drop in the level near the Alaskan coast. “Our analyses do not indicate acceleration in sea level in U.S. tide gauge records during the 20th century,” the study’s authors concluded. “Instead, for each time period we consider, the records show small decelerations that are consistent with a number of earlier studies of worldwide-gauge records." (Washington Times)

A paper by Houston & Dean studies 57 tide gauge records from the U.S. (including Hawaii and oceanic territories) and concludes that sea level rise has not accelerated. In fact the authors seem to go out of their way to state that the average result shows deceleration at every opportunity. But there are some big questions about their analysis. Why do they use tide gauge records from just U.S. stations? Why not a global sample? Why use individual tide gauge records when we have perfectly good combinations, from much larger samples, which give a global picture of sea level change and show vastly less noise? Why do they restrict their analysis to either the time span of the individual tide gauge records, or to the period from 1930 to 2009? Why do they repeatedly drone on about “deceleration” when the average of the acceleration rates they measure, even for their extremely limited and restricted sample, isn’t statistically significant?

But the biggest question of all is: what’s the big deal?

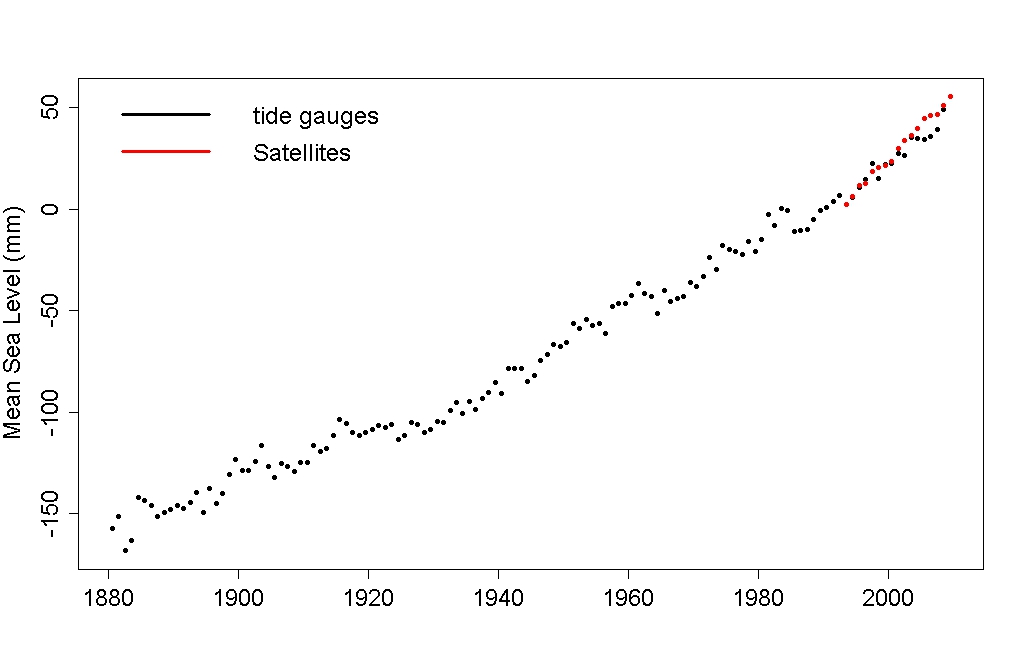
Here’s some sea level data, in fact two data sets. One is a global combination of tide gauge records by Domingues et al. (2008). Using around 500 tide gauge records globally, it’s the latest version of the “Church & White” dataset. The other is satellite data:

I averaged the two data sources during their period of overlap, and computed a smoothed version:

This is a global data set, and it’s a worldwide average so its shows vastly less noise than individual tide gauge records. We could even use it to look for acceleration or deceleration in sea level rise. But one thing we should not do is restrict consideration to the quadratic term of a quadratic polynomial fit from 1930 onward. That would be pretty ignorant — maybe even misleading.

As so often happens, one thing to be cautious of is that the noise shows autocorrelation. As Houston & Dean point out, the Church & White data since 1930 are approximately linear, so to get a conservative estimate of the autocorrelation I used the residuals from a linear fit to just the post-1930 data and fit an ARMA(1,1) model.

If we compute the linear trend rate for all possible starting years from 1880 to 1990, up to the present, we get this:

According to this, the recent rate of sea level rise is greater than its average value since 1930. Significantly so (in the statistical sense), even using a conservative estimate of autocorrelation. But the increase itself hasn’t been steady, so the sea level curve hasn’t followed a parabola, most of the increase has been since about 1980. How could Houston & Dean have missed this?

Here’s how: first, they determined the presence or absence of acceleration or deceleration based only on the quadratic term of a quadratic fit. That utterly misses the point. Changes in the rate of sea level rise don’t have to follow a parabola, since 1930 or any time point you care to name. In fact, by all observations and predictions, they have not done so and will not do so.

Second, by using individual tide gauge records, the noise level is so high that you can’t really hope to find acceleration or deceleration of any kind, with any consistency. Not using quadratic fits, and certainly the non-parabolic trend which is present can’t be found in such noisy data sets.

Even so, we can also fit a quadratic (as Houston & Dean did), and estimate the acceleration (which is twice the quadratic coefficient):

Well well … it looks like starting at 1930 is the way to get the minimum “acceleration” by this analysis method. Could that be why Houston & Dean chose 1930 as their starting point?

If we restrict to only the data since 1930, as Houston & Dean did, and fit a quadratic trend, we get this:

Can you tell, just by looking, whether it curves upward or downward? Clearly, the parabolic fit doesn’t show much acceleration or deceleration, if any. We can get a better picture by first subtracting a linear fit, then fitting a parabola to the residuals?

That answers the question: the quadratic fit shows acceleration in the Church & White data. But, when autocorrelation is taken into account, the “acceleration” is not statistically signficant.

But — just because the data don’t follow a parabola, doesn’t mean that sea level hasn’t accelerated. Let’s take those residuals from a linear model, and fit a cubic polynomial instead:

Well well … there seems to be change after all, with both acceleration and deceleration but most recently, acceleration. And by the way, this fit is significant.

And now to the really important part, which is not the math but the physics. Whether sea level showed 20th-century acceleration or not, it’s the century coming up which is of concern. And during this century, we expect acceleration of sea level rise because of physics. Not only will there likely be nonlinear response to thermal expansion of the oceans, when the ice sheets become major contributors to sea level rise, they will dominate the equation. Their impact could be tremendous, it could be sudden, and it could be horrible.

The relatively modest acceleration in sea level so far is not a cause for great concern, but neither is it cause for comfort. The fact is that statistics simply doesn’t enable us to foresee the future beyond a very brief window of time. Even given the observed acceleration, the forecasts we should attend to are not from statistics but from physics.

Many thanks to Tamino from Open Mind for allowing us to republish his post So What?

Advanced rebuttal written by Tamino


Update July 2015:

Here is a related lecture-video from Denial101x - Making Sense of Climate Science Denial

This rebuttal was updated by Judith Matz on September 13, 2021 to replace broken links. The updates are a result of our call for help published in May 2021.

Last updated on 8 July 2015 by pattimer. View Archives

Printable Version  |  Offline PDF Version  |  Link to this page

Argument Feedback

Please use this form to let us know about suggested updates to this rebuttal.

Comments

1  2  Next

Comments 1 to 25 out of 45:

  1. From above: Here’s some sea level data , in fact two data sets. One is a global combination of tide gauge records by Domingues et al. (2008, Nature, 453, 1090-1094, doi:10.1038/nature07080). Using around 500 tide gauge records globally, it’s the latest version of the “Church & White” dataset. The other is satellite data: ... If we compute the linear trend rate for all possible starting years from 1880 to 1990, up to the present, we get this: The above chart, as I understand it, uses data from 1880 all the way up to the present, but the plot only covers 1880 to 1990. The last 20 years have been left off. If the plot were to continue right up to the present the time line would become very erratic as the sample size approaches unity and becomes meaningless. Essentially large sample sizes early in the time line are compared with numerically smaller samples of more recent data. In everyday language, it's comparing apples and oranges. The cutoff at 1990 would indicate that a 20 sample size is appropriate. So why not look at 20 year slices of trend rate back through time and see how they compare? And lets use all of the data all the way to the present. So if we compute the linear trend rate for all possible 20 year periods starting with 1807 - 1827 then 1808 - 1828 and so on up to the present, we get this: An entirely different picture is painted when each data point represents an equal sample size. The early years are erratic because of a small number of tide gage records. The above link "some sea level data" didn't work for me, I used data from the PSMSL that dates from 1807 from over 1200 tide gages. The data is grouped and averaged by coastlines and the median value take for each year in the time line. I assume that the Church & White/satellite data would plot out in a similar fashion as above.
    Response:

    [DB] From Church & White 2011:

    C&W 2011 SLR


    And using 16-years trends:

    C&W 2011 SLR

    [Source]

  2. Steve Case @1, the PMSL site warns that its data has not been adjusted for Glacial Isostatic Rebound, a caution you should have taken to heart. As it happens, the data set not only has very few stations predating about 1930, but they are not geographically representative. Rather, they are taken almost entirely from the East Coast of the United States, and northern Europe. The East Coast of the US and the southern shore of the Baltic are both experiencing strong local rises in sea level due to the Glacial Isostatic Adjustment, significantly biasing your sample. Indeed, even as late as 1980, there are just 5 stations in South America, and 2 in Africa (both in Morrocco). So at no time interval of your data set is a simple mean geographically representative, and through out the time period trends are as much a function of increases in station numbers in various areas as they are a feature of the actual record. If you where to apply your analysis to the Domingues et al data set, and come up with a similar result, you may then have a valid criticism. As it stands you do not even raise an interesting question.
  3. Tom, It's not the data, it's the method. Piling 130 years worth of data into a data point from 1880 and comparing it to a data point from 1990 made up of only 20 years worth of data and then omitting the plot for the last 20 points in the time series, does not make any sense. The graph from such a scheme leads one to believe that sea level rise during earlier periods showed no variation from year to year. That is not the case. At the moment I have no way of downloading the data from the link above. Otherwise I would have used that data to create the plot. I have run the Peltier GIA adjustments on the GLOSS sites from the PSMSL and all it does is increase the slope by about 0.5 mm/yr.
  4. Steve Case: Did you read the original post? This is a repost of one written by tamino; it is used here as a rebuttal of work by Houston and Dean. Tamino is simply (and quite effectively) making the point that the authors' conclusions - that sea level rise is linear - are unjustified. The key point is in his last paragraph: the forecasts we should attend to are not from statistics but from physics.
  5. Steve Case: You have fallen into the usual trap of looking first for correlation, and then assuming there must be some mystical if undefined causation behind it. The better approach is to anticipate a cause, through an understanding of the mechanics and physics of the system, and to make a hypothesis, and then to either confirm or refute that hypothesis through correlation (or lack of correlation) in observations. The distinction between the two methods is dramatic, necessary, and where so many denial efforts fail before they even get out of the gate, because the former methodology is founded on ignorance and superstition rather than education and logic like the latter.
  6. Steve Case @3, even if the method were appropriate, the fact that you use unrepresentative data both in time and space means your analysis is not indicative of global twenty year trends in sea level rise. Go to the PSMSL page on relative trends, and use the slider on the bottom and you will see what I mean. Take on example. In 1930, East Asia is represented by just six gauges, all in Japan. By 1970 it is represented 88, mostly in Japan and South Korea. At no time is a simple mean representative of East Asia geographically, and the weight assigned to East Asia (or more particularly Japan) in a global average changes continuously over the period 1930 to 1970. So, while I am not disputing your use of successive 20 year trends as a means of establishing the change in global trends, I am disputing your use of a data set which is never geographically representative, and which changes the representation of various regions over time in order to determine those trends. As ever, DB provides the best information, and you would do well to look carefully at the second figure (fig 8) in his inline comment. Applying 16 year trends on a consistent and representative data set shows a very distinct pattern to that shown from your simple mean of the PSMSL data set.
  7. #6 Tom Curtis. Tom, Thank you for not disputing the use of twenty year trends as a means of establishing the change in global trends. What about disputing the use of ever shorter trends as a means of establishing that change? That's what Tamino has done when he computed the linear trend rate for all possible starting years from 1880 to 1990, up to the present. The resulting graphic effectively ignores any changes in global trends early in the century and magnifies more recent changes. Had the graphic included points derived in that manner since 1990 the magnification and distortion would been gross and apparent. The PSMSL data is arranged by coast line and geographic coordinates which allows the user to perform more than a simple mean. There are 167 coastlines reported. Coast lines have anywhere from one to 77 reporting stations. For each coast line for each year I took the average. The geographic coordinates allow an estimate of each coastline size and application of an appropriate weight for each. For each year I took the median of all 167 coast line averages. That's not to use your assessment, a simple average. I also applied the Peltier GIA adjustment to the GLOSS stations. I found out that it increases the slope by about 0.5 mm/yr but does not otherwise change the shape of the timeline. I would like to analyze the Domingues et al data of those around 500 tide gages. But as is the case in many data files, special programs are needed to unlock them. And so far they are unavailable to me. By the way, the PSMSL data is over 1200 tide gages. I intend to ignore any further critiques you have about the PSMSL data as it's not the issue. And the issue is method. Using unequal sample sizes as Tamino did that magnify recent changes and ignore earlier ones results in a gross distortion.
  8. Steve Case @7: 1) You say:
    "What about disputing the use of ever shorter trends as a means of establishing that change? That's what Tamino has done when he computed the linear trend rate for all possible starting years from 1880 to 1990, up to the present."
    That is not what Tamino has done. Tamino is testing a particular claim, ie, that the rate of change in global sea level has decelerated over the course of the twentieth century (or at least since 1930). Plotting the trend to end point for each year in succession will, as you suggest, exagerate the magnitude of more recent trends relative to older trends. It will show greater variability in the more recent trend. But it will not determine whether the recent trends are larger than the long term trend, or smaller. If in fact the rate of change of sea level was decelerating as is claimed by Houston and Dean, then the most recent trends would be smaller than the long term trends, and plotting a graph such as Tamino's third figure will show a steady line falling away towards zero at the end. So if that is your point, you have no point. You would do well to reread Tamino's post and pay attention to the other more important statistical techniques Tamino applies to determine the evolution of the rate of change of sea level over the 20th century. 2) If you want to introduce your chart as evidence, you need to defend its construction. If you don't want to defend its construction, you ought to withdraw it. As it stands, however, it appears you want to make use of a graph in which artifacts of the data will introduce a very large amount of noise. If you are simply trying to make a logical point about Tamino's analysis, I do not understand why you insist on the accuracy of your graph when you could make the same points using the graph provided by DB inline @1. You, however, insist on sticking with your graph, which makes me suspect some feature of that graph is important to the point you are trying to make. But to the extent that your graph differs from that supplied by DB, there is very good reason to think that the difference is due to noise introduced by your methods.
  9. Ok, if you want to discuss things that are not, the title of this discussion is: Is sea level rise accelerating? If you go to the CU Sea Level Research Group you will find this chart: and a link to the data: Raw data (ASCII) If you plot that data out in Excel with 60 day smoothing just like Colorado Research Group's chart and add a second order polynomial Trend Line instead of a linear trend, it will look like this: I would say that according to that sea level is not accelerating.
    Response: [mc] Reset image width to 450
  10. Steve Case#9: "add a second order polynomial Trend Line" Add all the higher orders you like, but be sure to check if they are statistically significant add-ons. That's exactly what was done by tamino; apparently you still have not read that post in full. That would be far more conducive to a rational discussion than any further announcements of your intent to ignore relevant critiques. In the quest for significance, you would do well to consider the work of Kemp et al 2011: Sea level was stable from at least BC 100 until AD 950. Sea level then increased for 400 y at a rate of 0.6 mm/y, followed by a further period of stable, or slightly falling, sea level that persisted until the late 19th century. Since then, sea level has risen at an average rate of 2.1 mm/y, representing the steepest century-scale increase of the past two millennia. I'd suggest, as others threads already have, that long-term pattern is described accurately as 'accelerating.' And that does not even reflect the 3.2 mm/yr from the graph you posted above.
  11. Steve Case @9, congratulations. You have taken a curve bracketed by the Mount Pinatubo eruption at one end, a cluster of strong La Nina's a the other, and with a number of strong El Nino's in the middle. Unsurprisingly the rate of sea level rise from the Pinatubo low to the El Nino highs is slightly greater than the rate from the El Nino highs to the La Nina lows. If you take a longer data set, as Tamino did you find that sea level rise is accelerating, just as Tamino shows. Now you may insist that we should pay more attention to the shorter trend. However, the shorter trend shows a strong dependence between mean sea temperatures and sea level heights. That is not a comforting thought for the future.
  12. I posted the full satellite record.
    Response:

    [DB] In your desire to prosecute your agenda, you continue to cherry-pick by only using a small portion of the data available. 

    That is muoncounter & Tom Curtis' point, and the entire point of this post you are commenting on.

    If you want to be taken seriously, you will have to rectify that & address the totality of the data, as Tamino did.

  13. Tamino did not address the totality of the data, he left off the last 20 years. He used 1880 to present for his calculations, but only graphed them up to 1990. Had he actually addressed the totality of the data in his graph it would have had a time line up to the present and the distortions would have been plainly obvious.
  14. Steve Case @13, on the contrary, Tamino carries his data through to 2009, which considering that the data comes from a 2008 paper clearly shows a commitment to using all the available data. The first graph only goes to 1990 because it graphs from the indicated year to the present (2009). 1990 represents the most recent year on that basis for which the data supports a trend of at least 20 years. Short term trends, in climate science, are almost all noise and so of no interest.
  15. In an earlier post I said I was having trouble downloading the data from the link provided by "Here’s some sea level data" in the "What the Science Says" lead at the top of this page. If you follow that link you will come to a page with a table at the bottom. The links in that table aren't accessable to the average user. My son is an IT professional and he told me it was very difficult and stopped before he got any useful information. The links that do download on that page are buried and barely recognizable as links in the text near the top. Well anyway I've got the data now (-: So I ran the obvious comparison against the analysis I had done of the PSMSL data and got the following result: And indeed, the Church and White data obviously shows an increase in the rate in sea level rise over the last century. I don't need an analysis from Tamino to tell me that. The difference in the two timelines has to come from the decisions Church and White made as to what data to include, and what data to omit. All of the data used is available at the PSMSL site, it's just a matter of figuring out what Church and White omitted. ( -Snip- ) We are told in the paper that "Careful selection and editing criteria, as given by Church et al. (2004) were used." And the 2004 opus, a pay per view link, provides an abstract that doesn't touch on editing criteria. So as far as I'm concerned, it's essentially a "Black Box" that decided what data to omit. I will probably do some sort of sampling as the downloaded data tells us what years were included and I will have to determine what the omitted data is and what that does to the slope. For example, at random I chose the first station I found where the available data was truncated: Station ID 1234 Station Name SIROS Data available 1969 - 2009 Data used 1974.042 - 2009.958 Omissions 1969; 1971; 1972 Change in slope +1.8 mm/yr. A random sample of 30 would give me a good idea, but as I say, I know what I'm going to find, it's a question of what was the criteria for data selection? And why does that criteria tend to skew the results one way?
    Response:

    [DB] Speculations into motive snipped. Either formulate a comment that doesn't cast aspersions into other's integrity or don't post here.

    Future comments containing such speculations and aspersion will be deleted outright.

  16. It seems to me that this question is ambiguous. Without a uniform starting line, either could be shown to be true. While no is arguing that sea level has not accelerated since the end of the little ice age (where sea levels actually dropped), the tidal gauge data since 1880 has shown an overall acceleration. The cubic fit to the residual linear curve shows that acceleration and deceleration of sea level rise followed the temperature during the 20th century. Clearly the sea level has accelerating since 1980. However, in the even shorter term, sea level rise as decelerated since 2000.
    Response:

    [DB] In your ongoing desire to prosecute your agenda, you continue to cherry-pick by focusing on a small, statistically insignificant, portion of the data available.

  17. #15: you suggest bias when you haven't even read the paper that contains the methodology? Of course it's a 'black box' if you don't bother to read the literature... so is nearly all of science. It took me less than a minute to locate the data, extract it and put it on a spreadsheet. OTOH, we don't know what data you used for your trend, as you do not say. Given the large variations present, I suspect it's a small sample.
  18. #17 Sky Watcher, The methodology we are told involves "Careful selection and editing criteria, as given by Church et al. (2004) And as I pointed out in my post, Church et al (2004) is a pay per view opus with no reference to criteria in the abstract. You extracted the raw PSMSL data in less than a minute? I'm impressed. Yes, the Church & White data, once you find the nearly hidden link downloads into Excel in about a minute. I used the raw PSMSL data that you get from the PSMSL website http://www.psmsl.org/data/obtaining/ Here’s the link to data for Station #1, Brest France: http://www.psmsl.org/data/obtaining/rlr.annual.data/1.rlrdata It's not a small sample, there are over 1200 tide gages listed in the PSMSL I used them all. Church and White only used about 500 and then selected only portions of the data according to their criteria in Church et al. (2004) that I don't have access to without paying money. What this graphic shows is the difference between my straight forward analysis by grouping raw data by coastline as opposed to using an editing criteria on the raw data first. Church and White then took that edited data and further applied it to a gridded map using the latitude and longitude coordinates given in the PSMSL. But the raw data was edited first. I think it's the editing criteria that produces the difference in the time lines above. I doubt that the application of gridded data has much to do with it. I agree that some of the data is out of whack, if you look up Cyprus in the PSMSL for example, you will find that it's way off. But I have no idea why Church and White edited station #1234:
      Station ID 1234 Station Name SIROS Data available 1969 - 2009 Data used 1974.042 - 2009.958 Data not used 1969; 1971; 1972 Change in slope +1.8 mm/yr.

    Maybe some one who has plunked down the cash for Church et al. (2004) can summarize what the editing criteria is.

    Response:

    [DB] If you were perchance to take the attitude of genuinely trying to research this instead of ascribing untowards motives to those publishing research and if you perchance were to genuinely ask for help when stuck instead of just airing complaints about paywalls, then perhaps someone might help you.

    Like pointing out that Church et al 2004 was available for free opus download from the publisher, Journal of Climate:

    http://journals.ametsoc.org/doi/pdf/10.1175/1520-0442%282004%29017%3C2609%3AEOTRDO%3E2.0.CO%3B2

    Or that the data for Church et al 2004 appears to be available for free opus download at:

    ftp://ftp.marine.csiro.au/pub/white/recons_1950_2001_ib_gia_remseas.nc.gz

    Briefly, this data set is

    • near-global (65°S to 65°N) from January 1950 to December 2001
      on a 1° × 1° × 1 month grid
    • seasonal signal removed
    • inverse barometer correction made
    • GIA (Mitrovica) correction made to tide gauge data

    I'm certain you have been doing the above per established standards in your analysis.

    Total time to research this:  6 minutes

    Total time to write this up:   7 minutes

  19. #11 Tom Curtis You complained that this posting of the complete satellite record included the effects of volcanoes, El Niño and La Niña so I took them out to see what it would look like: I'd say that it didn't have any effect. I'd say that according to the satellite record, the rate of sea level rise is not accelerating.
  20. [DB] Thank you for the link to Church (2004)
    Response:

    [DB] You're welcome; anytime.

  21. 19, Steve Case, I'd say that you're taking far, far too short a time period to draw such a conclusion, and completely missed the point about Pinatubo and the ENSO events. There is no way to "subtract" them as you have, and even then... you left in the La Nina events that Tom was referring to, i.e. those from 2007 to the present. Because Pinatubo occurred at the beginning of your series it artificially depressed temperatures. Once that effect tapered off, the system rebounded, gaining the energy it had temporarily shunned. The end result is a more rapid increase in temperature in that time span (i.e. the beginning of your selected period), and in turn a more rapid sea level rise. The end of your series, conversely, includes an unusual series of La Nina events from 2007 to the present. This very brief period of apparent cooling will naturally retard sea level rise in the short term at the end of your curve. So you have selected a period where there is an artificially exaggerated increase at the beginning (a steep slope) and an artificial leveling at the end (a shallow slope). It is no surprise to anyone that you are able to "fit" the curve that you have, but that fit is meaningless. You need to use longer time frames. You need to be careful about using a biased selection of end points.
  22. #21 Sphærica La Niña and El Niño occur all the time. Here's a link to a NOAA page that lays it all out since 1950 Here's a graphic and trend of that data since 1993 The trend is down over that period of time. Pretty much as you say. Volcanos come and go. Sea level is what it is over that same period of time. The satellite record date happened to start in 1993. That's the way it is. That you want to complain about it is isn't anything I can do much about.
    Response:

    [DB] "The satellite record date happened to start in 1993.  That's the way it is.  That you want to complain about it is isn't anything I can do much about."

    You continue to cherry-pick by only using a small portion of the data available.  Satellites only represent a portion of the data available to us.  The consiliance of these datasets paints a different picture:

    C&W 2011 SLR

    Your laser-focus on the most recent period of data while ignoring that which came before it blinds you to the larger trend while magnifying the natural variability inherent in the system.

    In a nutshell, you can't see the forest because you have a tree in the way.  That's the way it is.

  23. Steve - we've got a few posts on sea level rise coming up. I agree with you sea level rise in the 'noughties' has tapered off somewhat. But we, no doubt, disagree on what that really means. I'm awaiting on news on publication of a couple of papers on aerosols and subsequent global dimming over the last decade. Both papers shed light on why we have seen a 'slow-down' in global warming in the last decade.
  24. 22, Steve Case,
    That you want to complain about it is isn't anything I can do much about.
    No, I'm not "complaining," I am simply pointing out that the period which you selected, whatever your reasons, is hampered by a large number of factors which make it useless to use for an argument one way or the other. You cannot draw any conclusions about sea level rise acceleration using the period and data you have selected. That it shows what you want it to show, and so you are willing to easily overlook these issues, apparently isn't anything I can do much about. Other readers, however, can easily recognize what is being discussed and decide for themselves what the science says, and what can easily be done to promote false conclusions by creating scientific looking but invalid presentations, graphs and whatnot.
  25. I went through the tide gauge data set section of Estimates of the Regional Distribution of Sea Level Rise over the 1950–2000 Period I gleaned some numbers for my spreadsheet and put them into tabular order as follows: Record..Status..........Reason 1159....RLR 1950....Met -256....eliminated......Records >2 years -1063...eliminated......Redundant -95.....eliminated......beyond TOPEX/Poseidon range -37.....eliminated......<250 km to Alt grid point. 1658....records for further assessment. ??......eliminated......Disagreement nearby records ??......eliminated......Locations ??......eliminated......Fragmented ??......eliminated......Noise ??......eliminated......Residual trends <10 mm/year -713....Eliminated......For above 5 reasons? (1658-945=713) 945.....combined -491....eliminated......by combination 454.....records for further assessment. -28.....eliminated......No useful data 426.....records for further assessment. Comments: Really, because Topex/Poseidon didn't cover the range they tossed the data? I don't think that makes sense, but I suppose there's a reason for that. In the text they go from 1658 records down to 945 records but don't give us any numbers as to how many were eliminated for the five reasons tabulated above. Residual Trends <10 mm/yr is reasonably objective. The other four listed are somewhat subjective without any guidelines as to what constitutes unsuitable locations, too much noise, too much fragmentation, or how much disagreement with other records is allowed or how near by they must be. After combining the 945 records there was another group of records eliminated for having no useful data. What was not useful? Perhaps in the data file that defies downloading for me, that is spelled out and each and every deletion is annotated as to how the criteria were met. As it stands right now and as far as I’m concerned, there is room for some subjectivity in perhaps several hundred deletions of data. A simple analysis of the data yields one thing, and the process along with the above editing criteria yields the opposite. Now even though there's a difference in sign, if the two time lines were close no one would care, but as you can see, they're not. The above is not the same as Reconstructed GMSL for 1880 to 2009 Which is linked at the top of this page but the treatment of the data is likely to be similar.
    Response:

    [DB] Fixed tags.

    The most likely reason for your lines diverging is that you are doing something wrong.  I suggest you contact Dr. Church or Dr. White (or Tamino, as this is his post) for advice.

    That would be the skeptical thing to do.

1  2  Next

Post a Comment

Political, off-topic or ad hominem comments will be deleted. Comments Policy...

You need to be logged in to post a comment. Login via the left margin or if you're new, register here.

Link to this page


The Consensus Project Website

THE ESCALATOR

(free to republish)


© Copyright 2024 John Cook
Home | Translations | About Us | Privacy | Contact Us