


 Arguments


Is sea level rise accelerating?
What the science says...
Looking at global data (rather than tide gauge records just from the U.S.) show that sea level rise has been increasing since 1880. The recent rate of sea level rise is greater than its average value since 1930. As for future sea level rise, these predictions are based on physics, not statistics.
Climate Myth...
Sea level rise is decelerating
"A former research director with the Army Corps of Engineers and a former civil-engineering professor at the University of Florida decided to put the sea-rise claims to the test. They gathered U.S. tide-gauge readings from 57 stations where water levels had been continuously recorded for as long as 156 years. The result did suggest the sea level was increasing in the western Pacific, but this was offset by a drop in the level near the Alaskan coast. “Our analyses do not indicate acceleration in sea level in U.S. tide gauge records during the 20th century,” the study’s authors concluded. “Instead, for each time period we consider, the records show small decelerations that are consistent with a number of earlier studies of worldwide-gauge records." (Washington Times)
A paper by Houston & Dean studies 57 tide gauge records from the U.S. (including Hawaii and oceanic territories) and concludes that sea level rise has not accelerated. In fact the authors seem to go out of their way to state that the average result shows deceleration at every opportunity. But there are some big questions about their analysis. Why do they use tide gauge records from just U.S. stations? Why not a global sample? Why use individual tide gauge records when we have perfectly good combinations, from much larger samples, which give a global picture of sea level change and show vastly less noise? Why do they restrict their analysis to either the time span of the individual tide gauge records, or to the period from 1930 to 2009? Why do they repeatedly drone on about “deceleration” when the average of the acceleration rates they measure, even for their extremely limited and restricted sample, isn’t statistically significant?
But the biggest question of all is: what’s the big deal?
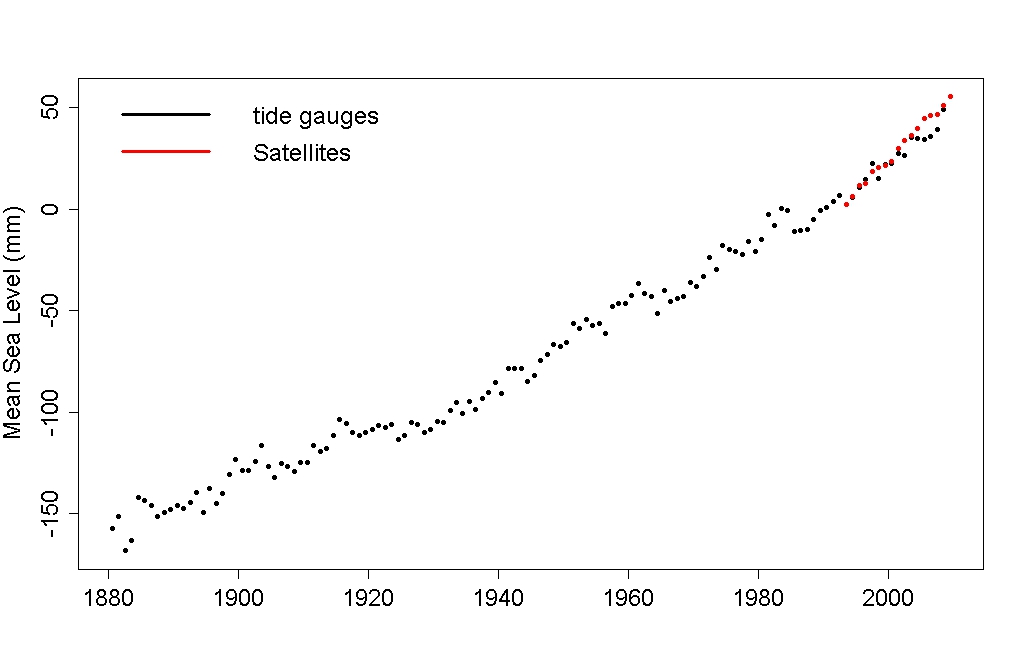
Here’s some sea level data, in fact two data sets. One is a global combination of tide gauge records by Domingues et al. (2008). Using around 500 tide gauge records globally, it’s the latest version of the “Church & White” dataset. The other is satellite data:
I averaged the two data sources during their period of overlap, and computed a smoothed version:

This is a global data set, and it’s a worldwide average so its shows vastly less noise than individual tide gauge records. We could even use it to look for acceleration or deceleration in sea level rise. But one thing we should not do is restrict consideration to the quadratic term of a quadratic polynomial fit from 1930 onward. That would be pretty ignorant — maybe even misleading.
As so often happens, one thing to be cautious of is that the noise shows autocorrelation. As Houston & Dean point out, the Church & White data since 1930 are approximately linear, so to get a conservative estimate of the autocorrelation I used the residuals from a linear fit to just the post-1930 data and fit an ARMA(1,1) model.
If we compute the linear trend rate for all possible starting years from 1880 to 1990, up to the present, we get this:

According to this, the recent rate of sea level rise is greater than its average value since 1930. Significantly so (in the statistical sense), even using a conservative estimate of autocorrelation. But the increase itself hasn’t been steady, so the sea level curve hasn’t followed a parabola, most of the increase has been since about 1980. How could Houston & Dean have missed this?
Here’s how: first, they determined the presence or absence of acceleration or deceleration based only on the quadratic term of a quadratic fit. That utterly misses the point. Changes in the rate of sea level rise don’t have to follow a parabola, since 1930 or any time point you care to name. In fact, by all observations and predictions, they have not done so and will not do so.
Second, by using individual tide gauge records, the noise level is so high that you can’t really hope to find acceleration or deceleration of any kind, with any consistency. Not using quadratic fits, and certainly the non-parabolic trend which is present can’t be found in such noisy data sets.
Even so, we can also fit a quadratic (as Houston & Dean did), and estimate the acceleration (which is twice the quadratic coefficient):

Well well … it looks like starting at 1930 is the way to get the minimum “acceleration” by this analysis method. Could that be why Houston & Dean chose 1930 as their starting point?
If we restrict to only the data since 1930, as Houston & Dean did, and fit a quadratic trend, we get this:

Can you tell, just by looking, whether it curves upward or downward? Clearly, the parabolic fit doesn’t show much acceleration or deceleration, if any. We can get a better picture by first subtracting a linear fit, then fitting a parabola to the residuals?

That answers the question: the quadratic fit shows acceleration in the Church & White data. But, when autocorrelation is taken into account, the “acceleration” is not statistically signficant.
But — just because the data don’t follow a parabola, doesn’t mean that sea level hasn’t accelerated. Let’s take those residuals from a linear model, and fit a cubic polynomial instead:

Well well … there seems to be change after all, with both acceleration and deceleration but most recently, acceleration. And by the way, this fit is significant.
And now to the really important part, which is not the math but the physics. Whether sea level showed 20th-century acceleration or not, it’s the century coming up which is of concern. And during this century, we expect acceleration of sea level rise because of physics. Not only will there likely be nonlinear response to thermal expansion of the oceans, when the ice sheets become major contributors to sea level rise, they will dominate the equation. Their impact could be tremendous, it could be sudden, and it could be horrible.
The relatively modest acceleration in sea level so far is not a cause for great concern, but neither is it cause for comfort. The fact is that statistics simply doesn’t enable us to foresee the future beyond a very brief window of time. Even given the observed acceleration, the forecasts we should attend to are not from statistics but from physics.
Many thanks to Tamino from Open Mind for allowing us to republish his post So What?
Advanced rebuttal written by Tamino
Update July 2015:
Here is a related lecture-video from Denial101x - Making Sense of Climate Science Denial
This rebuttal was updated by Judith Matz on September 13, 2021 to replace broken links. The updates are a result of our call for help published in May 2021.
Last updated on 8 July 2015 by pattimer. View Archives


[DB] "I don't consider Tamino a principle or objective."
Well then, let me ask you this:
How many legs does a dog have if you call the tail a leg?
Four; calling a tail a leg doesn't make it a leg. (Abraham Lincoln)
Discounting Tamino's analysis because you don't like it or don't consider him objective doesn't detract from the fact the Tamino is a professional time-series analyst whose work in climate science not only stands the test of time but is widely considered a de facto standard in climate science.
Yes, Tamino can be irrascible. Mostly that stems from those who refuse to learn, have a large vein of Dunning-Kruger running through them and those slander working climate scientists. We are similar in that regard. But again, that does not detract from his work.
If you have issues with the work that forms this post, take it up with him. If you have questions regarding the work of Church & White, take it up with them (I have yet to find a climate scientist unwilling to help those with genuine questions about their work).
[DB] Speculations of academic fraud snipped.
"I’ve made that point several times now. I should give it a rest."
Yes, you should. Any more violations of the Comments Policy will result in automatic deletion of your entire comments.
"After all, if you run the numbers we’re only talking an extra 65 mm in 100 years."
You make the classic error of presuming SLR will be linear when history gives us ample examples that SLR is highly nonlinear.
"But that's what we seem to be doing by trying to match tide gages with the satellites."
That's what real scientists, like Dr's Church and White, do. Amateurs struggling to replicate their work without a foundation in the science and a thorough understanding of the literature are the ones conducting the "fools errand".
[DB] There is already a SkS thread on that; please place any comments on that topic there: NASA Satellites Detect Pothole on Road to Higher Seas
Hello all. I recently stumbled upon a paper which states, in the abstract, that global mean sea level "rises with the rate of 3.2 ± 0.4 mm/yr during 1993–2003 and started decelerating since 2004 to a rate of 1.8 ± 0.9 mm/yr in 2012." This seems to indicate that sea level rise is decelerating globally (not just locally as was the case with Houston and Dean's paper). The paper can be viewed here. I would like to get some feedback on whether or not this does any damage to the apparently "consensus" view that sea level rise is accelerating.
jsmith, take a look at why SLR might seem to be decelerating between 2004 and 2012. Between 2011 and 2013, SLR was rising at ~7mm per year. You'd do better to ask what caused that trough.
jsmith - that paper has been doing the rounds on contrarian blogs, so you probably 'stumbled' across a contrarian blog.
I haven't looked at the research paper in detail, but the general slowing of sea level rise after 2004-2005 fits in with the sharp acceleration of heat uptake into the ocean during 2000-2005, and a slower rate of heat uptake thereafter. This 'slowdown' is perhaps the most striking feature of the Hiroshima widget.
The recent trend in sea level rise is consistent with ocean heat uptake, so we shouldn't be surprised that the recent trend in sea level rise has slowed somewhat too. A similar pattern seems to have occurred during the 20th century too - short-term accelerations and decelerations against a background of long-term acceleration in sea level rise.
There are a few other factors to consider too (decadal variations in continental storage of water mass, for example), but land-ice melt is accelerating and thermal expansion is not really going to be a factor throughout 21st Century - the disintegration of the vast ice sheets of Greenland and Antarctica will be.
jsmith - I believe the issue of concern is statistical significance. "Since 2004" is a very short time period, including the 2010 dip in sea level associated with La Nina, or "pot hole".
You really need to look at multi-decadal time periods to determine trends, as in Church and White 2011 who found "1900 to 2009 is 1.7 ± 0.2 mm/year and since 1961 is 1.9 ± 0.4 mm/year" and "For 1993–2009 and after correcting for glacial isostatic adjustment, the estimated rate of rise is 3.2 ± 0.4 mm/year from the satellite data and 2.8 ± 0.8 mm/year from the in situ data". They also note that "There is considerable variability in the rate of rise during the twentieth century but there has been a statistically significant acceleration since 1880 and 1900 of 0.009 ± 0.003 mm/year2 and 0.009 ± 0.004 mm/year2, respectively." (Emphasis added)
Short time periods, such as a single decade, are only going to show noise, not trends. While I don't subscribe to that particular journal and have not read the entire article, I fear that the paper is not properly evaluating the statistical significance of their results. If they can clearly support their hypotheses it will be interesting - but as it stands I see little support for such claims.
The rising Oceans,Global warming or not.
Simple experiment:
Fill a bucket to the top with water, then add a brick.
What happens the water overflows the weight of the lost water equals the weight of the brick, it's called displacement.
Add some thing to a body of water what happens?
Throw a brick in the ocean, no noticeable difference.
But throw billions of tons of bricks in and float thousands of ships and boats of all sizes on then we have Oceans rising,
melting ice:
add a large block of ice in your bucket then fill the bucket to the top, the ice floats above & below the water, as the ice melts will the water overflow? Remembering displacement,
Check out below for some reasons for the rising of the oceans.
Listed below is just a small amount of the reasons.
Apparently in WW1 a total of 375 U boats sank 6596 merchant ships, a total of 12,800,000 tons.
The Japanese lost 1,178 Merchant Ships sunk for a tonnage total of 5,053,491 tons. The Naval losses were 214 ships and submarines totaling 577,626 tons. A staggering five million, six hundred thirty one thousand, one hundred seventeen tons,
(5,631,117 tons), 1,392 ships
It's estimated that 10,000 of these large containers are lost at sea each year, Average tonnage 18 tons
180,000 tons per annum
According to an annual analysis from insurer Allianz, 94 ships on average(over 100 gross tonnes) each were completely lost in 2013. There are many reasons for a complete loss. “Foundering” (which means sinking or submerging) caused the vast majority of the big losses
Over 30,000 large Ships over 500 tons launched since 1975 not to mention the 100 of thousands sail boats small yatch's ferries etc
Now lets add the land Pushed into the ocean to build Airstrips, Islands & Erosion.
Where doe's the water go, It just disappears, yeah right. “IT RISES”
-
NEWTONS LAW:
For every action, there is an equal (in size) and opposite (in direction) reaction
Kerry Randell @42, taking your figures on total tonnage, and assuming the average container loss rate extends back to 1945, and that the average ship tonnage loss is 250 with the average loss also extending back to 1945, that yields a total 31,054,617 tonnes lost as a rough estimate. Given that the density of sea water is 1.025 Tonnes per meter cubed, that leads to an estimated displacement of 30,297,187 m^3 of displacement. Averaged over the ocean surface of 361, 132,000 km^2 of surface area, that leads to an estimated 0.000084 milimeter rise in sea level based on your assumptions, for the entirety of lost shipping in the 20th century.
However, that is likely a significant overestimate. The mass of water displaced only equals the mass of the object if the object is floating. If it sinks, the water displaced equals the volume of the immersed object, which is necessarilly less than the volume of water equal to the tonnage of the immersed object, for if it were not, the object would float rather than sink. Ergo, your initial assumption is completely wrong headed. The mass of water displaced by various vessels sunk at sea is far less than the displacement of the vessels.
Kerry... You're doing a classic "missing denominator" calculation. You've estimated out that the number of ships displacing sea water is a very large number. That's your numerator. Your denominator is the total tonnage of all the earth's oceans, and that would make the result an extremely small number.
Discussing sea level and global warming to appreciate fg. the trends one should study the whole process in historical time line:
http://www.antarcticglaciers.org/glaciers-and-climate/sea-level-rise-2/sea-level-rise/