


 Arguments


Doctoring sea level data
What the science says...
| Select a level... |
 Basic
Basic
|
 Intermediate
| |||
|
The claim sea level isn’t rising is based on blatantly doctored graphs contradicted by observations. |
|||||
Climate Myth...
Sea level is not rising
"Together, these two unaltered [sea level] datasets indicate that global mean sea level trend has remained stable over the entire period 1992-2007, altogether eliminating the apparent 3.2 mm/year rate of sea-level rise arising from the “adjusted” data." (Christopher Monckton)
We have a new entry in the contest for most bizarre "skeptic" argument. The "Science" and Public Policy Institute ("S"PPI) Monthly CO2 Report for January 2011, edited by Christopher Monckton, claims on page 29: "Sea level is not rising."
This is of course false. In fact, sea level is not only rising, but the rise is accelerating. Immediately below this false claim, the document contains the following figure:
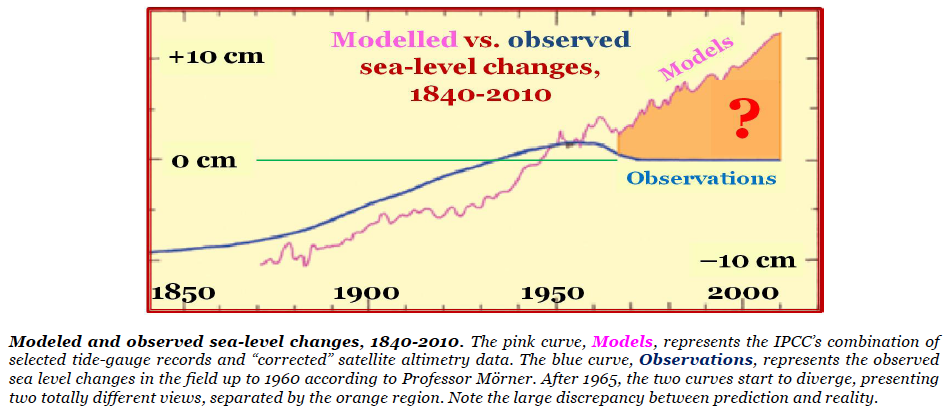
Notice that the caption claims the blue curve is observational sea level data "up to 1960 according to Professor Morner." Of course, after 1960 (when the "observations" are apparently just made up) is not only when the "observations" supposedly diverge from the models, but also when they diverge from reality! Ah, but it gets even worse from here. On page 33, the document presents what may be my favorite figure of all time:
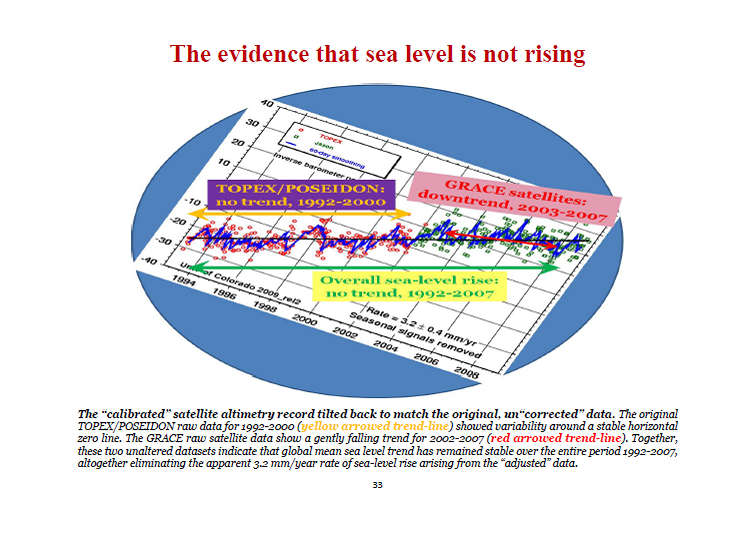
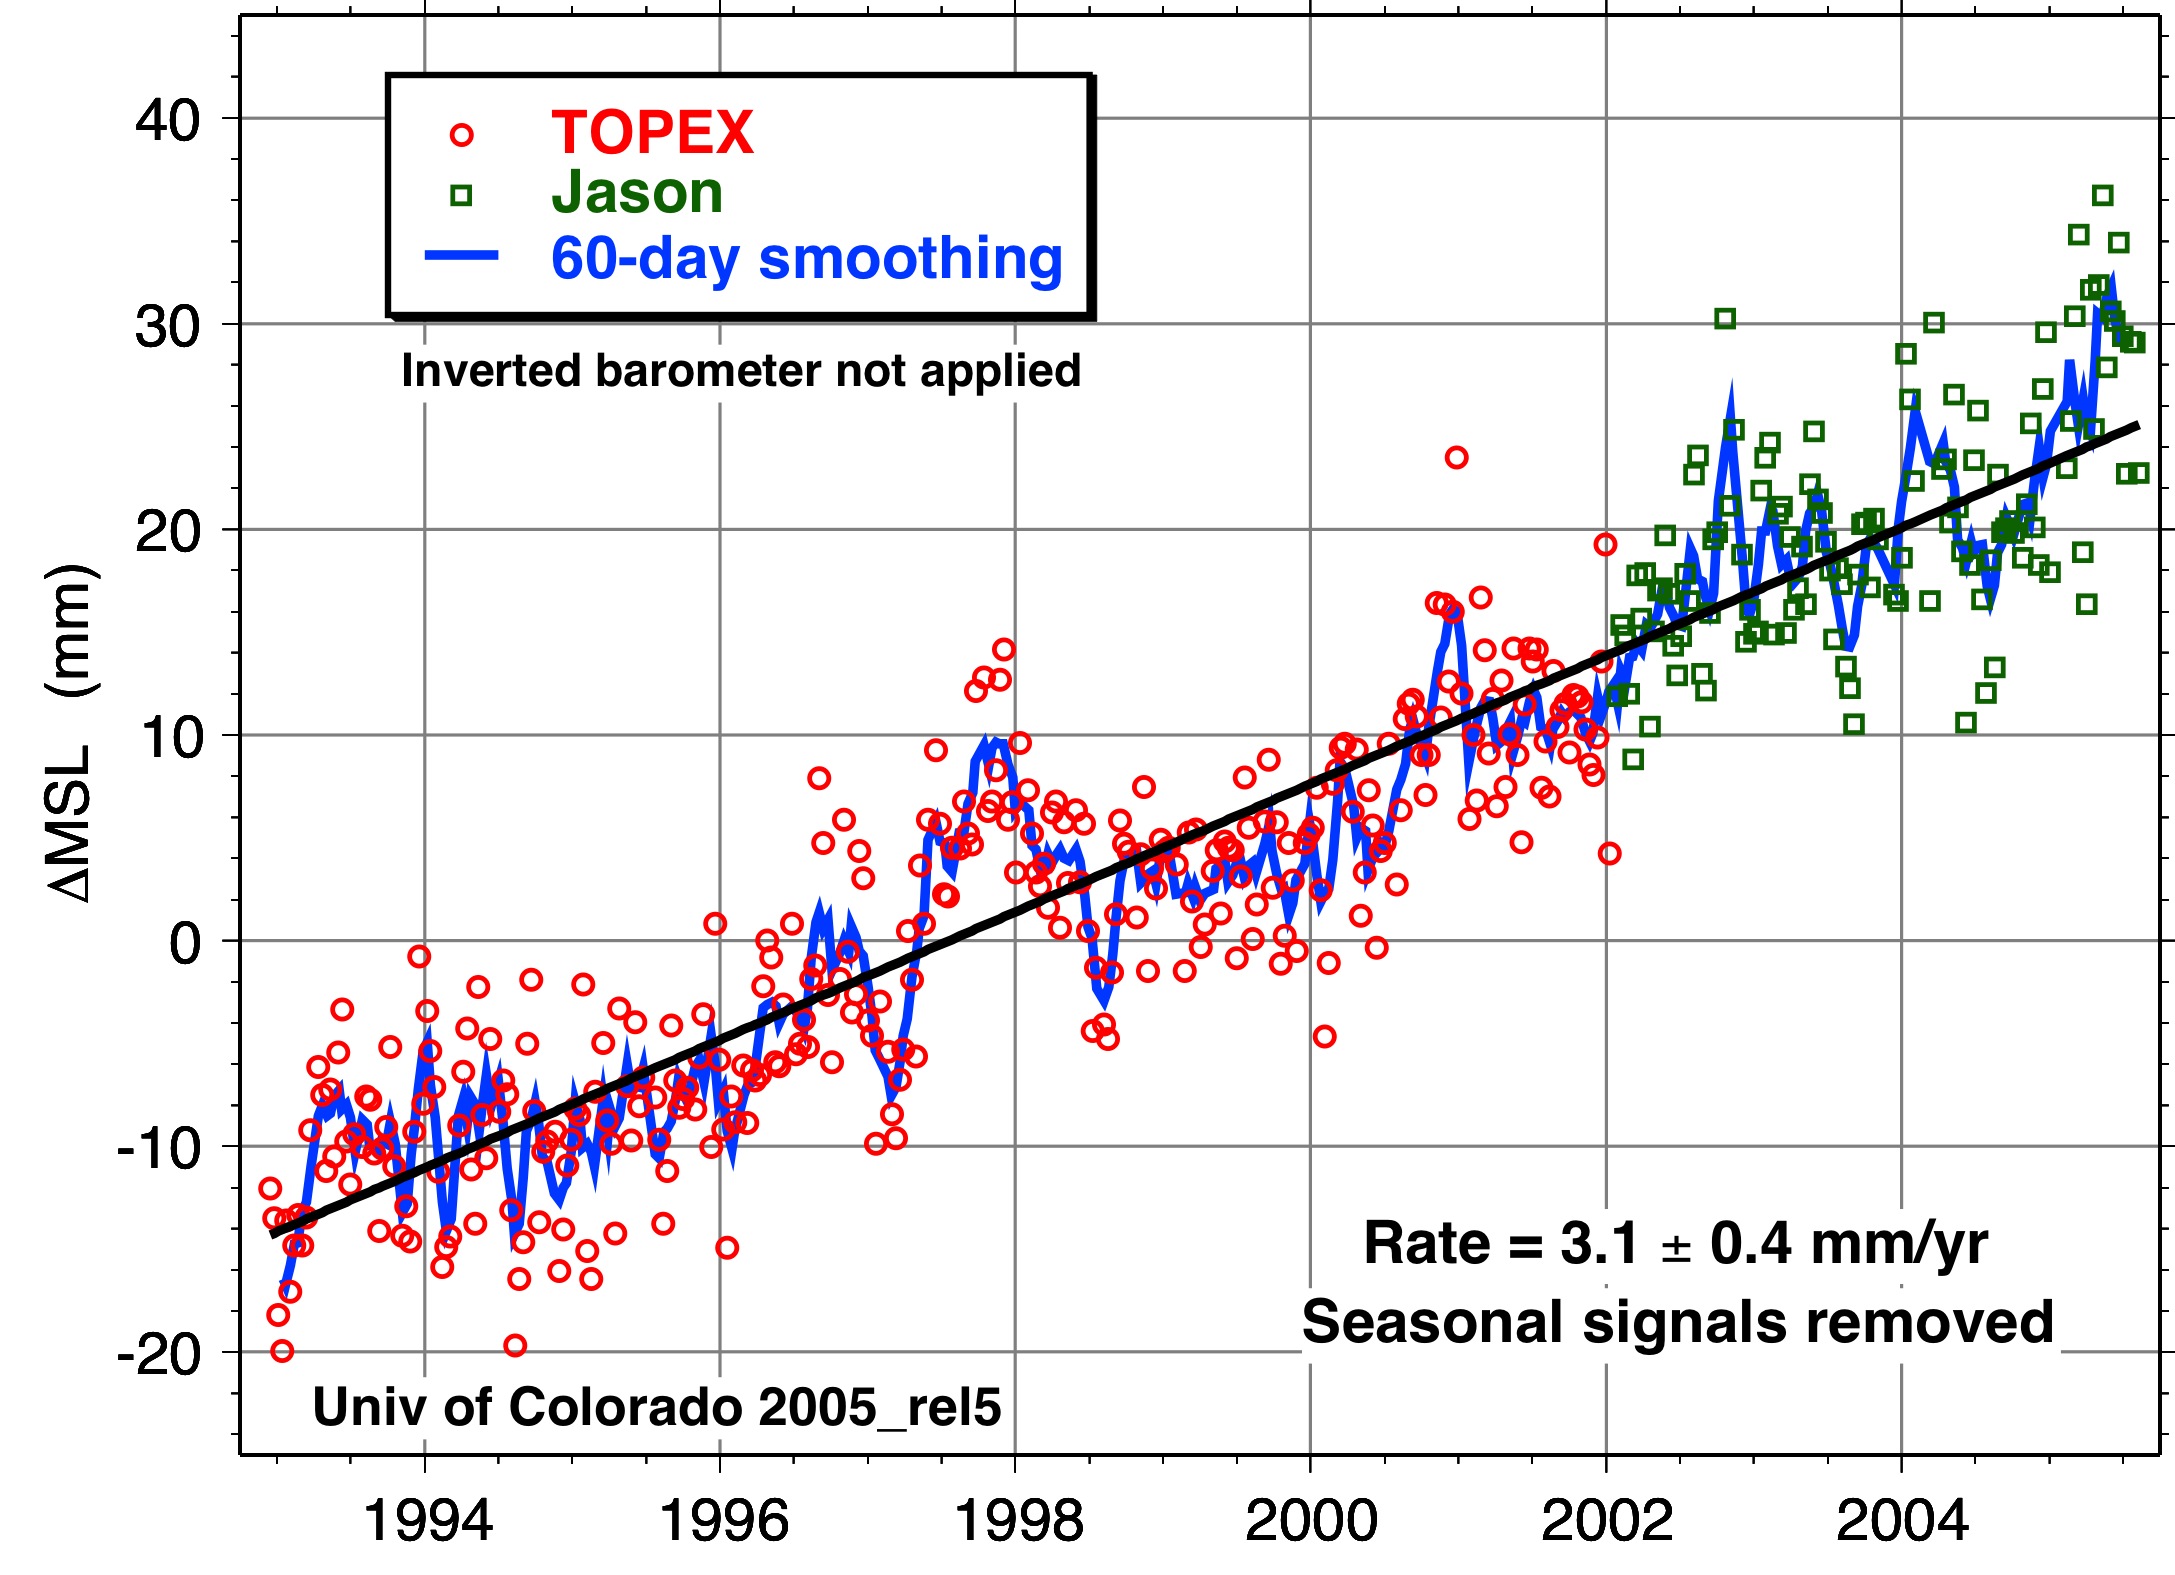
Monckton and "S"PPI have taken the sea level graph from the University of Colorado at Boulder which shows a 3.2 milimeter per year sea level rise trend (as is still visible in the bottom right of the graph), rotated it to make the trend look flat, and claimed that this is what the "unaltered" and "uncorrected" data looks like.
It boggles the mind that Monckton and the "S"PPI think they can convince people that sea level has dropped since 1950 based on nothing more than their own unsubstantiated claims and blatantly doctored graphs which are completely contradicted by the actual observational data.
Basic rebuttal written by dana1981
Update July 2015:
Here is a related lecture-video from Denial101x - Making Sense of Climate Science Denial
This rebuttal was updated by Judith Matz on September 13, 2021 to replace broken links. The updates are a result of our call for help published in May 2021.
Last updated on 8 July 2015 by pattimer. View Archives


This link shows that CCC over-reached when it wrote the district plan for a coastal strip of land here in Christchurch, New Zealand. https://www.stuff.co.nz/the-press/news/107144890/three-lines-left-out-of-christchurchs-district-plan-has-left-a-community-in-despair
Of course they claim it was an honest mistake. I am very skeptical.
I believe that where a rated property has had full occupancy and building rights for several decades, if the powers that be wish to change the rules, then even though they have the right to do that, any property owner that loses amenity of value (due to policy changes) should be compensated.
We are a bit of a special case here in Christchurch after the earthquakes, we have been told so many lies, have been spied on by govt. and generally been ridden roughshod over, that we now are very suspicious of any officials who wish to change things in their favour and at the same time pull the wool over law abiding citizens eyes.
Whatever the rights or wrongs, post-earthquake changes to the district plan are a long way from "If people are to be forced by law to move away from coastal areas or suffer other penalty due to events that merely might happen". Chch dropped relative to sealevel in the quake and rising seas (currently happening as measured not a future maybe) only exacerbate the situation. I sit on other side where colleagues wring their hands in despair when consents are given to building in a gun barrel. Chch suffered enough from that where developers with deep pockets buys land, and fights their way through to sell it on to suckers. I agree that compensation needs to be looked at but so is the responsibility for diligence. Better if councils sorted hazards before development.
Duncan61 comments today on another thread [wildfires] :-
< "O.K. where is the sea level rising.I took it upon myself to contact Freemantle port Authority and they have measured no change in 163 years.If a lot of the ice has melted why is the sea not going up???.Is it O.K. for me to ask or is it a secret " >
Duncan, the scientific data shows a 200 mm rise in sea level at Freemantle in modern times ~ which is kind of average for worldwide sea leve rise (currently rising about 3mm per year and accelerating). The moderator indicates that you sometimes have to adjust for vertical land movement also : but that's less than 0.2 mm per year for coastal Western Australia, so quite insignificant.
Why would you think (or believe) that 100+ years of global ice melting and global ocean warming . . . would not produce an ongoing sea level rise? Even the science-denying propaganda shill who calls herself JoNova and who loves to deceive & mislead her readers . . . even she admits that the Freemantle level has risen 200mm in just over 100 years.
So it's a puzzle, Duncan, how you came to take up the ridiculous nonsense you got from the Freemantle Authority. Sounds like maybe your informant was a jokester enjoying pulling your leg . . . or he's a rabid Flat-Earther . . . or his brother is a Real Estate agent trying to clinch a big waterfront land deal. Could be all sorts of reasons for someone coming up with such rubbish, don't you think?
Freemantle sea level does fluctuate 150 mm over a decade or so, as the oceanic current is affected by the larger-scale effects of El Nino & Indian Dipole oscillations ~ but that averages out to about zero alteration to the underlying mean sea level rise coming from AGW. But I doubt it was that half-truth cherrypick which was what your misinformant was trying to trick you with.
Best just to stick with the reliable mainstream science, rather than listen to a source similar to "a guy you met at the tavern".
When Duncan61 say they have measured no change, perhaps it is because they do not measure it at all. The Port Authority site has no mention that I could find of sea level monitoring.
NOAA, however, shows a trend upward of 1.71+- 0.23 mm/year. I note that this record does not go back 163 years. White et al (2014) is a really good paper, freely avilable but it was published 6 years ago and there has likely been further increase since.
https://www.sciencedirect.com/science/article/pii/S0012825214000956
https://tidesandcurrents.noaa.gov/sltrends/sltrends_station.shtml?id=680-471
Hi again I drive to Fremantle to do plumbing work at least 5 times a fortnight and have been stopping at the traffic bridge where I used to go fishing with my older brother and his mates.You can walk under the bridge and it is about 800m from the open ocean so it is tidal.I have not measured any change in water levels and you can all show me bits of paper with lines on it but can I suggest you come on down and have a look like I have.I am now 58 and used to go there when I was 14 so its a bit of time span.Is it 200mm higher all the time or only when I am not there
[PS] You have already been pointed to this report on sealevel in western Australia, which includes discussion of issues of fremantle tidal guage. You appear to be uninterested in examining anything that might challenge your predjuces in which case this is not the site for you. You may find likes of WUWT more to your taste. Provide data or scientific support for your comment or they will be deleted. This is a science site.
Please note that posting comments here at SkS is a privilege, not a right. This privilege can and will be rescinded if the posting individual continues to treat adherence to the Comments Policy as optional, rather than the mandatory condition of participating in this online forum.
Moderating this site is a tiresome chore, particularly when commentators repeatedly submit offensive or off-topic posts. We really appreciate people's cooperation in abiding by the Comments Policy, which is largely responsible for the quality of this site.
Finally, please understand that moderation policies are not open for discussion. If you find yourself incapable of abiding by these common set of rules that everyone else observes, then a change of venues is in the offing.
Please take the time to review the policy and ensure future comments are in full compliance with it. Thanks for your understanding and compliance in this matter.
Sorry Duncan, but the human memory is often shoddy over the course of 44 years [your 58 minus 14] . . . and especially so, when handicapped by psychological bias.
( Can even be shoddy over 4 years or less ! )
Which is exactly why all scientists rely on records & data from tide gauges, satellite sensors, and so on.
But Duncan, there's no pressing need for you to be worrying that you are losing your marbles . . . for as I explained in #28 , there is a 150+ mm fluctuation over the cycle of a decade or so, owing to variations in the local oceanic currents. But in the overall long term, the measured average sea level rise at Fremantle is about 200 mm ~ which is very similar to sea level rise measured in most parts of the world. Unsurprisingly.
duncan61 @30,
The tidal gauges at Freemantle (and I assume we aren't suddenly talking of Freemantle, Southampton as there is no associated Port Authority of that name) show a 1.67mm/yr rise in average sea level with a small acceleration. So a 44 year period would have seen that average increase in height by something like 75mm. Do note that the tidal range at Freemantle is 200mm to 1400mm, so between three and twenty times greater. Also note the tidal gauge data graphed below also has a lot of noise. This monthly data also shows about 400mm of variation. So I would suggest that it takes more than a 5-times-a-fortnight stop-off to judge the average sea level rise over 44 years.
Recommended supplememtal reading:
Sea levels rose faster in the past century than in previous time periods, Edited by Nikki Forrester, Climate Feedback, Mar 12, 2020
@duncan61 @30
Scientists use satellites to measure the sea level. The entire earth is scanned every 10 days yielding millions of data points. Tide gauges provide thousands of measurements everyday. Land surveys provide a few million more datapoints.
You have one datapoint which is by eye on TIDAL water with which you claim you can detect a few centimetres change? (Well, 0 cm to be more pedantic).
Who to believe?
Reference for you:
https://climatekids.nasa.gov/sea-level/