


 Arguments


Recent Comments
Prev 1089 1090 1091 1092 1093 1094 1095 1096 1097 1098 1099 1100 1101 1102 1103 1104 Next
Comments 54801 to 54850:
-
Kevin C at 16:11 PM on 1 September 2012Matt Ridley - Wired for Lukewarm Catastrophe
Joel@66: I think that shows that intuition is untrustworthy on this subject. Read Hansens' 2011 paper here, esp. figure 4a. Rypdal's method will allow you to deduce this figure for yourself. The temperature response to a given forcing history is the convolution of the derivative of this function with the forcing. You can see that about 40% of the response comes from forcing in the most recent 10 years, and 60% for earlier forcing. However, if the forcing is much more complicated than an impulse or a step, doing this calculation in your head is impractical. You actually have to do it before drawing conclusions on the results. -
scaddenp at 15:58 PM on 1 September 2012Matt Ridley - Wired for Lukewarm Catastrophe
Joel, 628ppm would be more like B1 scenario depending on what else was going on. IPCC prediction would be 1.1 -2.9 so I suppose they are luke-warmers too. I normally think of luke-warmers as those how somehow believe that climate sensitivity is less than 2. -
davidsanger at 15:52 PM on 1 September 2012CO2 lags temperature
thanks @Rob, clearly explained and the papers were helpful. -
Tom Curtis at 12:55 PM on 1 September 2012AGU Fall Meeting sessions on social media, misinformation and uncertainty
One further comment. Geoff Chamber's wrote at Bishop Hill:" Cook is quite clear in private correspondence that Lewandowsky’s denier / conspiracy theorist survey was something separate from the schemes he was cooking up with Lew. One possibility is that he contacted the commenters directly by email. This would be better survey practice, since it prevents commenters from exchanging views, as happened at Tamino’s, and also would avoid any possible bad publicity. Would it be considered unethical?"
Clearly his questions have been answered already. Skeptical Science and John Cook are not associated with Lewandowski's study. Curiously, Geoff Chambers followed that comment by espousing his own, bizarre conspiracy theory. Given that he thinks the "... whole survey is a fuss about nothing ...", I have to wonder why he is making a fuss. -
Tom Curtis at 12:48 PM on 1 September 2012AGU Fall Meeting sessions on social media, misinformation and uncertainty
Further to my comment @12, and following up on John Hartz @13, I had a look at Lewandowski's data. Of interest to me is that 43 out of the 64 people who most strongly disagreed with global warming, as measured by their disagreement with the claim that:"I believe that the burning of fossil fuels on the scale observed over the last 50 years has increased atmospheric temperature to an appreciable degree."
also strongly agreed with the claim that:"The claim that the climate is changing due to emissions from fossil fuels is a hoax perpetrated by corrupt scientists who wish to spend more taxpayer money on climate research."
That is, 67% of the hard core "skeptics" surveyed are conspiracy theorists in the strict sense; even if their conspiracy theories are restricted to global warming. As it happens, however, 37 of those 64 had conspiracy theory ideation above average. That is, 50% of hardcore "skeptics" surveyed give significant credence to at least one, or some credence to at least 6 bona fide conspiracy theories other than those associated with climate change. Scary. -
Bernard J. at 12:35 PM on 1 September 2012Matt Ridley - Wired for Lukewarm Catastrophe
Joel Upchurch at #65:Bernard J. @60 All you seem to have done is graph the IPCC A1F1 scenario. I don't know you seem to think that corresponds to any definition to the word proof.
Really - "seem to have done"?! If you have a mathematical background you should be able to muck around and actually deduce how I arrived at the trajectory, or at least come to a pretty close approximation. I even gave you some clues. And note, I haven't at any time used the term "proof". What I did say is that:...I constructed the curve...
and that:...I used the entire Mauna Loa dataset available at the time, and I used the data itself to determine the best projection, rather than directly assuming a linear, exponential, or other fit. I did this by using a process similar to that illustrated by Dana on this very thread, and by using the most parsimonious approach in that analysis to subsequently arrive at the 21st century extrapolation.
To simplify, as it seems to escape your mathematically-trained attention, I used the entire Mauna Loa dataset, and the trend inherent in the data themselves, to arrive at the graph I displayed. And if that closely resembles the IPCC's A1F1 scenario, well, that probably reflects the underlying supposition of my analysis of a business-as-usual trend based solely on the pattern inherent in the Mauna Loa data. Call me cynical, but given your responses to me and to others here I can't help but question your argumentum ad auditorem claim to have a degree in mathematics. Are you sure that you didn't just take it as a first year subject (if that), and that you're inflating your experience in an attempt to redirect the thread?Moderator Response: [d_b] Easy there, please; no sense in being lured away from the subject at hand by irrelevancies. -
skywatcher at 11:47 AM on 1 September 2012Matt Ridley - Wired for Lukewarm Catastrophe
Composer99, nicely put. Saves me one debunking task. Joel, in #23, you asserted it was not plausible for emissions to increase at a sufficient rate to support large temperature rises. You ignored (and continue to ignore) such crucial issues as time delay to equilibrium, feedbacks, and economic/population issues that will lead to continued acceleration of both CO2 emissions and resultant warming at BAU. But in #28 you supported your assertion in #23 with the following statement:There is nothing in the actual C02 data that supports an increase to 792PPM of CO2 by 2100.
Quite apart from the other evidence presented showing that this is patently absurd, I presented evidence that the IPCC have emissions scenarios that consider this entirely plausible, with A1FI and A2 passing 800ppm by 2100. In #62, you try and divert from accepting that you were wrong in your earlier statements by suggesting that the IPCC think 628ppm is plausible [of course they do]. Which was not the question. Let's not chase blimps here. Do you accept that the evidence presented shows that it is plausible for emissions to pass 800ppm by 2100? Or do you want to continue using your extensive mathematical skills to put naive linear trends through 30 years of data, and continue to ignore all other physical factors? -
Tom Curtis at 10:59 AM on 1 September 2012AGU Fall Meeting sessions on social media, misinformation and uncertainty
geoffchambers @6, a quick google search of SkS shows no hits for "Lewandowski" plus "survey". Beyond that, any questions you have should be directed to John Cook. For those who are interested, Lewandowki's paper is available online here. I note that, having read the methodology, the claims being made about it by various deniers are entirely unwarranted. It might justly be claimed that the paper has not sampled "skeptics" in general, or "skeptics who comment on the internet", but only "skeptics who comment on science based blogs" which may not be a representative sample. It may also be suspected that the number of "skeptics" participating may be to small to draw any significant conclusions. It is not clear to me where Lewandowski reports the proportion of respondents with low scores on the Climate Science part of the survey. More importantly, in my opinion, the title of the paper is not justified by the results, and is needlessly sensationalizing and offensive. Lewandowski found a -.866 correlation between free market ideology and acceptance of climate science, but only a negative 0.197 correlation between acceptance of conspiracy theories and acceptance of climate science. Clearly the link to free market ideology is the big result, and the limited link to conspiracy theory ideation should only be a footnote in this study. Having said that, the link between a significant group of "skeptics" and conspiracy theorizing is easily established by their own words, with suggestions that climate scientist fake data either to advance the cause of one world government, or to undermine the US economy, or simply to defraud tax payers all being common and all being, in the strictest sense, conspiracy theories. Of course, this only has bearing on those "skeptics", such as Monckton, who advance such theories; and is in no way a reflection on the more rational "skeptics" such as Jeff ID and Lucia. -
John Hartz at 10:53 AM on 1 September 2012AGU Fall Meeting sessions on social media, misinformation and uncertainty
To put Geoff Chamber's posts in context, here's the text of the Aug 31 post on Bihop Hill titled,"Landowsky's Survey." "Geoff Chambers has obtained Stephan Lewandowsky's survey data which can be seen as an attachment at the bottom of this post. Of course it's anonymised, so we are not going to get to the bottom of the question of the number of sceptics he approached, but you may be interested." Geoff and his cohorts at Bishoip Hill seem to be intent on making a mountain out of a molehill. -
Daniel Bailey at 10:47 AM on 1 September 2012Matt Ridley - Wired for Lukewarm Catastrophe
Tom Curtis posted this at 9:50 am and it was unfortunatley accidentally deleted. I reproduce the text here:Joel Upchurch, I just did a few calculations based on your comment @28. Based on your projected temperature increases, I calculated that your estimate for CO2 concentration in 2100 is 490-620 ppmv. That later requires an average 2.56 ppmv CO2 groath over the remaining years of the 21st century, ie, a marginal increase over current levels. The former requires annual CO2 growth approx half that of current values for the rest of the 21st century. The median value requires no growth in emissions over current values for the remainder of the century. Your assumptions are simply absurd as a BAU model. More troubling, if you calculate the increase in temperature from the pre-industrial average using your your concentration estimates, we find an increase of 2.4 C over the preindustrial average for the lower estimate, and 3.4 C for the upper estimate. That represents a 1.7 to 2.7 C increase over current values. You only obtained lower values by ignoring the warming currently in the pipeline. (Note: The difference between my estimate and scaddenp's estimate at 58 is that I used a climate sensitivity of 3, while he used 2.8) Most importantly, the median value of 2.9 C is well above the 2 degree above pre-industrial average guardrail for "safe" global warming. Even your dubious luke warm values are way to hot.
-
Daniel Bailey at 10:44 AM on 1 September 2012AGU Fall Meeting sessions on social media, misinformation and uncertainty
Sorry, JH. Only JC can do that. -
Composer99 at 10:30 AM on 1 September 2012Matt Ridley - Wired for Lukewarm Catastrophe
Joel Upchurch @ 62: You claim of Tamino in one of his posts linked to upthread:He is actually demonstrating that Monckton's assertion of linear C02 growth is absurd. He wasn't trying to prove that CO2 accumulation is super-exponential. You are using what he posted out of context.
However, over the course of his debunk of Monckton, Tamino concludes the post with the graph shared here before and some additional comments: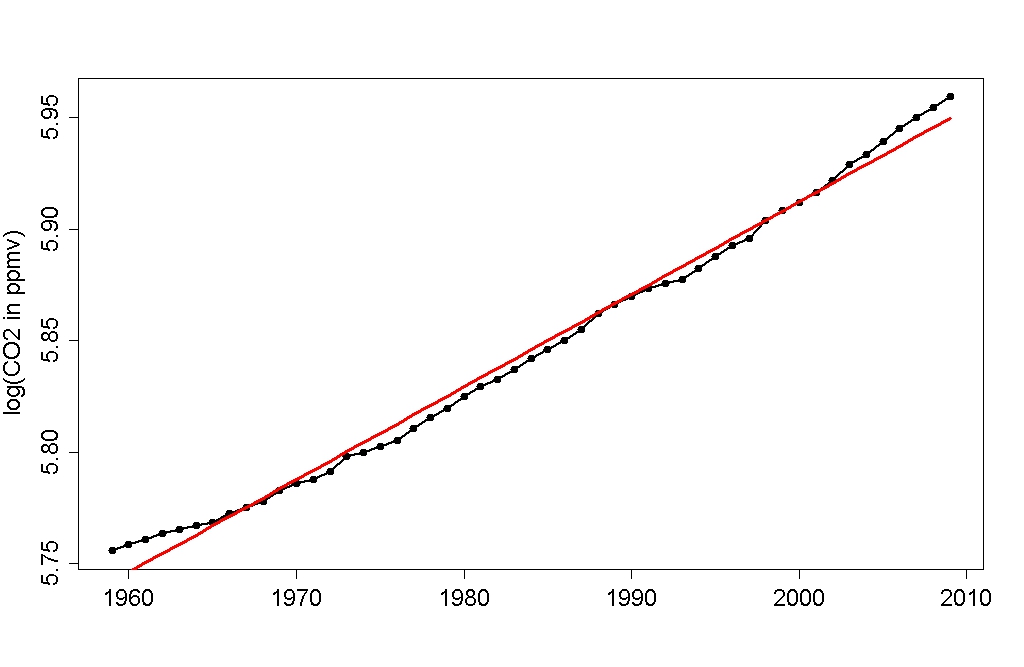
It sure looks like log(CO2) has increased faster than linear, i.e., that CO2 concentration has increased faster than exponential. We can test this by fitting a quadratic curve to the residuals from our linear fit:
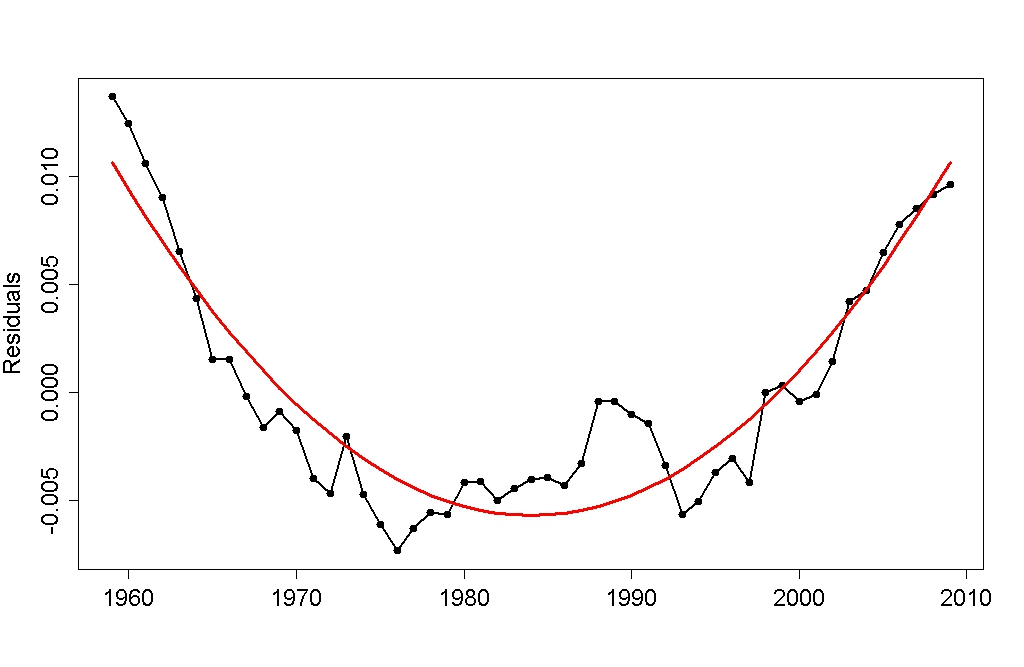
Sho’nuff. CO2 has increased faster than exponential. Even using the shorter NOAA global dataset. And yes, the result is statisically significant. [Emphasis mine.]
Suffice it to say that, while demonstrating CO2 concentration is increasing faster than exponentially was not the express purpose of Tamino's post, in direct contradiction to your assertion, he nevertheless does so. Colour me unimpressed, Joel. -
John Hartz at 10:29 AM on 1 September 2012AGU Fall Meeting sessions on social media, misinformation and uncertainty
@geoffchambers #6 I inadvertendly deleted your second post. I'm hoping that Daniel Bailey can restore it. -
John Hartz at 10:27 AM on 1 September 2012AGU Fall Meeting sessions on social media, misinformation and uncertainty
@geoffchambers #6: If you want to determine whether SkS posted a link to Lewandowsky's survey between Aug and Oct 2010, you can use the site's archive to access all of the articles posted during this time-frame. It is not incumbent on volunteer SkS authors to do this research for you. If you want to know how John Cook interacted with Stephan Lewandowsky on his survey, you best send a querry to John via email. He's a very busy person and no longer has time to read all of the comments posted on SkS. -
Daniel Bailey at 09:53 AM on 1 September 2012AGU Fall Meeting sessions on social media, misinformation and uncertainty
I guess I'd have to ask, Geoff: Who's speculating, where are they speculating, who wants to know and why?Moderator Response: TC: The following is the text of Geoff Chamber's post, accidentally deleted by John Hart. I am posting it here as the natural response to Daniel's question:"Daniel Bailey Just about everyone at Lucia's blackboard, Bishop Hill, and Joanna Nova's. I've seen the names of Mosher, McIntyre Jeff Id, Andrew Montford, Anthony Watts, among others. Some of the speculation is about the identity of the sceptical blogs which Stephan contacted and which refused to cooperate. Some is about the data itself, which is now available at Bishop HillL My question is on the specific point as to whether Skeptical Science participated in the survey in any way. A simple yes or no answer will do."
-
Tom Curtis at 09:16 AM on 1 September 2012Matt Ridley - Wired for Lukewarm Catastrophe
Joel Upchurch @63, I doubt very much that you have been told that discussing the IPCC's economic projections is of limits. You may have been told they are of topic on a particular thread - but that is not the same as saying they are of limits per se. In any event, I am not asking you to discuss the IPCC's economic projections. I am asking you to identify what you believe will happen so that you can be confident that CO2 emissions will not compound at greater than 3% annually over the next 90 odd years: a) Will economic growth be significantly less than 3%, and why? b) Or will the human population essentially plateau at current levels, and why? c) Or will carbon intensity decrease by 3% per annum compounding over the next 90 years without government regulation or a price on carbon? And if so, why? -
geoffchambers at 09:14 AM on 1 September 2012AGU Fall Meeting sessions on social media, misinformation and uncertainty
I see John and Stephan are going to be convening a meeting together on Understanding & Responding to Misinformation in December 2012 There's a lot of speculation on the net at the moment about the Lewandowsky paper which has been announced about scepticism and belief in conspiracy theories. (-Snip-) Could you, John Cook, please clarify whether SkS posted a link to Lewandowsky's survey between Aug and Oct 2010, or helped in any other way, eg by providing email addresses of potential respondents? many thanks Geoff ChambersModerator Response:[DB] References to stolen intellectual property snipped.
-
Tom Curtis at 09:08 AM on 1 September 2012Matt Ridley - Wired for Lukewarm Catastrophe
Joel Upchurch @66, why can we ignore it? Does the world end in 2100? Or is this just purely an intellectual exercise for you? More importantly, as is evident from your comment @28, you have been calculating the expected temperature increase from (approx) 2010 levels. In doing so you want to ignore the heat currently in the pipeline, and that in the pipeline at 2100, which is double dipping. -
Joel Upchurch at 08:02 AM on 1 September 2012Matt Ridley - Wired for Lukewarm Catastrophe
Kevin C @ 61 As far as forecasting the temperature in 2100, then it seems to me that a pipeline cuts both ways. If there is 10 years of heat in the pipeline, then that means that we can ignore what we emit after 2090. I would like to discuss the Chinese situation. They are forecasting that their greenhouse gas emissions will peak around 2050 and start decreasing because of their switch to nuclear power. -
Joel Upchurch at 07:46 AM on 1 September 2012Matt Ridley - Wired for Lukewarm Catastrophe
Bernard J. @60 All you seem to have done is graph the IPCC A1F1 scenario. I don't know you seem to think that corresponds to any definition to the word proof. -
Joel Upchurch at 07:20 AM on 1 September 2012Matt Ridley - Wired for Lukewarm Catastrophe
scaddenp @58 Since the lukewarming argument is 2 degrees or less, 2.2 degrees as roughly consistent. I'm certainly not going to argue about 10%. -
Joel Upchurch at 07:14 AM on 1 September 2012Matt Ridley - Wired for Lukewarm Catastrophe
Tom Curtis @ 59 I have been told in the past that questioning the economic models that the IPCC uses is off limits. If that is not longer the case, then I would love to discuss it. I find the economic models far more questionable than the science. -
Joel Upchurch at 07:02 AM on 1 September 2012Matt Ridley - Wired for Lukewarm Catastrophe
skywatcher @57 I read Tamino's post again. He is actually demonstrating that Monckton's assertion of linear C02 growth is absurd. He wasn't trying to prove that CO2 accumulation is super-exponential. You are using what he posted out of context. I reviewed the IPCC scenarios and 628PPM by 2100 seems to fall between the A1B and B2 scenario, so I don't know why you think it is manifestly wrong. -
David Lewis at 06:07 AM on 1 September 2012Realistically What Might the Future Climate Look Like?
re: obese people and their carbon footprint department the Royal Society just published a special Geoengineering issue which contained an article on summarizing work studying which crops would reflect most sunlight back out to space. There are differences between different crops and between different strains of each crop when you examine the effect they have on local albedo. When civilization gets serious everything is going to be thrown at the problem. The issue contains an article on if it is possible for the planet to experience what specialists call a "runaway greenhouse effect", i.e. turning Earth into something like Venus by elevating the temperature so much the oceans boil away, which Jim Hansen said in a Bjerknes Lecture at the AGU that he thinks is a "dead certainty" if all fossil fuels are burned. The authors examined the issue, and the Royal Society publishers published the research because Hansen took a position. What a relief to discover that if you accept that the simple models employed are right, all that can happen and this is said to be a remote possibility by the modellers, is a "moist greenhouse", that wouldn't boil the oceans away. I think that event ends civilization and all or most all of life I'm still studying.... Schellnhuber says PIK examined the issue a bit as well and he also said, at the Australian 4 degrees conference in one of his speeches that what can happen is you heat the planet up slowly in human terms rapidly in geological terms and once you cross a line somewhere around 4-6 degrees I seem to remember the system takes off and doesn't stabilize until the temperature is far higher. -
M Tucker at 05:41 AM on 1 September 2012Realistically What Might the Future Climate Look Like?
Caldeira, and others, have pointed out many times that human engineered modifications to the atmosphere to cool the earth could cause unintended consequences. A severe drought or heat wave occurring after a nation, or group of nations, embarks on a modification program might be taken as an act of aggression by the suffering party. With conflicts due to unwelcome immigrations already taking place due to climate disruptions, and considering many well respected organizations predict these will only intensify as the climate becomes more unstable, this will only add another layer that could easily lead to catastrophic wars. Schellnhuber’s comment is surprisingly narrow-minded. Acidification of the oceans is not just a threat to corals but to the base of the food chain that most fish and all apex predators depend. These bureaucrats remind me of the discussions held by the collection of middle managers, phone sanitizers, and hairdressers as described by Douglas Adams. -
David Lewis at 04:47 AM on 1 September 2012Realistically What Might the Future Climate Look Like?
The "4 degrees" conference held in Australia was devoted to exploring what happens as climate warms beyond the 2 degree target adopted in climate negotiations. The conference was inspired by the Royal Society "4 degrees" conference held in the UK. Conference organizers mentioned that when they attended the UK conference 4 degrees of warming was regarded as something civilization could not allow to happen and hence was unlikely. By the time the follow up Australian conference was held the idea of 4 degrees or more was, incredibly, becoming far more credible. The conference has a website where many presentations are available in audio. This page contains links to the audios. John Schellnhuber's keynote speech Climate Change: The Critical Decade is particularly recommended. Schellnhuber gave another speech:Strange Encounters behind the 2 degrees C Firewall which is also very good. I've been studying both speeches and forget what is covered best in which. He was part of the group that came up with the original idea for the IPCC "burning embers" charts shown updated by Smith et.al. in the above post. one of his specialties is tipping points. In the "Strange Encounters..." speech he explains very well what the 2 degrees target meant. For one thing, although 2 degrees was declared in political negotiations to be "safe" according to Schellnhuber, it means the end for coral reefs worldwide. "But who needs coral reefs anyway?" He sadly joked. He offers the best explanation I have heard for why using the analogy that there is a limit in billions of tonnes of carbon that can be added in total to the atmosphere when talking about the solution to climate, as opposed to talking about restricting emissions to "x"% by some date in a given country. The prior Royal Society 4 degrees conference is well worth studying as well. This Wikipedia page contains links to the conference video presentation page as well as much other useful info. I'm travelling and don't have access to my home computer which has better links to all presentations of this conference but you can find everything with a tiny bit of work. Once people realize that 2 degrees was never "safe", and that the 2 degree target could well be out of our hands now, some minds turn from despair to geoengineering. I monitor a geoengineering group that is an exchange of views between some of the top researchers, i.e. Keith, Caldeira, etc., and this is what I feel. they aren't profit seeking cowboys- they are deeply concerned about what happens if say the Republicans suddenly wake up to the facts and immediately want to apply some wacked out scheme touted by such as Lomborg. They want to be able to say something about what scientific investigation of various techniques has shown might happen as civilization finds itself unable to face its present and becomes ready to try anything. Kevin Anderson's views are also worth study. Anderson is associated with the Tyndall Centre in the UK, which is sometimes billed as the UK's premier climate research institution. He feels climate scientists, and anyone who has been in any way minimizing how serious the problem we now face is need to be more explicit about what they know and feel in the future. an example of what he's critiquing: the Stern report he says contains fudged date and impossible assumptions as it concludes climate could be solved at reasonable cost, and he states categorically that most of his colleagues understand this but have been rather quiet.Moderator Response: [DB] The Royal Society 4 Degrees issue can be found here (many articles are open-access). -
garethman at 04:16 AM on 1 September 2012Realistically What Might the Future Climate Look Like?
We made a conscious decision a few years ago to act ourselves. I do not believe anyone has the political power or will to to anything, so action must come locally. We installed solar energy panels, switched to wood fired stoves, we grow our own veg and try and work from home as much as possible. I know this sounds smug, and I'm aware not everyone has the opportunity to change. But the financial benefit has been great. It helped put a child through University which was a major unpredicted benefit. Even if we just start with switching to LED lighting it will help, but one of the things that prevent people acting is that the problem is so huge, and that they expect the government or IPCC to act on their behalf. It's not going to happen, we have to pursuade everyone that they have the power to change things and every little helps. Measures to address climate change start at home, we must act locally. -
Kevin C at 03:47 AM on 1 September 2012Matt Ridley - Wired for Lukewarm Catastrophe
Joel: If you want to project a realistic temperature rise from CO2 emissions including warming in the pipeline from CO2 we have already emitted, there is a simple method of doing do. I did it <20 lines of R code. The method is spelled out in detail in this paper: Rypdal 2012 (open access). For a realistic future projection, you'll need to take into account that we probably can't maintain an increasing output of cooling aerosols, and China are working to reduce their aerosol output because of the health issues. -
JoeT at 02:30 AM on 1 September 2012Will the Wet Get Wetter and the Dry Drier?
Rob Painting, As I wrote above, the results presented by GFDL differ in several ways from the very recent paper by Dai that can be found here. Would you know what assumptions go into the models that account for the differences. The Sahel region of Africa stands out in particular as one where the predictions diverge radically. Thanks. -
heijdensejan at 22:52 PM on 31 August 2012Arctic Sea Ice Extent: We're gonna need a bigger graph
Most worrying is the fact that PIOMAS is following the exponential decline https://sites.google.com/site/arctischepinguin/home/piomas. Result ice free in 2015. Next year will be interesting -
Daniel Bailey at 22:35 PM on 31 August 2012Why Arctic sea ice shouldn't leave anyone cold
A commenter over at Neven's ASI blog has offered up a very applicable & cogent argument. If if Arctic melts were as pronounced as Christy says relative to today then a graphical overlay of the two periods should be instructive. And that is just what deconstruct did. 1938 vs 2012 To highlight that difference, deconstruct also overlaid 1946 (representative of the colder mid-40s) with 2012:
 So that begs the question, which was the most comparable melt: 1938 to 2012...or 1938 to 1946?
Enquiring minds want to know.
So that begs the question, which was the most comparable melt: 1938 to 2012...or 1938 to 1946?
Enquiring minds want to know.
-
Rob Painting at 21:39 PM on 31 August 2012CO2 lags temperature
David Sanger - some recommended reading: 1. Interannual extremes in the rate of rise of atmospheric carbon dioxide since 1980 - Keeling 1995 2. The Carbon Cycle Response to ENSO: A Coupled Climate–Carbon Cycle Model Study - Jones (2001) -
L. Hamilton at 21:16 PM on 31 August 2012Arctic Sea Ice Extent: We're gonna need a bigger graph
I've been drawing simple bar graphs that track the minimum ice extent, area or volume for each year to date. With the PIOMAS August update (through 8/25) the results are striking: [LINK]Moderator Response: [DB] hot-linked URL. [RH] shortened link that was breaking page formatting. -
Rob Painting at 20:43 PM on 31 August 2012CO2 lags temperature
David Sanger - this is much easier if you understand that the oceans are Earth's main heat reservoir. Arguably the greatest climatic effect greenhouse gases exert is that they trap more heat in the ocean. During La Nina the oceans accumulate more energy - as heat is buried in the sub-surface ocean, and during El Nino this heat wells to the surface and is smeared across the central and eastern equatorial Pacific. Due to these characteristics, and the surface air-sea exchange of heat, the Earth is cooler-than-average during La Nina, and warmer-than-average during El Nino. But there's more to the story, there are two large competing effects on carbon exchange during ENSO. In a La Nina phase upwelling of acidified deep water along the western coast of North & South America out-gasses CO2 to the atmosphere. But this is more than compensated by the wetter-than-average rainfall which falls over the continents and particularly the tropical river basins of the world. More rainfall over such a vast land area generally means more plant growth and a draw down of atmospheric CO2. During El Nino the much of the continental land surfaces are drier-than-average. This is because the upwelled heat on the Pacific equatorial ocean surface draws moisture away from the continents, and rainfall is focused over the ocean. CO2 out-gassing may shut off, but again this is more than compensated for by land vegetation. As drought sets in on the continents, vegetation dies and CO2 is released back to the atmosphere. Warming air temperatures also elevate respiration which, again, releases more CO2 back to the atmosphere. These natural short-term CO2 fluxes dwarf human fossil fuels emissions, but unlike fossil fuel pollution they do not increase incrementally year after year. It is, of course, more complicated than that. For example the distribution of rainfall is vitally important, but that is the general picture. Armed with that knowledge you can now under see that Humlum & co aren't telling us something we don't already know. They just lack understanding of the physical mechanisms which drive this and, allied to ideological bias, therefore come to conclusions unsupported by the evidence. As for large volcanic eruptions - they can reduce atmospheric CO2 because they stimulate enhanced plant growth on a global scale. This is accomplished by the volcanic aerosols high in the stratosphere increasing light-scattering which more readily penetrates the leaf canopy. In the absence of other limiting factors, more sunlight equals more growth and hence draw down of atmospheric CO2. You can see this in the graph you presented - after the Mt Pinatubo eruption (1991) even the El Nino of 1991-92 saw a decline in atmospheric CO2 - the opposite of the normal response. -
shoyemore at 20:05 PM on 31 August 2012Arctic Sea Ice Extent: We're gonna need a bigger graph
I keep a daily chart on the ice extent from IARC-JAXA. Like everyone else I had to make space at the bottom this year for the new melt. Deep Climate is projecting 3.56m km^2 for minimum. Deep Climate Projection One striking this is how long the melt season is becoming - from a V-shape to a U-shape in the chart. Means the re-freezing will be almost as interesting as the melting. -
davidsanger at 18:57 PM on 31 August 2012CO2 lags temperature
scaddenp @378 Thanks for the link. That explain a lot about the context. I should have thought to search the site first for "Humlum" KR @381 So if I understand the graph then he's just showing that (sometimes) if the measured CO2 increases a bit more quickly year over year, then the temperatures increase a bit more compared to the previous year, and if the CO2 increase from year to year is a bit more modest the temperature increase is a bit less (or could actually be a decrease since the y-axes have different zero-lines). Whatever is causing the variability from year to year (even noise?) could then affect both measures in a similar manner. And none of this has anything to do with why either measure is trending upwards. Is that close? skywatcher @379 so would effects of ENSO and volcanic activity account for the seeming lag in the graphs where temperature differentials from the previous year appear to increase or decrease 12 months or so before measured CO2 differentials from the previous year? -
chriskoz at 17:14 PM on 31 August 2012Realistically What Might the Future Climate Look Like?
I agree with Tom's commentary on Dale's opinion. Further, I want to point that Dale's "BS" acronym can be taken as inappropriate, inflammatory term that he should also apologise for. As Dale admits in his closing comment @40, his opinion (or more precisely his way of opining) is indeed inappropriate, not only for this site but for any decent site. If Dale adheres to his closing comment do do not opine on this site anymore, I will not be missing him. -
Bernard J. at 16:30 PM on 31 August 2012Matt Ridley - Wired for Lukewarm Catastrophe
Bernard J. @46. I'm sorry, but without the supporting data all you have done is draw a pretty picture that you are asking us to take on faith. I have a math degree, so I don't think I will swoon if post [sic] the supporting data.
A degree in mathematics?! As others have noted, your naïve treatment of the CO2 data is very much at odds with that claim. However, if it is true, you shouldn't need to see my supporting data. You should be able to see that I performed an analysis that fits the entire Mauna Loa record, and with a bit of application of that claimed degree in mathematics, very soon have a close replication of the graph. I'm extremely curious to see if you are able to replicate the graph, because Tim Curtin with his self-styled skill in statistics never managed what is in the end really a simple procedure. If this turns out to be beyond the skills of someone with a mathematical degree, I might provide a step-by-step description of the process in a few more days, but I really would like to see that you've attempted to arrive at a fit rather more sophisticated than a linear or an exponential fit - for goodness' sake, your own graph and Tamino's explanation should tell you that an exponential fit is rather off base, even with a regression coefficient of 0.98. -
Dale at 16:13 PM on 31 August 2012Realistically What Might the Future Climate Look Like?
Tom: I've already given my opinion, but it was deemed not appropriate for this site. I will not be giving it again. Thanks -
Tom Curtis at 14:54 PM on 31 August 2012Arctic Sea Ice Extent: We're gonna need a bigger graph
Reflecting the title, the NSIDC Sea Ice Index is already at the bottom of the graph above and still heading south. At the next update, the graph will have run out of room. -
CO2 lags temperature
David Sanger - and other readers: The simple lesson from this particular paper is this: If someone de-trends the data, as Humlum did in that graph, they are no longer examining the trends, and therefore cannot conclude anything about them. This is actually a fairly common mistake - any number of papers have filtered out the trends, and then attempted to state conclusions about the very data they have excluded from analysis. Very sad...Moderator Response: [DB] Revised text per request. -
Tom Curtis at 14:41 PM on 31 August 2012CO2 lags temperature
David Sanger @377, the three authors of the paper are all well known climate change deniers, ie, part of the 1% of climate change scientists who do not agree with the consensus. It is possible that "skeptical" sites are over stating the claims made in the paper, but unlikely they are outright misrepresenting them. Without having read the paper, however, all I can say is that such claims have been made repeatedly before - and always the evidence and reasoning in support of the claims has been dubious at best. In the case of one particular claim, ie, that anthropogenic CO2 has not significantly contributed to increased CO2 levels, the evidence against the claim is so firm that we should greet any paper purporting to prove otherwise with the same astonishment we would greet a paper purporting to re-establish the Ptolemaic (terra-centric)model of the solar system. -
skywatcher at 14:38 PM on 31 August 2012CO2 lags temperature
David, all that graphic shows is that detrended air temperature, which is mostly ENSO and occasional volcanic influences, is related to detrended CO2 with the annual cycle removed too. So there is a relationship betweent he variability of both graphs, no surprise there. It says absolutely nothing about what is causing the overall rise in either one, though clearly the skeptics would want you to believe that ocean temperature rise is causing CO2 rise. They ignore many things: 1: what is causing ocean temperature to rise? 2: why is ocean pH decreasing, if CO2 is being released from the oceans (which should cause pH to rise)? 3: Where is all our CO2 going? We release ~30GT per year, yet annual CO2 rise is only half that. [the truth is that it is going into the oceans, acidifying them.] 4: As linked above, the chemical signature of the CO2 is that from FF-derived carbon, shown by several independent lines of evidence. So lots of suspension of disbelief required before you can accept the Humlum paper. In fact, I suspect I'll find the suspension of disbelief when watching The Hobbit later this year a whole lot easier!Moderator Response: TC: Humlum et al, 2012 discusses a number of topics, only one of which is on topic on this thread. Could detailed discussion of the anthropogenic origin of CO2 be moved to the previously suggested thread; and discussion of the ocean as the source of global warming be moved to "Why ocean heat can’t drive climate change, only chase it" Thank you. -
Tom Curtis at 14:33 PM on 31 August 2012Realistically What Might the Future Climate Look Like?
Dale @35, the article on obesity and global warming, or at least the so called "skeptic" commentary on it, is exactly why I cannot take global warming skepticism seriously as an intellectual position. The article reports on a study by two medical doctors published in the Lancet which concludes that, all else being equal, obese people have a larger carbon footprint than non-obese people. You want to purport that this sort of claim is, "the type of BS that is making people scoff". It is very far from evident, however, that the claim that obese people have a larger carbon footprint is BS of any sort. Indeed, the proposition is inherently plausible, although I doubt that loosing weight would be the most cost effective way for most westerners to reduce their carbon footprint. (On the other hand, it is a low cost method of doing so with substantial secondary benefits.) Of course, claiming that it is absurd to believe that obesity increases carbon footprints is a hard sell. So you misrepresent the article as claiming that obesity causes global warming. That of course, would be absurd, but it is not anything like what the author of the news article or the original study claim. Indeed, the word "cause" does not even appear in the article. The closest the article comes to saying anything like that is when it says:"Obese and overweight people require more fuel to transport them and the food they eat, and a literally swelling global population will make this source of greenhouse emissions worse, say UK researchers."
That is, obese people generate more CO2 emissions than equivalent non-obese people, and this source of additional emissions will increase with increases in obesity. At this point, if you have any intellectual integrity, you will apologize for providing such a misleading example; and you will be asking some hard questions of the AGW deniers that steered you wrong on this article. You will also be applying much more skepticism to those deniers. I doubt any of the above will happen, of course. Why would I expect anything like it from somebody who thinks Anthony (AHI*) Watts is as informative as SkS. (*Antarctic Heat Island) -
chriskoz at 14:32 PM on 31 August 2012Realistically What Might the Future Climate Look Like?
Sphaerica @8, Your latest ostrich defence reminds me past arguments by the "skeptics" that "warmists" are trying to "return us to the caves" and that "warmists" also deny the "skeptics" a voice is this "debate". Now we have an example of delialists trying to both deny climate scientist their voice (by suggesting they renounce their internet access) and return us to the caves (by dumping the non carbon-neutral technology rather than changing its underlying power infrastructure). Can you imagine a better comedy of self-contradicting nonsense? I don't know if I have to LOL or simply cry over the fact how low a human stupidity can descend... -
scaddenp at 14:24 PM on 31 August 2012CO2 lags temperature
This seems very similar to earlier effort with same message and also published at GPC. It is discussed at Realclimate here. -
davidsanger at 14:16 PM on 31 August 2012CO2 lags temperature
Thanks. I'm quite newly involved in climate issues and when I see a reference like this posted in a skeptic site always want to read the original paper (and any discussion here) to see if it really says what they say it does. Often a quote is pulled out of context where the authors meant something quite different indeed. When a paper is hidden behind a pay wall it is difficult and frustrating since there is no way to evaluate it. If this is really suspect then how can a paper like this be accepted in a journal? Here's a graph from the study (similar to ones I've seen on skeptic sites: It seems to be tracking changes in sea and air temperature and "global CO2". Is there some other process that would present the same seeming correlation and timing but which the authors are missing?
As a non-expert it is difficult to counter message like on Watts today without understanding what is going on. Thanks
It seems to be tracking changes in sea and air temperature and "global CO2". Is there some other process that would present the same seeming correlation and timing but which the authors are missing?
As a non-expert it is difficult to counter message like on Watts today without understanding what is going on. Thanks
-
Tom Curtis at 14:13 PM on 31 August 2012CO2 lags temperature
David Sanger @373, I have not read the paper which, as you say, is behind a paywall, but: 1) They appear to be ignoring Shakun et al, 2012 on the issue of CO2 lag; 2) They are absurdly wrong on the relation between CO2 increase and anthropogenic emissions (I also recommend Climate Change Cludoe: Anthropogenic CO2 on this issue); and 3) Arguments that ocean warming has called recent temperature rise generally start by assuming all ocean warming is natural, and then establishing a correlation between ocean temperature rises and global temperatures rises. As the ocean constitutes 705 of the Earth's surface, unsurprisingly they find a large correlation; but the argument is entirely circular. They assume what they set out to prove when they assume the ocean temperature increase is not caused by global warming. All three authors have a past history of exactly that sort of argument, so I do not expect anything different this time around. -
Paul Magnus at 14:12 PM on 31 August 2012Arctic Sea Ice Extent: We're gonna need a bigger graph
Looks like the graph function is transforming to a sawtooth! -
CO2 lags temperature
David Sanger - I have not yet had a chance to read through the paper, but some of the abstract is quite odd. "Changes in ocean temperatures appear to explain a substantial part of the observed changes in atmospheric CO2 since January 1980." - Based on ice core evidence, it takes 500-800 years for CO2 to respond to ocean temperature changes, and the 100 ppm change seen between glacial and interglacial periods is associated with 5-6C of temperature change. Since 1980 (32 years) we've seen 0.5C of warming and more than 50 ppm increase. Those numbers just don't support their conclusions. Even more damning, ocean CO2 is increasing as the oceans acidify. They cannot be the source of CO2 increase. Given those basic issues wherein the facts contradict this papers conclusions, I suspect the paper as a whole is not a contribution to science.
Prev 1089 1090 1091 1092 1093 1094 1095 1096 1097 1098 1099 1100 1101 1102 1103 1104 Next


