


 Arguments


Recent Comments
Prev 1208 1209 1210 1211 1212 1213 1214 1215 1216 1217 1218 1219 1220 1221 1222 1223 Next
Comments 60751 to 60800:
-
pbjamm at 00:12 AM on 5 May 20122012 SkS Weekly Digest #17
Hot sure where else to put this but it is so crazy that it has to be posted. Other readers of Climatecrocks will prob already have seen this. http://climateconference.heartland.org/our-billboards/ "Scientific, political, and public support for the theory of man-made global warming is collapsing. Most scientists and 60 percent of the general public (in the U.S.) do not believe man-made global warming is a problem. (Keep reading for proof of these statements.) The people who still believe in man-made global warming are mostly on the radical fringe of society. This is why the most prominent advocates of global warming aren’t scientists. They are murderers, tyrants, and madmen." We are through the looking glass... -
DSL at 23:55 PM on 4 May 2012Ocean Heat Content And The Importance Of The Deep Ocean
BC, note the "related SkS posts" links at the bottom of the article above. -
DSL at 23:46 PM on 4 May 2012Two Centuries of Climate Science: part two - Hulburt to Keeling, 1931- 1965
BC, there are a range of forces working at different speeds and volumes. Go here for a look at the basics of upper ocean mixing. Go here for a very thorough and technical look at mixing in general wrt energy exchange. Go here for a general look at large-scale ocean currents. Here is a SkS article on the subject, and that is where anyone else who replies to BC--and BC--should post. -
Realist at 23:25 PM on 4 May 2012Richard Alley - We Can Afford Clean Energy
[snip]Moderator Response: [Dikran Marsupial] Please note that posting comments here at SkS is a privilege, not a right. This privilege can be rescinded if the posting individual treats adherence to the Comments Policy as optional, rather than the mandatory condition of participating in this online forum. Please take the time to review the policy and ensure future comments are in full compliance with it. Thanks for your understanding and compliance in this matter. N.B. Your earlier post (#65) was considered to be inflamatory/offensive by at least one poster (and I can understand the reasons). I didn't delete that post either. Perhaps your time might be better spent considering why your post elicited the response that it did, rather than causing unnecessary work for the moderators. This is my last word on the subject. Except to say that military budgets are now off-topic for this thread, any further posts that mention this will be deleted. -
muoncounter at 23:13 PM on 4 May 2012It cooled mid-century
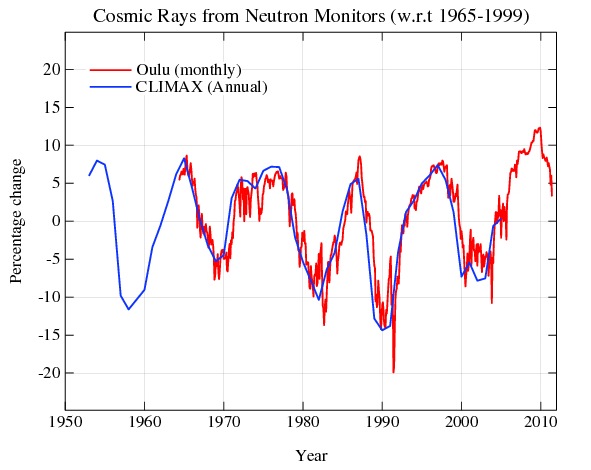
"Any evidence that aerosol loading from tests and large enough and continuous enough to have a significant effect..." Not much. It takes a yield of at least 50 ktons to make a cloud tall enough to reach the stratosphere. Large yield testing didn't begin until 1952; mid-century cooling started several years prior to that (there's a lag problem). And the USGS shows that it is not dust as much as sulfate aerosol that causes detectable multi-year cooling. About the only significant climate-scale result from nuclear testing is the C14 spike. And that doesn't make a blip in the older cosmic ray records. -
BC at 23:10 PM on 4 May 2012Two Centuries of Climate Science: part two - Hulburt to Keeling, 1931- 1965
Can someone explain how on the one hand the oceans' layers don't mix much at all. On the other hand there are the AMOC and La Nina and other ocean flows where the deeper layers come to the surface and vice versa? And these ocean flows have a huge impact on the worlds climate so they seem to be very significant. -
Realist at 22:46 PM on 4 May 2012Richard Alley - We Can Afford Clean Energy
[snip]Moderator Response: [Dikran Marsupial] It is the job of the moderators to draw the line where posts are considered to have contravened the comments policy, not yours. Making unnecessary work for the moderators by repeatedly posting moderation complaints is not doing you any favours. Please restart the discussion in more civil manner as I have asked both sides to do. If you feel a post is offensive, then please feel free to say so, but the best thing to do is not to respond in kind and instead prove your case using rational argument. -
CBDunkerson at 21:24 PM on 4 May 2012Richard Alley - We Can Afford Clean Energy
#69 "No my point is that some people will always argue the military budget is optional or too big, no matter how small." Umm... you do realize that no one here has made that argument right? I mean, people have pointed that out repeatedly now, but you seem to keep returning to this 'argument' that doesn't actually exist. -
pauls at 19:41 PM on 4 May 2012Lessons from Past Predictions: Hansen 1981
#7 dana1981 - Equilibrium climate sensitivity is usually measured in GCMs by incorporating a 'slab ocean' - i.e. an 'ocean' which is little more than a surface with a low heat capacity. This is done because fully equilibrating a GCM with a realistic model of the ocean can take several centuries to millennia due to thermal inertia, and that means a large computation expense. Point being, representation of oceans can't have much effect on ECS, as traditonally measured. -
John Cook at 19:05 PM on 4 May 2012Lessons from Past Predictions: Hansen 1981
"ancient projection"? 1981 wasn't that long ago, you whipper snapper! :-) -
Realist at 19:01 PM on 4 May 2012Richard Alley - We Can Afford Clean Energy
[snip]Moderator Response: [Dikran Marsupial] All concerned need to cool down. Please leave the moderation to the moderators. -
Realist at 17:17 PM on 4 May 2012Richard Alley - We Can Afford Clean Energy
Phillippe [snip]. Libya, Afghanistan, Bali twin towers etc come to mind You can't wait for a war before forming a military. My reference to France and England was a reference to those saved by previous US budgets (and implied short memories). Scaddenp, you are one of the few who can disagree without resorting to personal insults and name calling which is too common on this site. I won't even bother answering #66. If you are not prepared to say it face to face you shouldnt say it online! No my point is that some people will always argue the military budget is optional or too big, no matter how small. Was probably happening in 1938 too.Moderator Response: [Dikran Marsupial] Inflamatory material snipped. Please can all parties get back to a more civil tone of discussion. -
Philippe Chantreau at 14:36 PM on 4 May 2012Richard Alley - We Can Afford Clean Energy
Realist @ 65: that comment is underhanded and has nothing to do with the reality of the current geopolitical situation. If your allusion to France, England and Australia is in reference to WWII (which it inevitably is), then relating that to the current idea of "budget" is inappropriate. The circumstances back then (70 years ago) were so completely different as to make any discussion of "budget" misplaced and misleading. There was a world war against a madly destructive ideology. The situation was dire. It was not a matter of working out a budget but of devoting all available resources to the highest priority of the moment. Comparing that to anything happening nowadaysModerator Response: [Dikran Marsupial] Accusation of dishonesty snipped. Please accept my applogies, more was snipped than I had intended. -
scaddenp at 13:13 PM on 4 May 2012Richard Alley - We Can Afford Clean Energy
Realist, you seem to be missing the point - military budgets show that governments can raise the budgets to combat significant external threats. Climate change is surely one. If averting an asteroid strike required a similar expenditure without the ability to know who was going to take the main punch, do think we could raise the money? Or would the problem be so politically tough that we would take the "adaption" route and hope some other country would take the direct hit? -
Tom Curtis at 13:13 PM on 4 May 2012Richard Alley - We Can Afford Clean Energy
Fantasist @65 holds cheap the Australian lives spent in support of their ally in Korea, Vietnam, Somalia, Iraq and Afganistan - conflicts in which Australia had (and in the case of Afghanistan, has) no national security interest. He thereby demonstrates not only that his world view is delusional, but that it is offensive as well. -
scaddenp at 13:09 PM on 4 May 2012It cooled mid-century
Hmm, I'm skeptical. Any evidence that aerosol loading from tests and large enough and continuous enough to have a significant effect on aerosol loading compared to industrial emissions? -
Realist at 12:56 PM on 4 May 2012Richard Alley - We Can Afford Clean Energy
Andy I agree. Many countries would not be what they are today without what the US military budget has done for them. Poland, France, England, Australia, Libya to name a few. -
bill4344 at 12:26 PM on 4 May 2012Why Are We Sure We're Right? #2
Typo: Rob 3rd para 'dramaticly'.Moderator Response: [RH] Thanks. -
r.pauli at 11:58 AM on 4 May 2012It cooled mid-century
Between 1944 and 1980 there were more than 1800 nuclear explosions were conducted - many above ground - including the biggest H-bombs. This time period was a mini-nuclear winter. -
Andy Skuce at 11:56 AM on 4 May 2012Richard Alley - We Can Afford Clean Energy
Realist @63 I wasn't actually advocating cutting the military budget, just pointing out that if we can afford spending sums like that protecting one country from possible threats from another, we could perhaps spend a smaller sum to protect everyone from probable harm resulting from everyone else's emissions. If we don't mitigate emissions, I expect that we'll have to increase military budgets to cope with the imbalances that climate change will provoke. The US military actually has a rather sane perspective on climate change, as Peter Sinclair's excellent video shows: US Military Forges Ahead with Climate Security. Deniers Still Looking for WMDs. -
Realist at 11:40 AM on 4 May 2012Richard Alley - We Can Afford Clean Energy
Andy #62 Why stop at cutting the military budget by half? You could also cut the budget of all police forces, justice systems and prisons by half to raise even more funds. -
supak at 10:22 AM on 4 May 2012Two Centuries of Climate Science: part two - Hulburt to Keeling, 1931- 1965
@les They have all kinds of markets at Intrade. You can even predict when they'll find the Higgs Boson. But yes, the climate markets are the one market that's money in the bank if you play it right. And they encourage insider trading! @muoncounter This is the data they go by for the monthly and yearly temp anomalies. As I continue betting in the future, the chances of .55s paying off gets higher. -
Bob Loblaw at 09:53 AM on 4 May 2012Lessons from Past Predictions: Hansen 1981
Dan Olner (and dana1981): There is a really big difference between the 1981 and 1988 papers in terms of the type of models. The 1981 paper used a one-dimensional radiative-convective model, which resolves the vertical atmosphere and detailed radiation transfer very well, but has no "geography" - it simulates a global average condition, and the primary output is a single temperature profile. The 1988 paper used a 3-d general circulation model. Completely different beasts. It's not a matter of the 1988 work being a tweaking or adjustment of the 1981 model - it's a major change in the analysis. In 1981, a radiative-convective model (RCM) would have been well-developed, and the success in getting a sensitivity close to today's "best estimate" is [you choose] a) somewhat fortuitous, or b) an indication that even a 1-d model of this type can represent many of the important factors. You don't see much use of RCMs these days, when it comes to trying to narrow down sensitivity - they don't do the things that need to be examined. In 1988, GCMs were still undergoing significant development - as they are today, muchly due to greatly increased computing power. GCMs are hungry beasts, and eat CPU cycles like Chiclets. Everyone on the team likely wants some extra FPU time, and a faster computer will always let you do more stuff that was only a gleam in the eye last year. In 1981, Hansen et al wouldn't have had the horsepower to run a GCM (they did exist) over a time period like they did with the RCM. -
Andy Skuce at 07:46 AM on 4 May 2012Richard Alley - We Can Afford Clean Energy
steve from virginia @45: "Alley's supposition is incorrect because it does not include the economic effect of a successful conversion on competitors." In many big European cities there was a job-intensive industry built around human waste disposal: emptying cess pits, hauling waste out of the city and selling it to farmers for fertilizer. Indeed, there was a lot of opposition to building proper sewage facilities from various vested interests, complacent government and even civil libertarians in the Victorian period. See my post on the Great Stink of London. "We cannot get a grip on our climate, fuel, food, water and other resource problems without acknowledging there will be large trade-offs and sacrifices. We cannot 'have it all'. " I tend to agree. The costs of mitigation are downplayed sometimes and the challenge we face in getting rid of carbon emissions is often made to sound too easy. However, if the world can afford spend 2.6% of its GDP on the military, as it does now, surely it could spend half of that sum instead on fighting climate change. The hardest part is the politics, not the economics or the engineering. -
scaddenp at 06:15 AM on 4 May 2012Two Centuries of Climate Science: part two - Hulburt to Keeling, 1931- 1965
Just a further addition, the log relation of concentration to radiative forcing drops straight out of the RTE - see Ramanathan and Coakley 1978. The basic radiative properties of the gases is based on experimental data but going back a long time. I dont have them to hand, but try Weart's excellent Discovery of Global Warming for the historical work. The same equations also predict the spectral signature which can be compared to observed. Eg See Harries 2001. -
dana1981 at 04:09 AM on 4 May 2012Why Are We Sure We're Right? #2
Lucas @1 - surface temperature changes have been consistent with a 3°C equilibrium climate sensitivity. See here, for example. We'll have more on this issue next week as well. -
Dikran Marsupial at 03:13 AM on 4 May 2012There's no empirical evidence
@einhverfr further to what DSL wrote, the source code for several GCMs are in the public domain, so if the journal papers that explain the assumptions are not sufficient, you can always download the code and find out for yourself exactly how they work and test out the sensitivity of the projections to those assumptions by altering them and running some simulations. If you can show something interesting then there is nothing to stop you from submitting a journal paper questioning the assumptions. It is interesting to note there has been no attempt by the skeptics to make a GCM that explains the observed climate without CO2 (they seem to much prefer statistical models). I suspect that there is a good reason for this, which is essentially that it can't be done without making obviously unrealistic assumptions about the physics. -
Lucas Verma at 03:04 AM on 4 May 2012Why Are We Sure We're Right? #2
"the Earth's surface will warm on average approximately 3°C in response to doubled atmospheric CO2." Based on what we know, this seems a reasonable statement, CO2 should reduce emission to space and given observations, around a three degree rise in temperatures should be required to return emission to space to pre CO2 increase levels. But observations of surface temperature change indicate a rate that's about half of the 3 degree rate. We know we are right that CO2 should increase surface temperature, but we don't know how much. -
Tom Curtis at 03:04 AM on 4 May 2012Two Centuries of Climate Science: part two - Hulburt to Keeling, 1931- 1965
Jeff18 @14, the constant change in temperature per doubling of CO2 is primarily a consequence of the fact that the radiative forcing of changed CO2 levels is constant per doubling. The direct radiative forcing is known from detailed studies using radiative transfer models, the results of which are directly compared with observations. To get an idea of the accuracy of the models, I suggest you read my post, "Warm Earth, Cold Atmosphere", particularly the sections, "No more hand waving" and " Settled science"; and also my comment 43. The actual temperature response depends on feedbacks, which are not as well known. Therefore they may vary from the equal temperature change per doubling of CO2, but because the change in forcing is constant, they will not vary much, and certainly not enough to make the response near linear. -
shoyemore at 02:57 AM on 4 May 2012New research from last week 17/2012
The Yiou et al paper on the Medieval Climate Anomaly appears to be saying that while temperature dropped in the Little Ice Age, there was not much change in weather apparent. We find that the transition from a Medieval Warm Period to a Little Ice Age in the North Atlantic does not imply changes in patterns or frequency of weather regimes, although the mean surface temperature change is significant. The MCA was 950 to 1250, the LIA 1350 to 1850 - if there was fairly uniform weather for that milennium, it seems to rule out the idea of balmy and mild weather around 1000 influencing historical events like the Norse expansion. Makes sense, since the alleged cold weather around 1600 did little to hinder English and French expansion to North America. Danish missionaries returned to Greenland in the 18th century. But maybe I am readng too much into it? -
Riccardo at 02:57 AM on 4 May 2012Two Centuries of Climate Science: part two - Hulburt to Keeling, 1931- 1965
Jeff18 there can obviously be no experimental data on the effect of doubling CO2 concentration on current climate. Though, the forcing can be calculated fairly accurately. The "standard" reference is Myhre et al. 1998. -
Jeff18 at 02:40 AM on 4 May 2012Two Centuries of Climate Science: part two - Hulburt to Keeling, 1931- 1965
My thanks to Tom Curtis and scaddenp for their response regarding my post about the planet Venus. When I said it was about 800 degrees hotter than Earth that was degrees F. I should have made that clear. If the temperature change related to CO2 is not linear, that certainly throws my calculations out the window. When you say the temperature change goes up for each doubling of CO2, is there experimental data to back that up? How was that determined? Any publications for that? Thanks. -Jeff -
shoyemore at 02:39 AM on 4 May 2012John Nielsen-Gammon Comments on Continued Global Warming
N-G has a new post up at his website, responding to comments about the post in the thread. http://blog.chron.com/climateabyss/2012/05/lack-of-warming-a-followup/ -
DSL at 01:13 AM on 4 May 2012There's no empirical evidence
einhverfr, "assumption" is a loose word in science (about as loose as "consensus"). If you want to learn about what goes into IPCC modeling, you could go directly to the source (noting, of course, that this is AR4 from 2007). Go here for discussion on range. -
dana1981 at 00:59 AM on 4 May 2012Lessons from Past Predictions: Hansen 1981
Dan Olner - the overall difference is that the sensitivity of the model used in 1981 was 2.8°C while the sensitivity of the model he used in 1988 was 4.2°C. Evidence now indicates that the sensitivity of the '81 model was quite close to the real-world. As to why the sensitivity of the earlier model was closer to the real-world value, that's a difficult question to answer, because model sensitivity is a result of the many different complex parameters of the model. It probably has something to do with the representations of the oceans and ocean processes, which are very difficult to model, as I understand it. But that's a question for a modeling expert, which I am not. Regardless, the bottom line is that both model projections suggest that real-world sensitivity is close to 3°C for doubled CO2. The most interesting aspect of these old model projections is not whether they were "right," but what we can learn from them. -
Dan Olner at 00:25 AM on 4 May 2012Lessons from Past Predictions: Hansen 1981
John #5: that's a plausible explanation for me, if it's right, and does fit with what Dana appears to have said. That is: the model structure was good in 81. Calibration later provided better sensitivity estimates. That still leaves me wondering why the model method's skill seemed to get worse in the intervening years (or wondering if an entirely new modelling approach was used... I should read the papers, shouldn't I!?) I take your point on getting lucky: precisely why testing through straightforward data-fitting is always a bit tricksy. But if sensitivity estimates improved in the intervening years, I'd have expected the model range to become more accurate too. The problem's at least in part that the 81 model doesn't appear to supply any range/s.d. values - maybe the full paper does? -
einhverfr at 00:22 AM on 4 May 2012There's no empirical evidence
Question: For these predictive models, what is their range of predictions? And what are their assumptions? Do we get access to those assumptions and get to question them? -
KR at 23:34 PM on 3 May 2012John Nielsen-Gammon Comments on Continued Global Warming
johnd2 - The rate of ocean warming is actually fairly steady, as discussed in multiple threads here, such as The Earth is Warming. But if the ocean heat absorption varies only a tiny bit (proportionally) in the presence of an ongoing forcing imbalance, that amount of energy can cause a quite large variation in the atmosphere. The atmospheric temperature delta then becomes the 'tail' on the ocean variation 'dog'. -
DSL at 23:09 PM on 3 May 2012GHG emission mitigation solutions - a challenge for the Right?
Why look, scaddenp, even the far right has no problem with being green. In a few years, in fact, we'll undoubtedly see them come out with their own final solution to global warming. -
John Russell at 21:49 PM on 3 May 2012Lessons from Past Predictions: Hansen 1981
@Dan #4 Mine is a layman's comment; but the way I've always thought of model predictions is not -- as fake sceptics like to portray them -- scientific fortune telling where success is measured on how close they prove to be to reality; but rather as useful indicators, which might or might not work out depending on whether the parameters that they are built on, change. It's therefore possible for a model prediction to 'get lucky' -- like picking the Derby winner -- but not technically be as useful as another model where a base parameter changed after publishing but the model usefully predicted what could have happened. I guess what I'm saying is that it's probably best not to trumpet the 'success' of models that happen to 'get lucky' because it then makes it more difficult to defend models that didn't. The truth is, 'right' or 'wrong', they're all useful in their own way. Have I got this right? -
robin6721 at 21:05 PM on 3 May 2012We're coming out of the Little Ice Age
muoncounter " Perhaps a look at the thread, 'Its the Sun' (#2 on the Most Used Myths) is in order." That proves my point perfectly, not a single mention of the very large solar wind variations.Moderator Response: TC: Nor is there anywhere I have come across a single plausible mechanism explaining how variations in solar wind could influence the Earth's temperature. However, if you are aware of such a mechanism, by all means discuss it on the relevant thread. Of course, if your "plausible mechanism" is the modulation of Cosmic Galactic Rays, I note that that is discussed under the "It's the Sun (advanced)" article; but that the most appropriate thread is here. In either event, further pursuit of either argument is of topic on this thread, and may result in summary deletion of your posts. -
Dan Olner at 20:20 PM on 3 May 2012Lessons from Past Predictions: Hansen 1981
I hope you'll know I'm not being 'skeptic', in the climate sense of that word, but I am a bit confused. This appears to be saying that Hansen's 1981 work is good because it made a reasonably accurate prediction. But the previous take on his later 1988 work doesn't make sense to me: "Hansen's 1988 projections were too high mainly because the climate sensitivity in his climate model was high. But his results are evidence that the actual climate sensitivity is about 3°C for a doubling of atmospheric CO2." So I don't really know what's being said. If predictive success is the criteria, didn't Hansen get something wrong in the later work? If so, what changed? If, as I think the 1988 analysis is saying, the point is rather that Hansen's model structure was correct, but he just got some parameter values a bit skewy, *why* were they skewy? How did his work make worse predictions later? Don't we want predictive success to be the criteria for climate models, and shouldn't that include asking how incorrect sensitivity estimates were arrived at? I'm imagining the answers are in the papers somewhere, based on what kind of modelling each was doing, so apologies - this is just a first-glance reaction. -
Rob Painting at 20:06 PM on 3 May 2012John Nielsen-Gammon Comments on Continued Global Warming
johnd2 - the transfer of heat into the ocean is through one means only - sunlight. Greenhouse gases trap heat in the ocean in much the same way that they trap heat in the atmosphere - via slowing the loss of energy (heat) out of the ocean. It is by this mechanism that the oceans warm over time. See SkS post: How Increasing Carbon Dioxide Heats The Ocean As counter-intuitive as it may seem, El Nino is when the Earth loses energy -as heat is given up to the atmosphere and is eventually radiated away to space, and La Nina is when the Earth gains energy - as heat is buried in the subsurface layers of the western tropical Pacific and upwelled cold water, on the other side of the ocean, is brought to the surface to be heated by the sun. The global picture is more complex, but that's the basic gist of ENSO's effects. -
johnd2 at 18:59 PM on 3 May 2012John Nielsen-Gammon Comments on Continued Global Warming
These El Nino-related arguments seem quite plausible at explaining year-to-year variations in warming trends. But one thing puzzles me as a relative layman in this field: It seems like the oceans have a huge capacity to buffer and blunt the effects of GW, potentially for many years to come. But the kinetics of heat transfer into the oceans seem slow and variable - otherwise why would these ENSO patterns have such an effect on apparent warming. So why is heat transfer into the oceans apparently so slow and inconsistent? (I know there's probably not a simple answer to this, but if anyone is looking for a subject for a future topic post...) -
Michael Whittemore at 17:56 PM on 3 May 2012Richard Alley - We Can Afford Clean Energy
@ Tom Curtis, I wanted to ask if you know of a way to ask a question about a paper here at skeptical science. -
Paul Magnus at 15:53 PM on 3 May 2012ABC documentary demonstrates the how and why of climate denial
It would be grat if you had a db also about ways to discuse reasons for reducing ff directly aand specificlly like arguments for coal reduction or what we shouldn't ship the stuff to china because some one else will etc etc. See here .... http://thinkprogress.org/climate/2012/05/02/475761/climate-change-message-objective-reality-urgent-crisis-we-must-talk-about-it/#comment_link -
DSL at 12:56 PM on 3 May 2012New research from last week 17/2012
Nice, Ari. In a lovely world, we would pick one of the articles and coax the author(s) on for a little Q&A. -
Tom Curtis at 12:40 PM on 3 May 2012Richard Alley - We Can Afford Clean Energy
Realist @59, I agree. However, that is just another way of saying the cost of the energy lost as waste heat in the production process is small relative to the total production costs. If that remains the case into the future, then the energy costs continue to be small, so that waste heat is not a significant problem. On the other hand, if energy costs increase as Dave 123 expects, then recovering waste heat will be economical, and most of the waste heat will be recoverable as energy. In either event, waste heat from steel manufacture does not shown any particular impediment to conversion to a renewable economy. -
muoncounter at 11:56 AM on 3 May 2012We're coming out of the Little Ice Age
robin#53: "Given the minimal cooling following Krakatau (VEI6)," Given? Perhaps you could offer a citation for that 'given,' hopefully someone more substantial than Eschenbach. But here's a USGS study comparing Tambura, Krakatoa and Agung: ... decreases in surface temperatures after the eruptions were of similar magnitude (0.18-1.3 °C). The amount of material injected into the stratosphere, however, differed greatly. By comparing the estimated amount of ash vs. sulfur injected into the stratosphere by each eruption, it was suggested that the longer residence time of sulfate aerosols, not the ash particles which fall out within a few months of an eruption, was the paramount controlling factor (Rampino and Self, 1982). "so few people consider the large changes in the particular output of the Sun" Perhaps a look at the thread, 'Its the Sun' (#2 on the Most Used Myths) is in order. -
scaddenp at 11:39 AM on 3 May 2012We're coming out of the Little Ice Age
robin - well Maunder minimum, being the description of a solar event, has nothing to do with volcanic activity. If you meant that LIA was caused by volcanic activity, then no, the science doesnt believe that either. Instead, it is postulated that solar variation, compounded by volcanic activity were cause of LIA. Explanations for LIA have to account for response of climate to other variations on solar activity; and to spatial pattern of LIA temperatures (much more pronounced in NH).
Prev 1208 1209 1210 1211 1212 1213 1214 1215 1216 1217 1218 1219 1220 1221 1222 1223 Next


