


 Arguments


Recent Comments
Prev 1217 1218 1219 1220 1221 1222 1223 1224 1225 1226 1227 1228 1229 1230 1231 1232 Next
Comments 61201 to 61250:
-
SirNubwub at 07:00 AM on 23 March 2012Inhofe's Myths on Maddow
Dana1981 @1: Yes, all regulations affect life, but full-blown regulation of CO2 will affect more aspects of life than most (if not all) other regulation programs Albatros @5 Yes, I have been strongly skeptical in the past, but this website has made me acknowledge that maybe the alarmists have a point. BUT...what I am discussing here is that I have problems with are writers who say plainly wrong things, like “Perhaps the implication is that CO2 limits will regulate breathing“. I hope you have problems with statements like that too. The ramifications of the laws will affect so many different aspects of life that we need to take the discussion seriously. Philippe Chantreau @7 Here are newspaper articles that are the foundation of what you consider to be my scare tactics. Food control: (-snip-) Population control: (-snip-) Person fuel control: (-snip-) Vacation control: (-snip-) Television control: (-snip-) John Hartz @10 I use this website as my main source of clear understandable pro-AGW arguments. This website has actually moved me from being a scoffing adamant denier to one who is now willing to admit that the case is not so clear cut and the pro-AGW may be right. I will engage in meaningful conversation. My only point in my comment is that the authors statement of “Perhaps the implication is that CO2 limits will regulate breathing” is NOT meaningful conversation and seems to be made in a disingenuous way. Composer99 @15 What claims are you referring to? I have no problem with the legality of the government imposing cap and trade taxes, My problem is with people claiming that legal limits on CO2 mean that the government will regulate breathing.Response:[DB] Skeptical Science keeps the focus on the science of climate change. Typically this means an emphasis on peer-reviewed published studies appearing in reuptable journals to support one's position. A reliance on newspaper articles to support a position far off-topic to the OP of the thread is a call for moderation. This thread is on Inhofe's Myths on Maddow.
Off-topic snipped, as applicable.
-
dunc461 at 06:48 AM on 23 March 2012Roy Spencer's Bad Economics
Scaddenp - Thank you very much for the site reference. It led me to a spreadsheet version of the Dice program C – 1 on http://www.econ.yale.edu/~nordhaus/homepage/DICE2007.htm . After review of this spreadsheet I feel there is good agreement between the portion of his model dealing with abatement/preventative costs and mine. Of course his model is much more comprehensive but because his “abatement cost equation is a reduced-form type model in which the costs of emissions reductions are a function of the emissions-reduction rate.” It tells us nothing about how those reductions are to be achieved. Based on total carbon emissions for his base case he expects energy usage in 2055 to be 166% over current and 233% in 2105. Based on total carbon emission for his “optimum” case he expects energy from fossil fuels to be 126% of today’s values in 2055 and 140% in 2105 He projects total abatement costs for his optimum case to $1.6 trillion by 2055 and $12.3 trillion by 2105. If you plug his constraints into my spreadsheet you will find that although fossil fuel usage increases by 40% the energy supplied as a percent of the total drops from 86% to 51%. Holding nuclear and Hydro at current levels, Solar and Wind must contribute 44% by 2100 with 35% from wind and 9% from Solar unless the price of solar drops significantly. On the other hand, if you assume the price of solar does not drop and only 50% of the energy required to make up for limitation of fossil fuels can come from the wind with the other 50% coming from solar, the preventive costs jump to $65 trillion in 2050 and $373 trillion in 2100. That is why it is important to look at HOW we get from here to there. I am only trying to verify the assumptions Nordhaus and others are making with respect to abatement/preventative costs over the next 38 and 88 years. That is why I requested the latest information available on the inputs to my spreadsheet as I only have information that is available for free on the web. What is the latest thinking on future energy usage and fossil fuel limits? Is nuclear usage to be expanded? Can we expect significant reductions in solar PV costs in the next 38 years? Etc. With respect to your final comment, while my costs are report in US $, as are Nordhaus’s, we live in a global economy, the price of coal and oil is the same around the world. Most of the components for a power plant will be built by the countries that can supply them for the lowest costs. There might be some differences in construction labor costs and operating labor costs. But capital and fuel costs are the largest factors. Finally I must say that my faith in economists has been shaken. Despite the fact that it is well known the excessive private debt in the form of leveraging caused the depression the economists failed to warn us when the private debt as % of the GDP exceeded the levels reached in the late 1920’s in 1987.and went on to be almost twice as high in the early 2000’s. Nor did they attach any significance to the fact that it had taken 34 years US home ownership to grow by 3% but in 10 years starting in 1994 it grew by 7.8%. -
andylee at 06:15 AM on 23 March 2012Fred Singer Debunks and then Denies
"American Thinker" = "carboxymoron" :-) -
muoncounter at 06:04 AM on 23 March 2012Breaking News...The Earth is Warming... Still. A LOT
NickBoyce#58: Why are you assuming that all of the heat warms all of the ocean volume? The second figure in this post clearly shows indicates it is the heat content for water depths 0-2000m only. -
r.pauli at 05:35 AM on 23 March 2012Fred Singer Debunks and then Denies
We should remember some funding details for Singer: "Last year, he admitted that he had received from Exxon Mobil "an unsolicited and unexpected donation of $10,000 more than a decade ago." The Heartland leak shows that he currently receives "$5,000 per month, plus expenses" from the institute." http://www.guardian.co.uk/environment/2012/feb/15/climate-sceptics-pai-heartland-institute So $5K per month - plus expenses... has anyone put that onto a graph? -
kaustubh at 05:27 AM on 23 March 2012Fred Singer Debunks and then Denies
Singer also misrepresents the fact that proxies show warming as well: Proxy evidence for recent warming. -
Doc Snow at 03:48 AM on 23 March 2012New research from last week 11/2012
OK, I remembered an old bibliographic trick: when in doubt, search by date. Sure enough, it's Volume 18, not 15--though chalk one up for my memory; it really was p. 409. And the author was: S.A. Andree himself! Seems the intrepid balloonist wasn't content to leave publication to others, and wrote up his own data. V. 18, for any who may be interested: http://www.archive.org/details/forschungenaufd06wollgoog -
Paul from VA at 03:43 AM on 23 March 2012Stauning and Friis-Christensen on Solar Cycle Length and Global Warming
I believe EUV is Extreme UV which means the high energy/short wavelength portion of the UV spectrum. I believe that there is some research linking variations in the sun's EUV emission with weather on Earth. SSL - I agree it is likely solar cycle length. Or alternately SunSpot Number. Either way, I'm pretty sure it's a typo. SWAG - I have no idea.... -
Doc Snow at 03:39 AM on 23 March 2012New research from last week 11/2012
Found that Wollny's has (mostly?) been digitized, and v. 15 is available here: http://www.archive.org/details/forschungenaufd08wollgoog However, it does not appear that the article in question is in V. 15, so probably my memory was faulty. But there are a couple of articles on CO2; the first offers voluminous comparisons of near-surface measurements and soil measurements in various environments by one Herr Puchner; the second, a short summary of previous research, finds atmospheric concentrations of around 290 ppm. It begins on p. 478, and may be of interest--especially for those with good skills in reading German. When and if the pdf starts loading properly again, I'll recheck the reference to see if I can find the proper article. -
Doc Snow at 02:30 AM on 23 March 2012New research from last week 11/2012
Yes, the PDF loading seems to be 'stalled out' for me, too. But I'm not thinking of the primary author, who, as you say, would be the editor. The bulk of the article consists of a translation--set apart by the use of quotation marks--of an article (or maybe an excerpt from an article) from a publication called "Wollny's Forschungen," or more formally: Forschungen auf dem Gebiete der Agricultur-physik: Bd. 1 15 (I *think* it's vol. 15; that's what my not-so-reliable memory is dredging up for the citation in the AmMetSoc article. I even think it may possibly have been p. 409.) Anyway, it's the 'secondary author'--the author of the underlying article--that I suspect may have been Ekholm. I may have found an online source for Wollny's, but I want to check out the site before I try such a large download. I'll let you know what I find out. -
Dikran Marsupial at 02:24 AM on 23 March 2012Increasing CO2 has little to no effect
@Tom, many thanks for correcting my intuition, getting things wrong and having ones understanding challenged is an excellent way to learn! Forgetting that the water vapour is in the lower trophosphere should have been obvious even to me. ;o) -
Tom Curtis at 01:29 AM on 23 March 2012Increasing CO2 has little to no effect
Ruffy @120, to put this into perspective here is a graph of the energy content of solar radiation to the Earth by wavelength, along with important absorption bands: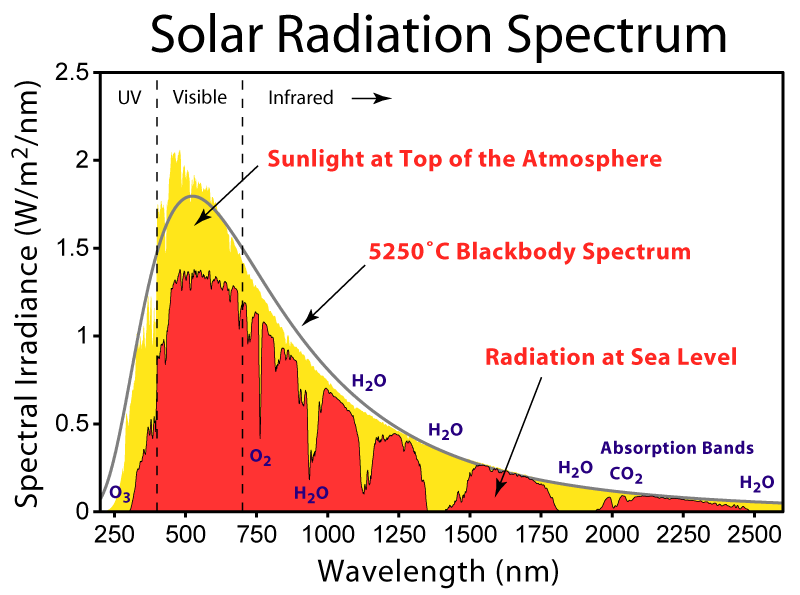 As you can see, the 49% figure is about right. However, very little of that 49% is in the wavelengths of the outgoing radiation, as can be seen by this diagram:
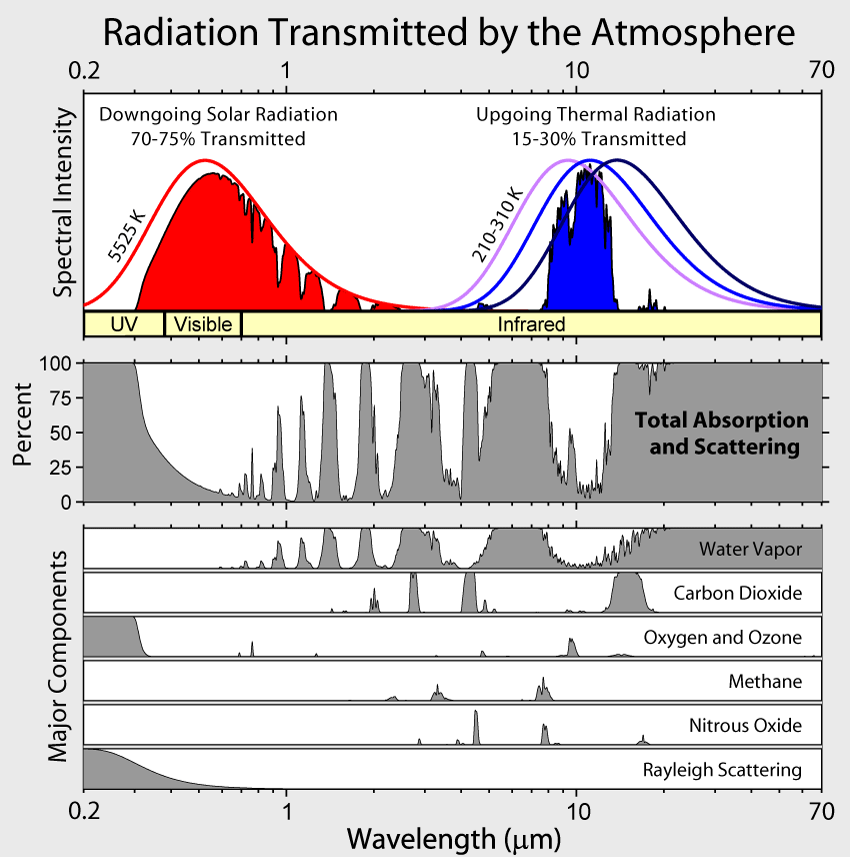 You will note that nearly all of the incoming solar radiation is absorbed by water vapour, or by the surface. As nearly all the water vapour in the atmosphere is in the bottom four km of the atmosphere, that means nearly all of the energy is absorbed at, or near the surface. Therefore I must disagree with Dikran Marsupial @124, not because his analysis is wrong, but because his assumption that the incoming energy is at frequencies where there is significant absorption by well mixed greenhouse gases (ie, GHG other than water vapour and ozone) is false.
It should be noted that the energy absorbed by water vapour near the surface from the sun is very small compared to the energy absorbed from the surface. Based on the energy balance by Fasulo and Trenberth, the near surface atmosphere absorbs around 450 W/m^2, compared to around 80 W/m^2 absorbed in the atmosphere (as significant proportion of which is UV radiation absorbed by the ozone layer). Given this, and given that convection ensures a well structured temperature profile in the lower atmosphere, the energy absorbed in the lower atmosphere can be treated as being absorbed at the surface for nearly all practical purposes.
That being the case, the IR radiation from the sun does not differ significantly in its effects from the visible light from the sun. It is absorbed at the surface. It is not directly reradiated but rather, redistributed as heat through the collisions of molecules, some of which then emit IR radiation at an entirely different wavelength, that radiation constituting the Earth's thermal radiation.
And, of course, to maintain an energy balance, the energy received by the Earth must equal the energy which leaves the Earth. If the Earth's IR radiation came only from the IR radiation received from the Sun, then about 50% of the Sun's energy would not be reradiated back to space. The resulting energy imbalance would be a catastrophe worse than a full nuclear exchange, even if maintained for a single day.
So, yes the Earth does receive IR radation from the sun, primarily at wavelengths where it is absorbed at or very near to the surface; but no it is not this component alone (or primarily) that results in the Earth's IR radiation from the surface or to space.
You will note that nearly all of the incoming solar radiation is absorbed by water vapour, or by the surface. As nearly all the water vapour in the atmosphere is in the bottom four km of the atmosphere, that means nearly all of the energy is absorbed at, or near the surface. Therefore I must disagree with Dikran Marsupial @124, not because his analysis is wrong, but because his assumption that the incoming energy is at frequencies where there is significant absorption by well mixed greenhouse gases (ie, GHG other than water vapour and ozone) is false.
It should be noted that the energy absorbed by water vapour near the surface from the sun is very small compared to the energy absorbed from the surface. Based on the energy balance by Fasulo and Trenberth, the near surface atmosphere absorbs around 450 W/m^2, compared to around 80 W/m^2 absorbed in the atmosphere (as significant proportion of which is UV radiation absorbed by the ozone layer). Given this, and given that convection ensures a well structured temperature profile in the lower atmosphere, the energy absorbed in the lower atmosphere can be treated as being absorbed at the surface for nearly all practical purposes.
That being the case, the IR radiation from the sun does not differ significantly in its effects from the visible light from the sun. It is absorbed at the surface. It is not directly reradiated but rather, redistributed as heat through the collisions of molecules, some of which then emit IR radiation at an entirely different wavelength, that radiation constituting the Earth's thermal radiation.
And, of course, to maintain an energy balance, the energy received by the Earth must equal the energy which leaves the Earth. If the Earth's IR radiation came only from the IR radiation received from the Sun, then about 50% of the Sun's energy would not be reradiated back to space. The resulting energy imbalance would be a catastrophe worse than a full nuclear exchange, even if maintained for a single day.
So, yes the Earth does receive IR radation from the sun, primarily at wavelengths where it is absorbed at or very near to the surface; but no it is not this component alone (or primarily) that results in the Earth's IR radiation from the surface or to space.
-
Dikran Marsupial at 21:28 PM on 22 March 2012Increasing CO2 has little to no effect
@Sapient fridge, many thanks, Wikipedia is fine for me (where it has external references), at least as a start. I think the thing that Ruffy might be missing is that a lot of that radiation will be absorbed by the GHGs in the atmosphere before it gets to the surface (which will only see the IR that is not in the absorption bands of H2O, CO2 etc.). I suspect most of this gets re-radiated back out into space (at each "layer" in the atmosphere half is re-radiated up and half re-radiated downwards, so the amount heading downwards decreases logarithmically?). That would be my intuition anyway. The point still remains however, as CBDunkerson mentions, that increasing CO2 will still increase warming at the surface by absorbing the IR re-radiated from the ground from incoming visible, UV and unabsorbed IR (which will be re-radiated at wavelengths included those that are absorbed by GHGs). -
cynicus at 21:15 PM on 22 March 2012Stauning and Friis-Christensen on Solar Cycle Length and Global Warming
Time for a new image to be added to the expanding list?- Global Warming - How skeptics blame the sun How realists observe the role of the sun
I think you all can imagine what image fit's this description... -
NickBoyce at 20:37 PM on 22 March 2012Breaking News...The Earth is Warming... Still. A LOT
By my calculations, an addition of (21)(10^22) joules to the world ocean's heat content should have raised the temperature of the the world's oceans by 0.0386*C. Maybe I'm mistaken. 10^9 = 10 to the power of 9, etc. (1) VolumeWorldOcean = (1.3)(10^9)((Km)^3) (Per Wikepedia). (2) 1 metre = 100 cemtimetres (cms). (3) 1 Km = (10^2cms)(10^3) = 10^5cms. (4) VolWorldOcean = (1.3)(10^9)((10^5cms)^3) = (1.3)(10^24)((cms)^3). (5) 1((cms)^3)water weighs 1g. (6) WeightWorldOcean = (1.3)(10^24)(g). (7) It takes (4.186)joules to raise the temperature of (1g)water by 1*C. (8) It takes (1.3)(10^24)(4.186)j to raise the the temperature of (1.3)(10^24)(g)water by 1*C. (9) it takes 1j to raise the temperature of (1.3)(10^24)(g)water by (1*C)/((1.3)(10^24)(4.186)) (10) It takes (21)(10^22)j to raise the temperature of (1.3)(10^22)(g)water by (1*C)(21)(10^22)/((1.3)(10^24)(4.186)). (11) It takes (21)(10622)joules to raise the temperature of the world's oceans by 0.0386*C -
Ari Jokimäki at 20:30 PM on 22 March 2012New research from last week 11/2012
Doc Snow, see the TOC of the issue in question. The Author of the article seems to be the Editor of Monthly Weather Review at that time. I bet that the name of the editor is in that issue somewhere. However, conveniently the PDF loading from that site stopped working for me, so I have to get back to you on that. -
CBDunkerson at 20:15 PM on 22 March 2012Breaking News...The Earth is Warming... Still. A LOT
NickBoyce, see the SkS article on underground heat flow. The amount of heat traveling up from the planet's interior is very steady and very small compared to major surface heat fluxes. -
CBDunkerson at 20:02 PM on 22 March 2012Increasing CO2 has little to no effect
Ruffy wrote: "About half of the energy in sunlight is near and short wave IR, and surely it is mostly this component of sunlight which heats the planet and is rebroadcast as longwave IR." So what do you imagine happens to the energy from visible light? Does it magically cease to exist or 'go away' somewhere? If so, why is it that white objects (which look white precisely because they reflect most visible light) do not heat up as much as black objects (which absorb most visible light)? Why does electromagnetic radiation in the range that we have arbitrarily labelled 'infrared' behave differently than that in the range we can see? -
adelady at 19:54 PM on 22 March 2012Breaking News...The Earth is Warming... Still. A LOT
NickBoyce That may be interesting to some people. The one I really, really want to know about is temperature changes in ice. We all know there's a huge difference between the ice in our domestic refrigerators and the same ice in an industrial scale freezer. What I'd like to get a handle on is how much and how fast the internal temperature of icesheet ice changes in the years before it finally gets to zero and is available for melting. I have an uncomfortable feeling that some of that 'missing' heat could be concealed in still frozen ice where the temperature has changed by 10, 20 or maybe more degrees C. But it hasn't yet reached melting point. It's just weaker and more susceptible to variations in the wind, the weather and any meltwater from other ice that has passed that point. -
Sapient Fridge at 19:30 PM on 22 March 2012Increasing CO2 has little to no effect
Dikran Marsupial, I know it's not a science paper but Wikipedia puts the sun's input to the planet at about 1 kilowatt per square meter of which "527 watts is infrared radiation, 445 watts is visible light, and 32 watts is ultraviolet radiation". There is also a graph showing the ultraviolet, visible and infrared boundaries linked to the "Sunlight" page. The source looks credible and contains a spreadsheet of the wattage values for each wavelength. Significan energy in wavelengths longer than 0.74µm is also shown in the blackbody emission graph of the sun and earth on the Science Of Doom's excellent page on back radiation. -
Doug Hutcheson at 18:52 PM on 22 March 2012Inhofe's Myths on Maddow
The fossil fuel suits are laughing all the way to the bank.
I hope they're stacking all those dollar bills in a vault that's above the new high tide line "8-) -
Bernard J. at 18:38 PM on 22 March 2012Inhofe's Myths on Maddow
Does anyone have figures on revenues by that industry? I know the profits of numerous individual firms are gigantic...
The apocryphal figure is one billions dollars profit globally per day. At first blush that might sound an exaggeration, but when one starts to look at the profits of individual companies, it suddenly becomes very reasonable. So, for every day that action is delayed, that day's one billion dollars is added holus-bolus to the profit pile. It's no wonder that the industry seeks to stir FUD where it can - and there is no end of ignoramus prepared to do the grunt-work for free. The fossil fuel suits are laughing all the way to the bank. -
Jose_X at 18:11 PM on 22 March 2012Inhofe's Myths on Maddow
"Big oil" isn't so big? Does anyone have figures on revenues by that industry? I know the profits of numerous individual firms are gigantic, and profits don't even include costs the firms may take to promote their causes and let their many employees know what is in their best interest. If you have such a sweet income stream on the line, what might you do with that money (assuming you did not want to know too much about "hypotheticals")? -
Jose_X at 18:05 PM on 22 March 2012Inhofe's Myths on Maddow
Why not have a Maddow page (and of any other interested media channels)? It would draw extra attention the the site and help Maddow and others who will not be able to do real-time correction of guests. She need only mention[*] that "as usual, our expert friends at sks will be documenting rebuttals and corrections to this and past climate interviews at http sks MoreMaddow." [*] I'm assuming certain details will be taken care of, such as how to refer to the site to limit everyone's liabilities, offer appropriate disclaimers, adhere to any legal restrictions, etc. -
Dikran Marsupial at 17:24 PM on 22 March 2012Increasing CO2 has little to no effect
Ruffy, can you give a reference to a reputable scientific source for the claim of half of the energy in sunlight being near and short wave IR? -
NickBoyce at 16:35 PM on 22 March 2012Breaking News...The Earth is Warming... Still. A LOT
In the first paragraph Glen Tamblyn asks: ''how can you work out whether the Earth is warming if you don't take account of all the places where it may be warming?'' Does anyone know by how much the earth's mantle and core are warming or cooling? Presumably, if we wish to get an accurate picture of by how the temperature of the earth as a whole is changing, we should find out; otherwise we would have a very incomplete picture. -
70rn at 16:31 PM on 22 March 2012Stauning and Friis-Christensen on Solar Cycle Length and Global Warming
EUV is possibly 'emitted ultra violet' - but thats about all I can think of... But this makes little sense, as that's mostly intercepted high up in the atmosphere, and wouldn't play much of a role in observed ssurface temp IMO. -
70rn at 16:25 PM on 22 March 2012Stauning and Friis-Christensen on Solar Cycle Length and Global Warming
@ Doug H Well I'm guessing SSL is Solar Cycle Length, but the author of that acronym tripped up phoenetically. As for the others? Well it's like lurking in millitary forums around here sometimes... -
Ruffy at 15:02 PM on 22 March 2012Increasing CO2 has little to no effect
From the introductory paragraph, surely this is incorrect: "The Earth receives energy from the Sun in the form of visible light and ultraviolet radiation, which is then re-radiated away from the surface as thermal radiation in infrared wavelengths." About half of the energy in sunlight is near and short wave IR, and surely it is mostly this component of sunlight which heats the planet and is rebroadcast as longwave IR. -
muoncounter at 13:44 PM on 22 March 2012Sea level rise is exaggerated
Henry J#192: "So, is there a slight increase in the bulge at the equator?" No. From NASA 2005: They found Earth's oblateness (flattening on the top and bulging at the equator) decreased by a small amount. It decreased about one part in 10 billion, continuing the trend of earthquakes making Earth less oblate. The article details that there is a long term trend and thus cannot be responsible for recently observed change. -
Bob Loblaw at 12:35 PM on 22 March 2012Breathing contributes to CO2 buildup
There are two ways to look at the effect of human breathing and CO2: 1) what we exhale, and how we acquired that CO2 - fixed from the atmosphere by plants, so not a net contribution to atmospheric CO2 2) don't try to estimate the fluxes in and out, and just look at the change in storage. On that basis, I'm fairly sure (99-44/100ths % pure) that the 7 billion people we have now store more carbon (i.e., weigh more in total) than the 4 billion in the 1970s, so humans represent a net sink of carbon, not a source. Once climate change is bad enough that we see large decreases in the human population, we'll become yet another source of positive feedback as the stored carbon is released back to the atmosphere. -
Tom Dayton at 12:27 PM on 22 March 2012Sea level rise is exaggerated
Henry Justice, satellite measurements are just that--measurements. They measure what is there, so they cannot "null this effect out." Do they measure with sufficient spatial resolution to detect the differences in sea level between the equator and other regions? Yes. When someone wants a single statistic that summarizes the sea level across all regions of the Earth, that statistic (e.g., a mean--an average) necessarily will collapse across the equator versus other regions. -
Henry justice at 12:03 PM on 22 March 2012Sea level rise is exaggerated
Since the 2004 earthquake, the Earth's rotation has increased. So, is there a slight increase in the bulge at the equator? If so, the sea level will go down (except along the equatorial seas) until this effect is overtaken by ocean expansion and other factors. Or do the satellite measurements null this effect out? -
danno at 11:39 AM on 22 March 2012Breathing contributes to CO2 buildup
Methane from livestock is a different matter. -
danno at 11:37 AM on 22 March 2012Breathing contributes to CO2 buildup
"When I was a kid in the 1970s, there were 4 billion people. Now there is 7 billion. So there should be more CO2 due to breathing now than in the 1970s, not to mention the increased livestock." We also now grow more food to feed the extra people. Any CO2 we breathe out was carbon we locked up in plants before eating them. -
Doug Hutcheson at 10:38 AM on 22 March 2012Stauning and Friis-Christensen on Solar Cycle Length and Global Warming
R. Gates @ 6 and owl905 @ 10, I am drowning in acronym soup here.- SSL: I only know of this as Secure Sockets Layer
- EUV: Google suggests "Extreme ultraviolet lithography" or "European University Viadrina"
- SWAG: Google suggests "Scientific Wild Ass Guess" or "Stuff We All Get"
-
owl905 at 08:15 AM on 22 March 2012Stauning and Friis-Christensen on Solar Cycle Length and Global Warming
Actually, given the number of other drivers and the shape of human impact on the biosphere before 1985, the solar correlation is very good. The divergence context here is the same as the divergence for tree rings ('the decline'), and the PDO - SKS - Temp v PDO Just off the SWAG, there are new factors that have caused "a disturbance in The Force". All the other factors are still there and still do their part - in fact, they may be good tests of the status of the imbalance. -
scaddenp at 07:48 AM on 22 March 2012Roy Spencer's Bad Economics
Nordaus (eg. try here for some detail Furthermore, the costs are on basis "US is the world". Economic analysis has to compare global costs of mitigation versus cost of adaptation. I'm going with the published analyses over a spreadsheet, because like you, I am not an economist. -
scaddenp at 06:24 AM on 22 March 2012Roy Spencer's Bad Economics
dunc461 - I am not an economist either. What I am challenging is the validity of the spreadsheet as compared to more sophisticated economic model, especially say DICE2007. -
nuclear_is_good at 06:22 AM on 22 March 2012Stauning and Friis-Christensen on Solar Cycle Length and Global Warming
Technically a more elegant and complete description would be that solar forcing is a driver of climate in the absence of other more important drivers - and it was so before 1800. It appears also well correlated from 1800 to about 1980 - since for that interval the (somehow weaker) CO2 forcing was largely canceled by the negative aerosol forcing and the direction of the remaining CO2 forcing and solar forcing were both in the same direction, but once the aerosol forcing becomes less visible and the sun is no longer increasing in TSI the divergence becomes obvious. -
Yvan Dutil at 05:52 AM on 22 March 2012Stauning and Friis-Christensen on Solar Cycle Length and Global Warming
Actually, Friis-Christensen made a mistake in his 1991 paper, when calculating the length of the last solar cycles. When corrected, the divergence is obvious. -
CBDunkerson at 05:51 AM on 22 March 2012Stauning and Friis-Christensen on Solar Cycle Length and Global Warming
Roger, actually I'd say it was weak when they wrote it. If you look at the 'correlation' they initially found you'll see that there is no 'consistency of change'. That is, about half the time cycle length went up temperature went down - or vice versa. The only period where they both head in the same direction for any appreciable length of time is the rise in both between ~1910 and ~1940. So let's say we're looking at two sets of data and we see that both rose over the same time period. If we then plot them on the same graph and set the scales of each such that these rises appear to be parallel we can create an apparent 'correlation'. However, while the years before and after that period aren't wildly wrong, they don't show any strong correlation either. If there were a tight enough correspondence between these factors for the 1910-1940 cycle length rise to cause the temperature rise (or vice versa, which makes about as much physical sense) then we shouldn't be seeing the sharply inverse responses in some of the preceding and subsequent cycles. It is just a form of 'curve fitting'... which falls apart once you look outside the bounds which have been fit to 'correspond'. Just as the past 30 years show wild divergence you'd get the same going back before 1850. For example, solar cycle 4 around 1790 was 13.7 years long... that's way off the bottom of the chart. Meanwhile, solar cycle 8, at 9.8 years ~1840, was shorter than any of those shown on the chart and thus should have had the highest temperature anomaly... but there is no indication of sudden extreme heat in the 1840s and then immediately returning to globally colder temperatures. -
R. Gates at 05:37 AM on 22 March 2012Stauning and Friis-Christensen on Solar Cycle Length and Global Warming
I have been studying the relationship between SSL and global temperatures for years and have known about both the seemingly close correlation that seems to exist prior to about 1980, as well as the strong disconnect that occurred after that point. Of course, as pointed out, there are other potential solar influences outside of SSL that could show covariance with SSL, such as EUV's, so more research is certainly quite warranted. But what should be most obvious is that some other signficant forcing is now driving climate on a longer-term basis, such that solar, ENSO, and aersols and other natural variability are now playing a secondary role as "noise" that rides upon a much stronger signal. That signal of course is the forcing from the additional CO2, N20, and methane that are now at their highest levels in probably at least several million years. One final side-note to the SSL/Climate connection. If we believe there was some correlation in the past (prior to the large influx of anthropogenic GH gases), then we might rightly beleive that at least a Dalton and possible Maunder type cooling would be in the offing in the next few decades as SSL look to be lengthening for many decades. That we will likely not be seeing this cooling-- indeed, quite the opposite, speaks both to the strength of the anthropogenic signal, but also, to the rather tenous nature of the connection between SSL and climate. -
Roger D at 04:36 AM on 22 March 2012Stauning and Friis-Christensen on Solar Cycle Length and Global Warming
Thanks for the article. So the correction is that solar cycle length and temperature stop correlating after about 1977 or so, instead of 1985? Seems to me that this "skeptic" argument is/ was weak after maybe a decade or so after the Friis-Christensen (1991) paper, and would be even weaker today - even if the 1991 paper was not falsified. -
Pete Dunkelberg at 04:03 AM on 22 March 2012Stauning and Friis-Christensen on Solar Cycle Length and Global Warming
Thanks for this solar update. I suppose it is natural for scientists in the Nordic countries to have a special interest in the sun :) and I'm glad to see Skeptical Science being as global as possible. Many interesting figures from Stauning's paper are available here in small size. -
chizadek at 03:57 AM on 22 March 2012Rachel Maddow Debunks Climategate Myths Using Skeptical Science
Inhofe's comment about God reminds me of a joke about a Christian who keeps saying "God will save me" as he refuses various offers of help as rising floodwaters increasingly threaten and then take his life. In heaven he asks God why he didn't save him and the punchline has God replying, "I sent you a raft, a boat and a helicopter, what more did you want?" While I'm at it skeptics' focus on the lack of short-term warming reminds me of the joke about checking if a car indicator is working - "It is, it isn't, it is, it isn't..." -
mdenison at 03:52 AM on 22 March 2012Stauning and Friis-Christensen on Solar Cycle Length and Global Warming
Previous SKS article What does Solar Cycle Length tell us about the sun's role in global warming? -
Albatross at 03:41 AM on 22 March 2012New research from last week 11/2012
Hi Ari, I'm really enjoying your weekly collection of new (and old) papers. Now if I could only find someone who does it exclusively for my field of research ;) Looking forward to next week's installment! -
Rob Honeycutt at 03:36 AM on 22 March 2012Stauning and Friis-Christensen on Solar Cycle Length and Global Warming
I always find it particularly concerning when I see charts showing the correlation between solar and T followed by the divergence of the two. The first thing that pops into my head is, T would be rising much faster if solar forcing had not been falling so precipitously. And it holds the chance that solar output will kick back in and push T even higher and faster. Nice update, though. Do I think "skeptics" will stop making the claim? Unlikely. Facts rarely get in their way. -
Doc Snow at 03:21 AM on 22 March 2012New research from last week 11/2012
Yes, the anonymous source gives a remarkably devastating illustration of the determined ignorance of certain folks... and why RTFL ('L' for 'literature') is such an important reminder. I'm really curious who the source of the Andrée data was--could it have been Nils Ekholm? He knew Andrée personally--they would have a falling-out the next year, as Andrée fell victim to his own (fatal) bout of hydrogen-loss denialism--and was collaborating with Arrhenius on papers at this time. And I don't as readily see Arrhenius, the other obvious candidate, writing for Wollny's Forschungen (from what I can gather of the latter publication.) Ari, how easy would it be for you to access the relevant Wollny's? At least one inquiring mind would love to know who wrote the article there! The values of CO2 are also worth noting--the 'volumes per 10,000' translate easily to ppm: 3.24 would be 324 ppm. A bit higher than Callendar's 274-292 ppm, but not unreasonably so, given the measurement technology of the day. (And contrast some of the values put forth by EG Beck.)
Prev 1217 1218 1219 1220 1221 1222 1223 1224 1225 1226 1227 1228 1229 1230 1231 1232 Next


