


 Arguments


Recent Comments
Prev 1248 1249 1250 1251 1252 1253 1254 1255 1256 1257 1258 1259 1260 1261 1262 1263 Next
Comments 62751 to 62800:
-
andylee at 20:44 PM on 24 March 2012Peter Hadfield Letter to Chris Monckton
Brilliantly summed up, Bernard. This is still a squabble in a tea cup, but it may yet make more mainstream news and bring some focus to the facts. Now that it appears that he has become a liability to those that seek his services, perhaps he'll have to consider a new career whether he responds or not. -
barry1487 at 20:39 PM on 24 March 2012Fred Singer Debunks and then Denies
" "The story put forth by Al Gore" is essentially that the strong historical correlation between CO2 and global surface temperature demonstrates that CO2 is the climate's biggest control knob, and Gore is correct on this point. Yes, historically temperature changes have been initiated by orbital cycles approximately 800 years before an atmospheric CO2 increase. At that point, the oceans warmed enough to release CO2 into the atmosphere, which in turn amplified the existing warming and continued to drive global warming for several thousand years."
According to realclimate (via Lorius 1990), The 'biggest control knob' during glacial transitions is albedo change. CO2 comes in second. http://www.realclimate.org/index.php/archives/2007/04/the-lag-between-temp-and-co2/ You're not necessarily wrong, but the example doesn't seem to support the contention. -
Sapient Fridge at 18:42 PM on 24 March 2012Peter Hadfield Letter to Chris Monckton
Typo: "misinformtion tour" -
andyrussell at 18:24 PM on 24 March 2012Stauning and Friis-Christensen on Solar Cycle Length and Global Warming
There was a nice response to the FC&L paper from CRU: Kelly and Wigley (1992) Solar cycle length, greenhouse forcing and global climate. Nature. 360, 328-330. Amongst other things, they struggled to recreate the cycle length data that was used by FC&L. -
Bernard J. at 17:43 PM on 24 March 2012Peter Hadfield Letter to Chris Monckton
Monckton is sandwiched between Hadfield's rock of logic and science's hard place of scientifically defensible fact. It doesn't seem to be a comfortable location for Christopher. -
Glenn Tamblyn at 17:03 PM on 24 March 2012An Open Letter to the Future
Wow. I only just looked at this article. Love it Kate. -
Doug Hutcheson at 11:28 AM on 24 March 2012Catching up with the Younger Dryas: do mass-extinctions always need impacts?
So the question is whether the YD represents a transient glitch, or a soft reboot of nature. By comparison, what we are doing now is equivalent to a planetary reformat and reinstallation of the operating system. Maybe the new version will fix the problems encountered in the Anthropocene V1.0 application. -
Riduna at 10:05 AM on 24 March 2012An Open Letter to the Future
Kate writes … “Tell me, people in 5000 – how bad did the climate get? What happened to the amphibians and the boreal forest? Did the methane hydrates give way, and if so, at what point? How much did the oceans rise?” Unfortunately, we will not have to wait 5,000 years to get answers to these questions. The answers will be evident to our grandchildren this century and we can already provide good estimates of the state of things to come. Slow feedbacks, especially albedo loss, methane emissions and sea level rise, are already having an effect and with global warming will be exacerbated by reduced aerosol emissions and the end of solar quiescence. Warming in temperate regions and the Arctic (so called amplification) is neither unexpected or a sudden event. Both have been made inevitable by emissions arising from burning of fossil fuels - as has the triggering of slow feedbacks over which we have no control. The outcome from these events has been outlined by many climate scientists and include: • seasonally sea-ice free Arctic within a decade, • passing the tipping point heralding collapse of the Greenland/W. Antarctic ice sheets, • sea level rise of up to 5 metres by 2100 with most of the rice occurring after 2070, • Sudden or chronic emission of Siberian methane producing sudden irreversible climate change before 2100, • Reduction of population and at worst extinction of plant and animal species due to infections and loss of habitat, We know these are likely outcomes our continued burning fossil fuels. We know that this combustion is not necessary to meet our energy needs, yet we persist in it because vested interests prefer short term profit to avoidance of longer term disaster and because governments, having been repeatedly warned of these outcomes, lack the political will to take action to curb and, as rapidly as possible, eliminate CO2 emissions. We have a choice and so far, the wrong choice has been made. -
jyyh at 09:08 AM on 24 March 2012Catching up with the Younger Dryas: do mass-extinctions always need impacts?
I linked the last image to FB, hope you do not mind. Whatever that indeed means, I found it worth a link. -
jyyh at 09:06 AM on 24 March 2012Catching up with the Younger Dryas: do mass-extinctions always need impacts?
Thanks! so there might indeed have been an impact back then! I may have to do yet a third story besides note#4 and this to have all bases covered. -
John Mason at 05:23 AM on 24 March 2012Catching up with the Younger Dryas: do mass-extinctions always need impacts?
Doc - indeed, it was like that researching it. But it is new - and controversial, in terms of the notion that an impactor may have been involved. Hypotheses that are barely a decade old often go through such periods and when that time has finished they either remain as a possibility or are consigned to the mists of time! Once they pass their first centenary they are relatively bomb-proof.... hence guys like S Fred Singer et al turning upon those who try to suggest that the Greenhouse Effect is some kind of hoax. They're 90+ years too late on that one! -
SirNubwub at 04:15 AM on 24 March 2012Inhofe's Myths on Maddow
DB@ response to 47 Fair enough. Philippe Chantreau @7 I found the articles supporting my statements with minimal effort on Google. You can do the same to find them. -
Doc Snow at 03:44 AM on 24 March 2012Catching up with the Younger Dryas: do mass-extinctions always need impacts?
Indeed. Frustratingly inconclusive story, yet the moral is certainly apt. I guess we just need to "stay tuned!" -
Joel_Huberman at 00:55 AM on 24 March 2012Stauning and Friis-Christensen on Solar Cycle Length and Global Warming
I'm glad to see that I'm not the only one stumped by acronyms. I'd like to suggest that all commenters define their acronyms at first use. -
Tony O at 22:01 PM on 23 March 2012New Research Lowers Past Estimates of Sea-Level Rise
Is not the plastic phase of isostatic rebound that happens first much quicker? There is already measurable rises in the edges of Greenland as the ice sheet edge thins. So We have to add this effect to the effective sea level rise. -
Doug Hutcheson at 19:47 PM on 23 March 2012Fred Singer Debunks and then Denies
TC: you are quite right. Please regard "deliberately" as an unsupported assertion that should be snipped. I regret making such an error and apologise to Mr. Singer unreservedly. -
Doug Hutcheson at 16:47 PM on 23 March 2012Fred Singer Debunks and then Denies
Does anyone else see the irony in his closing effort?So we just make our measurements, perfect our theories, publish our work, and hope that in time the truth will out.
- Who is the 'we' he refers to? Has he started doing actual research again, with collaborators, or is this the Royal 'we'?
- What theory is he perfecting? The so-far missing denier talisman, a theory which disproves AGW, while explaining all the evidence? I wait with bated breath ... not.
- Apart from American Thinker, which was not a respected, peer-reviewed journal last time I looked, where is he publishing his new research?
- He hopes the truth will out? When did he change his mind?
"Unless we announce disasters no one will listen." -Sir John Houghton, First chairman of the IPCC
I think the truth about Singer is out and has been for a long time: he is a rabid denier, but now attempting to wear the disguise of a luke-denier (kinda like a luke-warmer, but still denying the obvious).Moderator Response: TC: The misquote of Houghton is egregious, but it is not clear that Singer originated the misquote or is familiar with the information that shows it to be a misquote. His misquotation may therefore be negligent rather than deliberate. Please keep such accusations within the supporting evidence, and in light of the comments policy, do not make them lightly even if you feel they are justified. -
Doug Hutcheson at 16:04 PM on 23 March 2012Stauning and Friis-Christensen on Solar Cycle Length and Global Warming
owl905 @ 17 and R. Gates @ 18, thank you both for the clarifications. I'm relieved to see that I was not the only one suffering AD (Acronym DissonanceTM). For SSL, I should read "Solar Cycle Length"; For SWAG, I should read "Scientific Wild Assed Guess". R. Gates, for EUV, should I read "Emitted UltraViolet" or "Extreme UltraViolet"? Perhaps you could shine the the Solar Spot Light on this for me "8-) -
chriskoz at 13:45 PM on 23 March 2012Fred Singer Debunks and then Denies
Daniel @6, Indeed, there is some degree of similarity between Monckton & Singer, expressed recently with Singer's shifting his goalposts or regurgitating his "theories" when he cannot find any evidence for his original claims. With respect to Singer's "skepticism", it's worth remembering the opinion of Carl Sagan, who was arguably the best advocate of quality assurance in science. "If you are only skeptical, then no new ideas make it through to you. You become a crotchety old person convinced that nonsense is ruling the world. (There is, of course, much data to support you.) But every now and then, a new idea turns out to be on the mark, valid and wonderful. If you are too much in the habit of being skeptical about everything, you are going to miss or resent it, and either way you will be standing in the way of understanding and progress." - Carl Sagan. That "crotchety old person" characterises Singer very well: even though he is able to accept some basic century-old knowledge (i.e. that CO2 acts as GHG) but because he remains "only skeptic" he's unable to accept other consequential facts that follow. I think there is too much appreciation attached to the word "skeptic" in our society: "skeptic" means "brave challenger". And I'm sure Singer is drawing his personal pride from such meaning. If we point out the opposite spectrum of this word, as described by Sagan quote above, people will figure out that skepticism is indeed nothing to be proud about. -
jim1961 at 13:40 PM on 23 March 2012Fred Singer Debunks and then Denies
I hope this does not sound like an ad hominem attack on Fred Singer but he did take money from tobacco companies and clouded the truth about tobacco smoke and the addictive nature of nicotine. It's a fact that he has received money from Exxon/Mobil. In my opinion, (snipped)Moderator Response: TC: The comments policy forbids both accusations of dishonesty and all caps. Please review it. -
R. Gates at 11:39 AM on 23 March 2012Stauning and Friis-Christensen on Solar Cycle Length and Global Warming
Yes, of course SSL was a typo in the context of this post and how rightly embarrassed I am. Just goes to show what happens when you deal with two somewhat related acronyms at around the same time! Our neighborhood is thinking of installing some of these in our park, and I'm on the committee looking into them: http://www.clean-energies.org/SSL-Solar-Spot-Light_p_108.html Solar Spot Lights, which I would take it, have no relationship to the past climate, nor would show covariance with past temperatures...but who knows, someone could probably find a correlation to Solar Spot Lights and global temps, or perhaps there is as much correlation as SCL's have! -
CoalGeologist at 10:49 AM on 23 March 2012Rachel Maddow Debunks Climategate Myths Using Skeptical Science
I'm generally a fan of Rachel Maddow, but feel she did a poor job handling this interview, particularly in allowing Senator Inhofe to persistently play the "two-sidedness" card, where he presented the "two sides" as is they were more-or-less equivalent in their approach and methods, but differ only in their conclusions--one "side" accepting AGW, the other "side" rejecting it. Forget about the "details" of whether he was right or wrong about this or that. He won simply by staking out a "side" in the "debate". In actual fact, there is very little equivalency between the two positions. One is borne of a more than a century of accumulated scientific evidence, while the other is borne of politics and ideology. One is built principally on a foundation of peer-reviewed publications, while the other is built upon op/eds published in ideologically friendly newspapers, politically-infused web sites, pseudo-academic journals and technical meetings, and an army of Angry Bird Bloggers who fling themselves against the pig-infested institutions of science, intent on bringing them down. In other words, there's very little equivalency, yet in Sen. Inhofe's version, it comes down to a question of which "side" you happen to prefer. One of the great ironies of the "debate" over AGW is that those cleaving to the premise that AGW is wrong, have the impression that since their own conclusions are linked to politics, and since (in a disturbing application of "circular reasoning"), they have the impression that the "other side's" conclusions must be based on politics as well, that the two positions are fundamentally equivalent in stature. This is essentially what Senator Inhofe conveyed, and my impression was that he 'got away with it'. -
JMurphy at 10:15 AM on 23 March 2012Rachel Maddow Debunks Climategate Myths Using Skeptical Science
Sphaerica wrote : "As far as Lindzen's opinions and disinformation, they are a crock (and you will find that much of what he presented to members of the House of Commons was false)." It must be remembered that Lindzen did not actually speak to members of the House of Commons - he actually spoke in a Committee room, privately hired, in front of a mainly public audience of those who were already convinced by what he was going to talk about. There may have been two MPs there at most - one who booked the room and an ex-Tory minister.Response:[DB] Intermission is over; let us all return to the central premise of this thread. Thanks!
-
Bob Lacatena at 10:05 AM on 23 March 2012Rachel Maddow Debunks Climategate Myths Using Skeptical Science
West129, Your failure to understand the meaning of the quote you posted, as well as your need to quote from an 11 year old version of that report, speaks volumes for your level of understanding of the issues. Your first failing is your complete misunderstanding of how climate models work and what their limitations are. As far as research continuing in all directions... well, what do you know, it is. As far as Lindzen's opinions and disinformation, they are a crock (and you will find that much of what he presented to members of the House of Commons was false). All in all... you so far have nothing to say except for utterly vacant falsehoods. Your lofty, arrogant tone is belied by your complete and total ignorance of the issues. -
tmac57 at 09:42 AM on 23 March 2012Fred Singer Debunks and then Denies
Daniel J. Andrews- So what you are saying is: "Same old Singer,with a different song?" -
owl905 at 09:35 AM on 23 March 2012Stauning and Friis-Christensen on Solar Cycle Length and Global Warming
@Paul 15 - Doug H @ 11, first interpretation of SWAG is the correct ... G ... . -
Daniel J. Andrews at 07:59 AM on 23 March 2012Fred Singer Debunks and then Denies
So Singer's unstoppable global warming every 1500 years is now over? Already? Seems rather a short time frame. I would have thought such a small handful of years of warming would be difficult to pick out of the paleo-records dealing with millenia. Mind you, he wrote his book Unstoppable Global Warming Every 1500 years 30 years after he said warming stopped in 1978. I think a good post/video would be Singer refuting Singer, similar to what was done for Monckton. -
Rachel Maddow Debunks Climategate Myths Using Skeptical Science
West129 - I would strongly suggest taking your arguments against models to the appropriate thread, How reliable are climate models, where these points are rather extensively discussed. And, I will note, generally debunked. It's quite off-topic here. -
adelady at 07:49 AM on 23 March 2012Rachel Maddow Debunks Climategate Myths Using Skeptical Science
West129 "eloquently expressed" ?? If you look at the left hand column you'll see one of the more recent posts is titled Lindzen's Junk Science As always, when you want to make a point in discussion here, check for the appropriate thread. In this case, I strongly recommend reading that particular item and commenting there if you still feel that you would want to. -
funglestrumpet at 07:30 AM on 23 March 2012Stauning and Friis-Christensen on Solar Cycle Length and Global Warming
70rn @ 12 I couldn't agree more. It would be nice to have a glossary of all the abreviations, argot, etc. found on this site that one could turn to in order to clarify matters.Response:[DB] Glossary functionality nears completion.
-
West129 at 07:19 AM on 23 March 2012Rachel Maddow Debunks Climategate Myths Using Skeptical Science
Catastrophic Anthropogenic Global Warming theory not supported by science but by crude climate models. I accept the reprimand from your blog. (-snip-)Response:[DB] "Catastrophic Anthropogenic Global Warming theory not supported by science but by crude climate models."
There are two problems with this statement. The first is the reliance upon a vaguely defined fake-skeptic term ("Catastrophic"). The second is the gross mischaracterization of models as being "crude" (another vague term).
You then proceed to erect straw man arguments also built on ill-defined premises and fake-skeptic talking points, the main thrust of which are off-topic on this thread. Please keep in mind that this thread is about Rachel Maddow Debunks Climategate Myths Using Skeptical Science.
Off-topic portions snipped.
-
owl905 at 07:17 AM on 23 March 2012Fred Singer Debunks and then Denies
"Yes, historically temperature changes have been initiated by orbital cycles approximately 800 years before an atmospheric CO2 increase." Actually, that's not a fact - it's a plausible theory with missing pieces. The kickstart-trigger that caused CO2 levels to initiate a 30% increase in a millennium is the actual start of the Ice Age Death Spiral. Best candidates on the table (not mutually exclusive at all) are Milankovitch plus dust-storms plus ocean-current re-arrangement. The supposed lag then becomes an artifact of observational bias with a topping of pro-pollutionist 'butwattabout'. The Southern Ocean CO2 glacial period research: http://www.sciencedaily.com/releases/2010/10/101025161152.htm (Snipped)Moderator Response: TC: Ad hominen snipped. The comments policy states that:" Links to useful resources are welcome (see HTML tips below). However, comments containing only a link will be deleted. At least provide a short summary of the content of the webpage to facilitate discussion (and show you understand the page you're linking to).
The bolded section should be understood as applying to all links, and where it is not obvious that they provide supporting evidence to your direct claims, their content and relevance should be at least summarized. Thank you for your future compliance. -
Alexandre at 07:14 AM on 23 March 2012Fred Singer Debunks and then Denies
"unsolicited and unexpected donation of $10,000 from Exxon Mobil". This doesn't happen to me very often... maybe he was just lucky? -
Sascha Tavere at 07:01 AM on 23 March 2012Inhofe's Myths on Maddow
This is probably the one and only chance I'll ever have of voicing my extreme irritation about the Inhofe quote of Lindzen's saying: “He who controls carbon controls life. It is a bureaucrat’s dream to control carbon dioxide.” This is true of all primary needs and all those philosophically challenged. It echoes on and on and on ... -
SirNubwub at 07:00 AM on 23 March 2012Inhofe's Myths on Maddow
Dana1981 @1: Yes, all regulations affect life, but full-blown regulation of CO2 will affect more aspects of life than most (if not all) other regulation programs Albatros @5 Yes, I have been strongly skeptical in the past, but this website has made me acknowledge that maybe the alarmists have a point. BUT...what I am discussing here is that I have problems with are writers who say plainly wrong things, like “Perhaps the implication is that CO2 limits will regulate breathing“. I hope you have problems with statements like that too. The ramifications of the laws will affect so many different aspects of life that we need to take the discussion seriously. Philippe Chantreau @7 Here are newspaper articles that are the foundation of what you consider to be my scare tactics. Food control: (-snip-) Population control: (-snip-) Person fuel control: (-snip-) Vacation control: (-snip-) Television control: (-snip-) John Hartz @10 I use this website as my main source of clear understandable pro-AGW arguments. This website has actually moved me from being a scoffing adamant denier to one who is now willing to admit that the case is not so clear cut and the pro-AGW may be right. I will engage in meaningful conversation. My only point in my comment is that the authors statement of “Perhaps the implication is that CO2 limits will regulate breathing” is NOT meaningful conversation and seems to be made in a disingenuous way. Composer99 @15 What claims are you referring to? I have no problem with the legality of the government imposing cap and trade taxes, My problem is with people claiming that legal limits on CO2 mean that the government will regulate breathing.Response:[DB] Skeptical Science keeps the focus on the science of climate change. Typically this means an emphasis on peer-reviewed published studies appearing in reuptable journals to support one's position. A reliance on newspaper articles to support a position far off-topic to the OP of the thread is a call for moderation. This thread is on Inhofe's Myths on Maddow.
Off-topic snipped, as applicable.
-
dunc461 at 06:48 AM on 23 March 2012Roy Spencer's Bad Economics
Scaddenp - Thank you very much for the site reference. It led me to a spreadsheet version of the Dice program C – 1 on http://www.econ.yale.edu/~nordhaus/homepage/DICE2007.htm . After review of this spreadsheet I feel there is good agreement between the portion of his model dealing with abatement/preventative costs and mine. Of course his model is much more comprehensive but because his “abatement cost equation is a reduced-form type model in which the costs of emissions reductions are a function of the emissions-reduction rate.” It tells us nothing about how those reductions are to be achieved. Based on total carbon emissions for his base case he expects energy usage in 2055 to be 166% over current and 233% in 2105. Based on total carbon emission for his “optimum” case he expects energy from fossil fuels to be 126% of today’s values in 2055 and 140% in 2105 He projects total abatement costs for his optimum case to $1.6 trillion by 2055 and $12.3 trillion by 2105. If you plug his constraints into my spreadsheet you will find that although fossil fuel usage increases by 40% the energy supplied as a percent of the total drops from 86% to 51%. Holding nuclear and Hydro at current levels, Solar and Wind must contribute 44% by 2100 with 35% from wind and 9% from Solar unless the price of solar drops significantly. On the other hand, if you assume the price of solar does not drop and only 50% of the energy required to make up for limitation of fossil fuels can come from the wind with the other 50% coming from solar, the preventive costs jump to $65 trillion in 2050 and $373 trillion in 2100. That is why it is important to look at HOW we get from here to there. I am only trying to verify the assumptions Nordhaus and others are making with respect to abatement/preventative costs over the next 38 and 88 years. That is why I requested the latest information available on the inputs to my spreadsheet as I only have information that is available for free on the web. What is the latest thinking on future energy usage and fossil fuel limits? Is nuclear usage to be expanded? Can we expect significant reductions in solar PV costs in the next 38 years? Etc. With respect to your final comment, while my costs are report in US $, as are Nordhaus’s, we live in a global economy, the price of coal and oil is the same around the world. Most of the components for a power plant will be built by the countries that can supply them for the lowest costs. There might be some differences in construction labor costs and operating labor costs. But capital and fuel costs are the largest factors. Finally I must say that my faith in economists has been shaken. Despite the fact that it is well known the excessive private debt in the form of leveraging caused the depression the economists failed to warn us when the private debt as % of the GDP exceeded the levels reached in the late 1920’s in 1987.and went on to be almost twice as high in the early 2000’s. Nor did they attach any significance to the fact that it had taken 34 years US home ownership to grow by 3% but in 10 years starting in 1994 it grew by 7.8%. -
andylee at 06:15 AM on 23 March 2012Fred Singer Debunks and then Denies
"American Thinker" = "carboxymoron" :-) -
muoncounter at 06:04 AM on 23 March 2012Breaking News...The Earth is Warming... Still. A LOT
NickBoyce#58: Why are you assuming that all of the heat warms all of the ocean volume? The second figure in this post clearly shows indicates it is the heat content for water depths 0-2000m only. -
r.pauli at 05:35 AM on 23 March 2012Fred Singer Debunks and then Denies
We should remember some funding details for Singer: "Last year, he admitted that he had received from Exxon Mobil "an unsolicited and unexpected donation of $10,000 more than a decade ago." The Heartland leak shows that he currently receives "$5,000 per month, plus expenses" from the institute." http://www.guardian.co.uk/environment/2012/feb/15/climate-sceptics-pai-heartland-institute So $5K per month - plus expenses... has anyone put that onto a graph? -
kaustubh at 05:27 AM on 23 March 2012Fred Singer Debunks and then Denies
Singer also misrepresents the fact that proxies show warming as well: Proxy evidence for recent warming. -
Doc Snow at 03:48 AM on 23 March 2012New research from last week 11/2012
OK, I remembered an old bibliographic trick: when in doubt, search by date. Sure enough, it's Volume 18, not 15--though chalk one up for my memory; it really was p. 409. And the author was: S.A. Andree himself! Seems the intrepid balloonist wasn't content to leave publication to others, and wrote up his own data. V. 18, for any who may be interested: http://www.archive.org/details/forschungenaufd06wollgoog -
Paul from VA at 03:43 AM on 23 March 2012Stauning and Friis-Christensen on Solar Cycle Length and Global Warming
I believe EUV is Extreme UV which means the high energy/short wavelength portion of the UV spectrum. I believe that there is some research linking variations in the sun's EUV emission with weather on Earth. SSL - I agree it is likely solar cycle length. Or alternately SunSpot Number. Either way, I'm pretty sure it's a typo. SWAG - I have no idea.... -
Doc Snow at 03:39 AM on 23 March 2012New research from last week 11/2012
Found that Wollny's has (mostly?) been digitized, and v. 15 is available here: http://www.archive.org/details/forschungenaufd08wollgoog However, it does not appear that the article in question is in V. 15, so probably my memory was faulty. But there are a couple of articles on CO2; the first offers voluminous comparisons of near-surface measurements and soil measurements in various environments by one Herr Puchner; the second, a short summary of previous research, finds atmospheric concentrations of around 290 ppm. It begins on p. 478, and may be of interest--especially for those with good skills in reading German. When and if the pdf starts loading properly again, I'll recheck the reference to see if I can find the proper article. -
Doc Snow at 02:30 AM on 23 March 2012New research from last week 11/2012
Yes, the PDF loading seems to be 'stalled out' for me, too. But I'm not thinking of the primary author, who, as you say, would be the editor. The bulk of the article consists of a translation--set apart by the use of quotation marks--of an article (or maybe an excerpt from an article) from a publication called "Wollny's Forschungen," or more formally: Forschungen auf dem Gebiete der Agricultur-physik: Bd. 1 15 (I *think* it's vol. 15; that's what my not-so-reliable memory is dredging up for the citation in the AmMetSoc article. I even think it may possibly have been p. 409.) Anyway, it's the 'secondary author'--the author of the underlying article--that I suspect may have been Ekholm. I may have found an online source for Wollny's, but I want to check out the site before I try such a large download. I'll let you know what I find out. -
Dikran Marsupial at 02:24 AM on 23 March 2012Increasing CO2 has little to no effect
@Tom, many thanks for correcting my intuition, getting things wrong and having ones understanding challenged is an excellent way to learn! Forgetting that the water vapour is in the lower trophosphere should have been obvious even to me. ;o) -
Tom Curtis at 01:29 AM on 23 March 2012Increasing CO2 has little to no effect
Ruffy @120, to put this into perspective here is a graph of the energy content of solar radiation to the Earth by wavelength, along with important absorption bands: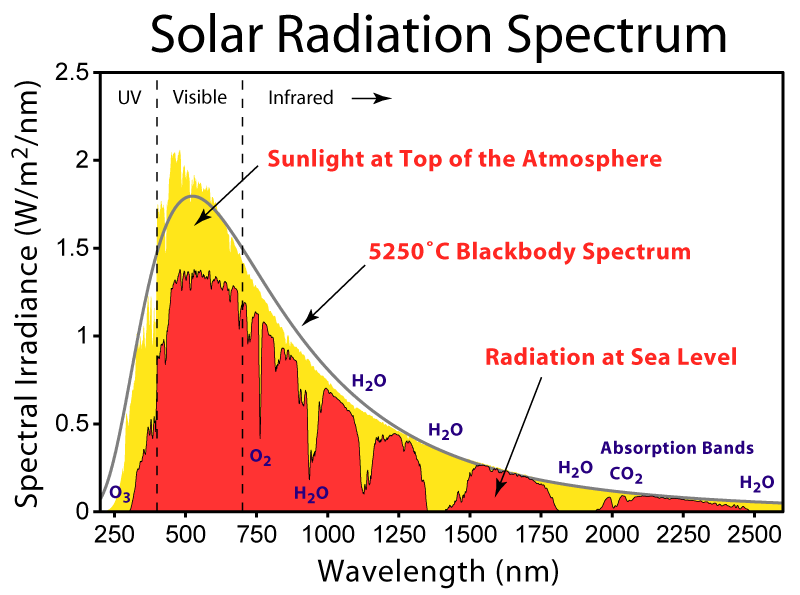 As you can see, the 49% figure is about right. However, very little of that 49% is in the wavelengths of the outgoing radiation, as can be seen by this diagram:
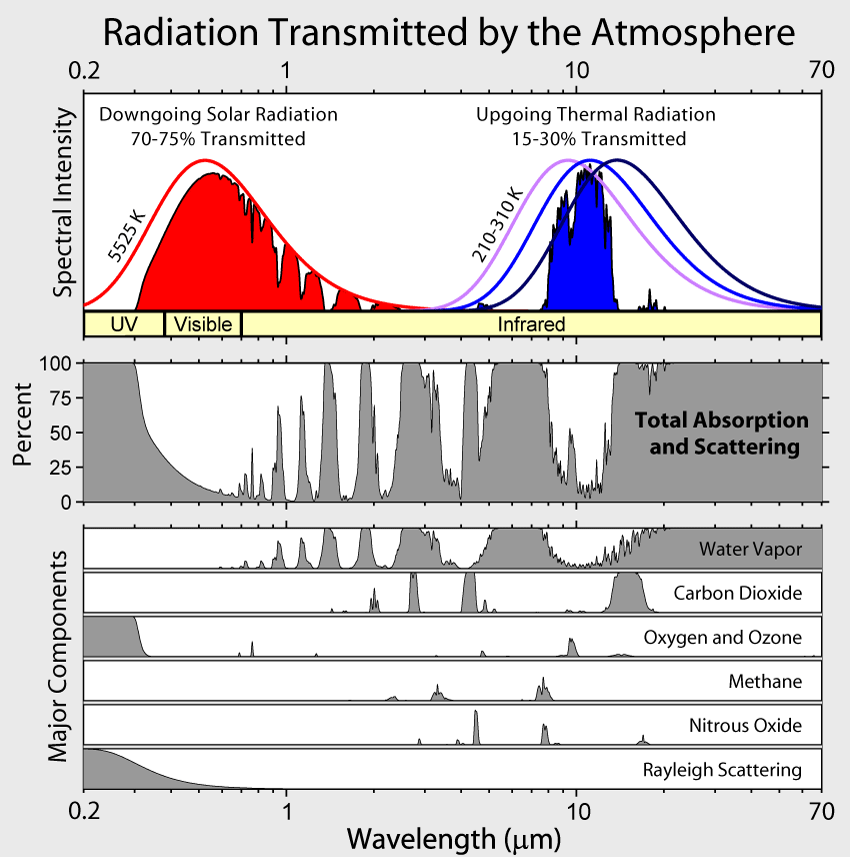 You will note that nearly all of the incoming solar radiation is absorbed by water vapour, or by the surface. As nearly all the water vapour in the atmosphere is in the bottom four km of the atmosphere, that means nearly all of the energy is absorbed at, or near the surface. Therefore I must disagree with Dikran Marsupial @124, not because his analysis is wrong, but because his assumption that the incoming energy is at frequencies where there is significant absorption by well mixed greenhouse gases (ie, GHG other than water vapour and ozone) is false.
It should be noted that the energy absorbed by water vapour near the surface from the sun is very small compared to the energy absorbed from the surface. Based on the energy balance by Fasulo and Trenberth, the near surface atmosphere absorbs around 450 W/m^2, compared to around 80 W/m^2 absorbed in the atmosphere (as significant proportion of which is UV radiation absorbed by the ozone layer). Given this, and given that convection ensures a well structured temperature profile in the lower atmosphere, the energy absorbed in the lower atmosphere can be treated as being absorbed at the surface for nearly all practical purposes.
That being the case, the IR radiation from the sun does not differ significantly in its effects from the visible light from the sun. It is absorbed at the surface. It is not directly reradiated but rather, redistributed as heat through the collisions of molecules, some of which then emit IR radiation at an entirely different wavelength, that radiation constituting the Earth's thermal radiation.
And, of course, to maintain an energy balance, the energy received by the Earth must equal the energy which leaves the Earth. If the Earth's IR radiation came only from the IR radiation received from the Sun, then about 50% of the Sun's energy would not be reradiated back to space. The resulting energy imbalance would be a catastrophe worse than a full nuclear exchange, even if maintained for a single day.
So, yes the Earth does receive IR radation from the sun, primarily at wavelengths where it is absorbed at or very near to the surface; but no it is not this component alone (or primarily) that results in the Earth's IR radiation from the surface or to space.
You will note that nearly all of the incoming solar radiation is absorbed by water vapour, or by the surface. As nearly all the water vapour in the atmosphere is in the bottom four km of the atmosphere, that means nearly all of the energy is absorbed at, or near the surface. Therefore I must disagree with Dikran Marsupial @124, not because his analysis is wrong, but because his assumption that the incoming energy is at frequencies where there is significant absorption by well mixed greenhouse gases (ie, GHG other than water vapour and ozone) is false.
It should be noted that the energy absorbed by water vapour near the surface from the sun is very small compared to the energy absorbed from the surface. Based on the energy balance by Fasulo and Trenberth, the near surface atmosphere absorbs around 450 W/m^2, compared to around 80 W/m^2 absorbed in the atmosphere (as significant proportion of which is UV radiation absorbed by the ozone layer). Given this, and given that convection ensures a well structured temperature profile in the lower atmosphere, the energy absorbed in the lower atmosphere can be treated as being absorbed at the surface for nearly all practical purposes.
That being the case, the IR radiation from the sun does not differ significantly in its effects from the visible light from the sun. It is absorbed at the surface. It is not directly reradiated but rather, redistributed as heat through the collisions of molecules, some of which then emit IR radiation at an entirely different wavelength, that radiation constituting the Earth's thermal radiation.
And, of course, to maintain an energy balance, the energy received by the Earth must equal the energy which leaves the Earth. If the Earth's IR radiation came only from the IR radiation received from the Sun, then about 50% of the Sun's energy would not be reradiated back to space. The resulting energy imbalance would be a catastrophe worse than a full nuclear exchange, even if maintained for a single day.
So, yes the Earth does receive IR radation from the sun, primarily at wavelengths where it is absorbed at or very near to the surface; but no it is not this component alone (or primarily) that results in the Earth's IR radiation from the surface or to space.
-
Dikran Marsupial at 21:28 PM on 22 March 2012Increasing CO2 has little to no effect
@Sapient fridge, many thanks, Wikipedia is fine for me (where it has external references), at least as a start. I think the thing that Ruffy might be missing is that a lot of that radiation will be absorbed by the GHGs in the atmosphere before it gets to the surface (which will only see the IR that is not in the absorption bands of H2O, CO2 etc.). I suspect most of this gets re-radiated back out into space (at each "layer" in the atmosphere half is re-radiated up and half re-radiated downwards, so the amount heading downwards decreases logarithmically?). That would be my intuition anyway. The point still remains however, as CBDunkerson mentions, that increasing CO2 will still increase warming at the surface by absorbing the IR re-radiated from the ground from incoming visible, UV and unabsorbed IR (which will be re-radiated at wavelengths included those that are absorbed by GHGs). -
cynicus at 21:15 PM on 22 March 2012Stauning and Friis-Christensen on Solar Cycle Length and Global Warming
Time for a new image to be added to the expanding list?- Global Warming - How skeptics blame the sun How realists observe the role of the sun
I think you all can imagine what image fit's this description... -
NickBoyce at 20:37 PM on 22 March 2012Breaking News...The Earth is Warming... Still. A LOT
By my calculations, an addition of (21)(10^22) joules to the world ocean's heat content should have raised the temperature of the the world's oceans by 0.0386*C. Maybe I'm mistaken. 10^9 = 10 to the power of 9, etc. (1) VolumeWorldOcean = (1.3)(10^9)((Km)^3) (Per Wikepedia). (2) 1 metre = 100 cemtimetres (cms). (3) 1 Km = (10^2cms)(10^3) = 10^5cms. (4) VolWorldOcean = (1.3)(10^9)((10^5cms)^3) = (1.3)(10^24)((cms)^3). (5) 1((cms)^3)water weighs 1g. (6) WeightWorldOcean = (1.3)(10^24)(g). (7) It takes (4.186)joules to raise the temperature of (1g)water by 1*C. (8) It takes (1.3)(10^24)(4.186)j to raise the the temperature of (1.3)(10^24)(g)water by 1*C. (9) it takes 1j to raise the temperature of (1.3)(10^24)(g)water by (1*C)/((1.3)(10^24)(4.186)) (10) It takes (21)(10^22)j to raise the temperature of (1.3)(10^22)(g)water by (1*C)(21)(10^22)/((1.3)(10^24)(4.186)). (11) It takes (21)(10622)joules to raise the temperature of the world's oceans by 0.0386*C -
Ari Jokimäki at 20:30 PM on 22 March 2012New research from last week 11/2012
Doc Snow, see the TOC of the issue in question. The Author of the article seems to be the Editor of Monthly Weather Review at that time. I bet that the name of the editor is in that issue somewhere. However, conveniently the PDF loading from that site stopped working for me, so I have to get back to you on that.
Prev 1248 1249 1250 1251 1252 1253 1254 1255 1256 1257 1258 1259 1260 1261 1262 1263 Next


