


 Arguments


Recent Comments
Prev 1295 1296 1297 1298 1299 1300 1301 1302 1303 1304 1305 1306 1307 1308 1309 1310 Next
Comments 65101 to 65150:
-
MangoChutney at 01:18 AM on 4 February 2012Monckton Myth #17: Debate vs. Denniss, Part 2
Monctons response is here: http://wattsupwiththat.com/2012/02/03/monckton-responds-to-skeptical-science/ -
Paul from VA at 01:17 AM on 4 February 2012Still Going Down the Up Escalator
@Spherica, CBDunkerson True, satellites still are not a 100% perfect sampling, but the entirety of Earth's surface is sampled below a latitude of ~80 deg. While not every single point is measured at infinite resolution, the temperature of every single point combined with its nearest neighbors is, which means that no extrapolation to unsampled areas is necessary to get a global temperature average except at the very poles. Also, I'm not surprised at the result (more going up the down escalator!), but now the pseudo-skeptics can't claim that we're cherry-picking GISS temp because it's warmer or some other such bogus argument..... -
heijdensejan at 01:02 AM on 4 February 2012It's cooling
Roy Spencer today reported that the temperature is -0.09 C below (?) what he does not tell is that in 2010 the line 0 was about 0.1 degree lower then it is now http://friendsofginandtonic.org/files/5a90411e58ea05ba14e986929b1074d4-1.html, you move up the baseline and then you tell the earth is cooling.... -
peterthorne at 00:47 AM on 4 February 2012Still Going Down the Up Escalator
Sorry, Santer et al., 2011 -
peterthorne at 00:47 AM on 4 February 2012Still Going Down the Up Escalator
Scientifically, the point really is that the short term trend is not a good indicator of the long-term forced change component of climate. Natural variability is dominant on the decadal timescale as documented in Knight et al., 2010, Easterling and Wehner, 2009 (10?) and Santer et al, 2001. I think your point may be more powerful by showing the opposite escalator too - one where each of the short segments shows much greater rate of warming than the long-term. That is less likely to lead to accusations of partisanship and is making the scientific point more forcibly - that short term trends can be used to indicate anything by any vested interest. Have you tried making such a "running up the up escalator" graph? It would be very interesting to see and I think help strengthen the point and avoid gross partisanship accusations.Response:[dana1981] Thanks for your feedback, Dr. Thorne. The purpose of The Escalator is to show how 'skeptics' and realists actually view global temperatures. 'Skeptics' constantly look for flattening or cooling trends in short-term data, whereas realists (by definition) don't look for rapid warming trends in short-term data, but rather examine long-term trends.
However, your point is taken that we could do a 'running up the escalator' graph to show that short-term data can be manipulated in the opposite way, as opposed to the way it's actually manipulated, which is what the current Escalator shows. We'll take this suggestion under consideration.
-
Bob Lacatena at 00:44 AM on 4 February 2012Still Going Down the Up Escalator
25, Paul, I was able to get an ending downward trend for the RSS data, thanks to the recent La Niña and by selecting 2002 as a start date.
-
Bob Lacatena at 00:07 AM on 4 February 2012Still Going Down the Up Escalator
25, Paul, You are very right, but for the wrong reasons. It is much harder to generate negative trends from the UAH data (I didn't try RSS). The tropospheric data is much cleaner, not so much because of the global sampling (it's not global, BTW, it reaches far towards the poles but does miss them -- see the gray areas on the RSS images here – the satellite orbits used are not set up to give a good, downward looking view of the earth at the poles), I think, but because the warming is less impacted by noise. In fact, I couldn't create a negative trend up to the end with the UAH data. Maybe someone else can try. You have to sit and peck around for exactly the rightcherry flavoredend points to use. It's very hard to do what with all of the consistent and unequivocal warming that's occurred in the past fifteen years.
-
CBDunkerson at 00:00 AM on 4 February 2012Still Going Down the Up Escalator
Paul, actually the satellite data just uses a grid with smaller cells. It is impossible to 'completely sample the Earth's surface'. Think about it. You'd need the equivalent of a 'thermometer' measuring the 'temperature' of each individual atom... or each sub-atomic particle within each atom. Anything less than that is inherently an average of multiple sources... i.e. all 'temperature' readings are averages. That said, it would certainly be possible to construct an 'escalator' for the satellite temperature record(s). However, it would likely only have a few steps since the satellite record is comparatively short. -
Paul from VA at 23:36 PM on 3 February 2012Still Going Down the Up Escalator
Just curious, what does the escalator graphic look like for the satellite temperature series? While I'm exceptionally well-aware of the troubles in calibrating the satellite data, it seems that the satellite temperature series could utterly destroy the sampling uncertainty argument, as it completely samples the Earth's surface..... -
Dikran Marsupial at 23:31 PM on 3 February 2012Still Going Down the Up Escalator
Tom Curtis I have been contributing to Briggs blog, and it seems to me he fundamentally doesn't understand the climatological issues, and apparently doesn't want to, e.g. As interesting and useful of discussions of forced versus unforced “variability” are, they are irrelevant utterly to whether claims (A) and (B) are true. It matters not how the data arose to answer the claims of whether the temperature is higher or lower over the last decade. However claims A and B relate to the statement The lack of warming for more than a decade—indeed, the smaller-than-predicted warming over the 22 years since the U.N.’s Intergovernmental Panel on Climate Change (IPCC) began issuing projections—suggests that computer models have greatly exaggerated how much warming additional CO2 can cause. and the amount of additional warming that CO2 can cause is concerned with the forced component and only the forced component. The key to success in statistics is a willingness to immerse yourself in the data and understand the data generating process and the purpose of the study. If you just wade in thinking you know what is important and what isn't and not listening to those who know the data, it is a recipe for disaster. Well I did try... -
CBDunkerson at 23:24 PM on 3 February 2012Check With Climate Scientists for Views on Climate
Norman wrote: "The air temperature in this area is not what is keeping the water around the island liquid, it would be warmer water moving in keeping the surface above freezing as the link muoncounter provided did state." You say that with far more authority than it deserves. Surely increased air and water temperatures would both contribute to lower ice formation, no? To quote the NSIDC section under discussion: "Air temperatures in December were lower than average over much of the Arctic Ocean, but higher than average over the Kara and Barents seas. Higher-than-average temperatures in these regions stemmed from two major factors. First, where sea ice extent is low, heat can escape from areas of open water, warming the atmosphere. Second, surface winds in the Kara and Barents Sea ice blew persistently from the south, bringing in heat from lower latitudes. This imported heat also helped to keep sea ice extent low in this area." So, no... your claim that this text states that warm water is the cause is false. That is one of two factors they cite. The other being warm air blown in from the south. Shocking. Heat import counters ice formation... regardless of whether the heat is brought in by air or water. That should be wholly uncontroversial. And all that being said, going back to muoncounter's original statement we find: "While you're at it, consider Arctic ice melt and world glacier mass loss; explain how these symptoms can possibly be happening if there's been no warming." So how does arguing that the ice melt is entirely due to water warming (rather than both air and water) 'contradict' his statement that it is due to warming? You seem to be 'disagreeing' with his point by saying things which prove it.Response:[DB] Please take this discussion to a more appropriate thread. Thanks!
-
Tom Curtis at 23:11 PM on 3 February 2012Still Going Down the Up Escalator
Dikran @22, there is considerable doubt as to what Briggs claim is under different circumstances, but in the blog from which the graph @14 comes, he is talking about using one value (New Proxy) to predict another value (Temperature). While deriving the regression line is an important step in that process, the regression line is not what is being predicted. What is being predicted is temperature, given the value of the "new proxy". Therefore, he has either described the error margins of the regression as the "prediction interval" which is simply false, or if your conjecture is incorrect, he has not properly calculated the error margins at all (as shown by the fact that less than 25% of the data used in calculating the regression (and hence the prediction) falls within the "prediction interval". In either case he has made an error, and his argument that classical statistics underestimates errors is based firmly on the consequences of that mistake. This goes directly to RobertS's defense of Briggs. In essence that defense is that Brigg's has been misunderstood because he has been precise. This example shows that the mere use of technical language does not make what you say precise, let alone accurate. If Briggs has been misunderstood, it is because he has been unclear, not because he has been precise. -
Norman at 23:06 PM on 3 February 2012Check With Climate Scientists for Views on Climate
owl905 @70, Here is a link to the January 2012 temp for Novaya Zemlya (land in area where Barents sea ice is still liquid). You are correct that area was very warm for its normal temp, but it has been below freezing temps since January 14th. January temps town on Novaya Zemlya. The air temperature in this area is not what is keeping the water around the island liquid, it would be warmer water moving in keeping the surface above freezing as the link muoncounter provided did state.Response:[DB] You have already been warned about dragging yet another thread off-topic about anecdotal weather events. Desist.
-
Dikran Marsupial at 22:52 PM on 3 February 2012Still Going Down the Up Escalator
Tom Curtis as I said his writing isn't the clearest, I was just opting for the most likely explanation of what he actually meant. I think it would be a good idea to include the dark area on plots of regression lines (I'd plot the most likely line as well) as it would show very clearly that the trend estimate for short timescales were very uncertain. This would prevent skeptics from claiming that the trend was flat as the error bars would show that they could be flat, or cooling or warming, and there isn't enough data to decide which. Which error bars you choose depends on whether you are trying to predict the observations or trying to estimate the rate of warming. In this case it is the latter. -
Tom Curtis at 22:45 PM on 3 February 2012Still Going Down the Up Escalator
Dikran Marsupial @20, thank you. That explanation makes sense, but is contradicted by Briggs claim that:"Notice that most of the old data points lie within the Bayesian interval—as we would hope they would—but very few of them lie within the classical parameter interval."
We do not expect all the data to fall on the regression line, and there is no reason why it should. Failure of the data to fall within the error bars of the regression line is therefore, irrelevant, contrary to Briggs' claim. I remain uncertain as to whether Briggs is confusing the error of the "predicted" regression line with the error of the predicted data, or is simply hopelessly confusing in his discussion. However, it is not a good model for to great a confidence in temperature indices in that the confidence intervals shown for temperature indices are for the value, not for the regression. Hence absent good reason to think otherwise I shall disregard that blog as irrelevant. -
Dikran Marsupial at 22:33 PM on 3 February 2012Still Going Down the Up Escalator
Tom The dark band is a credible interval for the regression line, not for the observations themselves. It is basically saying that with 95% probability the "true" regression line lies in that interval. The credible interval for the observations themselves is a combination of the credible interval for the regression line, plus a component due to the noise in the data (i.e. the spread of data around the regression line). I am not surprised that this misunderstanding should ocurr, Briggs' articles seem rather ambiguous and opaque from what I have read so far. -
Dikran Marsupial at 22:27 PM on 3 February 2012Still Going Down the Up Escalator
RobertS wrote "And Briggs never "backpedaled." He's remained consistent in his description of averages as models. " which made me think of this: Note I am not saying that Briggs is a screw-up (he isn't), merely that being consistent in promulgating an incorrect argument is not necessarily a good thing.
His point seems to be about including the uncertainty in computing the global mean temperature into computing the error bars on the trend is perfectly reasonable. However what he should have done is first demonstrate that it makes a meaningful difference to the conclusion, rather than just hint that it might to spread baseless uncertainty (the uncertainty in computing the means looks pretty small to me compared to the uncertainty in the trend due to weather noise - is internal climate variability)
As the regression line is not being used to predict or extrapolate the temperature anywhere, the "prediction" uncertainty is irrelevant.
Note I am not saying that Briggs is a screw-up (he isn't), merely that being consistent in promulgating an incorrect argument is not necessarily a good thing.
His point seems to be about including the uncertainty in computing the global mean temperature into computing the error bars on the trend is perfectly reasonable. However what he should have done is first demonstrate that it makes a meaningful difference to the conclusion, rather than just hint that it might to spread baseless uncertainty (the uncertainty in computing the means looks pretty small to me compared to the uncertainty in the trend due to weather noise - is internal climate variability)
As the regression line is not being used to predict or extrapolate the temperature anywhere, the "prediction" uncertainty is irrelevant.
-
michael sweet at 22:05 PM on 3 February 2012Still Going Down the Up Escalator
Robert, Your post was deleted as trolling, perhaps this one will be also. Averaging results as described in published papers is not predicting. You claim that in order to know something we must measure it perfectly everywhere. If that were true, then nothing can be measured. Every measurement is an average of several others. You also asked for the error bars which are linked in the OP. If you cannot bother to read the OP, why comment? A brief glance at the error bars shows that the error is much less than the trend. No analysis is needed for such an obvious observation. Briggs is wrong about the error also. It is common to leave off the error bars to make the graph more readable for a general audience. Briggs is trying to artificially manufacture doubt -
Tom Curtis at 22:00 PM on 3 February 2012Still Going Down the Up Escalator
RobertS @16, if what you say is correct, then the gist of Briggs critique is that he does not know, or chooses to ignore the meaning of the word "index", as in the "GISTEMP Land/Ocean Temperature Index" or the "BEST Land Temperature Index". They are called indices because we do not mistake them for the thing itself. Suggesting the indices have insufficiently quantified the error because the they are presumed to be the thing itself simply shows incomprehension of what is being done. -
RobertS at 21:52 PM on 3 February 2012Still Going Down the Up Escalator
Tom, I'm not sure what Briggs' thinking was, but DC does indeed provide a convincing rebuttal to that point. Despite what you appear to think, I don't believe Briggs to be the Second Coming, and I won't attempt to defend every statement he has made. But many of the criticisms leveled at him over the past few days come from a simple lack of understanding of precisely what he is saying. In particular, Tamino's entire critique revolves around the idea that Briggs is simply using the words "model" and "prediction" as some sort of semantics ploy in an effort to evoke the instinctual rejection by denialists of any argument which contain those things. This is not true. The planet is not perfectly sampled at every point on its surface, so in creating an average global temperature, you're attempting to "predict" the temperature at unsampled points using data from sampled points. These "predictions" result in uncertainty in the end product, which Briggs alleges is only properly accounted for under Bayes theorem. He fleshes this process out in more detail in the second link I give above. Such terminology is fairly common in certain fields, but not in others. Michael, I had written a response to you earlier, but it disappeared. Let's try again: What exactly do you mean by measured results? Can we measure the temperature at every point on the Earth's surface? If no, how can we combine the data we do have to create a coherent record of global temperature? Is this method completely without error? -
CBDunkerson at 21:47 PM on 3 February 2012Still Going Down the Up Escalator
RobertS, how is it correct to call 'averages' (which is not an accurate description either) of temperature measurements "predictions"? Or are you going to pull another semantic absurdity and claim that when Briggs says 'predictions', what he really means is 'measurements'? If the man was using any of the commonly accepted meanings of these words then what he said is flat out wrong. If he wasn't then there really isn't any way to tell what he was actually saying. In any event, if any part of what Briggs said were true it would ironically also contradict all of the 'no warming since XyZ' claims... because those are all based on the 'model predictions' (aka, thermometer measurements) Briggs is saying can't be used that way. Indeed, he is claiming that the entire ~130 year period is too short to establish a trend line... so 10 years would just be pathetic. -
Tom Curtis at 21:42 PM on 3 February 2012Still Going Down the Up Escalator
RobertS @9, I am still working my way through the discussions you link to, but one thing has caught my attention. Specifically, in the second blog by Briggs to which you link, he shows the following graph: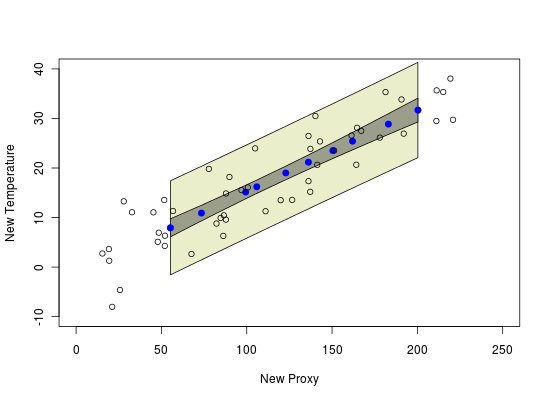 Briggs says of the dark grey band that it is "...the classical parametric prediction interval for these new proxy measurements." Earlier he had mentioned that, "The 95% parametric prediction interval for this model happens to be 17.6oC to 20.4oC." Ergo the "prediction interval" shown is the 95% prediction interval, ie, the interval inside which we would expect 95% of values to fall.
The problem is, in the graph shown, just 22.6% (7 of 31) of observed values fall within the 95% prediction interval. How is it possible for a measure of the 95% prediction interval fail to include close to 95% of the data from which the prediction interval is calculated? To my mind that only 22.6% the data from which the 95% prediction interval is derived falls inside the 95% prediction interval seems like a contradiction in terms.
On the face of it, Briggs has simply miscalculated the 95% prediction interval. His calculated prediction interval performs so badly because it is simply the wrong interval. And given that, he is able to show his calculated interval radically underestimates uncertainty simply because his error causes it to radically underestimate the uncertainty.
I am interested in hearing why we should trust a statistician who makes so fundamental error (if he has); or alternatively just why statisticians so distort the language that a 95% prediction interval means (as it must if Briggs has made no error) that interval in which approx 25% of the data will fall.
Briggs says of the dark grey band that it is "...the classical parametric prediction interval for these new proxy measurements." Earlier he had mentioned that, "The 95% parametric prediction interval for this model happens to be 17.6oC to 20.4oC." Ergo the "prediction interval" shown is the 95% prediction interval, ie, the interval inside which we would expect 95% of values to fall.
The problem is, in the graph shown, just 22.6% (7 of 31) of observed values fall within the 95% prediction interval. How is it possible for a measure of the 95% prediction interval fail to include close to 95% of the data from which the prediction interval is calculated? To my mind that only 22.6% the data from which the 95% prediction interval is derived falls inside the 95% prediction interval seems like a contradiction in terms.
On the face of it, Briggs has simply miscalculated the 95% prediction interval. His calculated prediction interval performs so badly because it is simply the wrong interval. And given that, he is able to show his calculated interval radically underestimates uncertainty simply because his error causes it to radically underestimate the uncertainty.
I am interested in hearing why we should trust a statistician who makes so fundamental error (if he has); or alternatively just why statisticians so distort the language that a 95% prediction interval means (as it must if Briggs has made no error) that interval in which approx 25% of the data will fall.
-
Tom Curtis at 21:08 PM on 3 February 2012Still Going Down the Up Escalator
RobertS @12, Briggs included in his critique the claim that:"Notice old Phil (his source, actually) starts, quite arbitrarily, with 1973, a point which is lower than the years preceding this date."
To this DeepClimate responded at Open Mind:"For greater certainty here are the BEST annual values for 1970s with trend slope to 2009: Year Anom Trend to 2009 1970 0.070 0.271 1971 -0.042 0.277 1972 -0.137 0.277 1973 0.386 0.273 1974 -0.130 0.290 1975 0.166 0.284 1976 -0.213 0.291 1977 0.274 0.276 1978 0.104 0.286 1979 0.023 0.284 So Briggs has got this completely wrong."
That seems to me sufficient rebutal, but Briggs was "consistent", and wrote,"Deep Climate–try this from the 1940s."
So DeepClimate did:"Well, OK: 1940 0.165 1941 0.087 1942 0.084 1943 0.160 1944 0.255 1945 -0.042 1946 0.022 1947 0.165 1948 0.103 1949 -0.044 1973 is still not lower than any of those (and neither is it lower than any year in the 1950s and 1960s). Want to try again? Let me save you the trouble. It turns out 1973 is *higher* than every single year preceding it. So you were utterly, completely wrong."
This may seem like a trivial matter, but accusations of cherry-picking, even veiled accusations, are not trivial. It is relevant in this case, however, because it shows that Briggs "consistency" is in significant degree merely the inability to admit error. Don't pretend otherwise when the disproof is so straightforward. -
RobertS at 20:53 PM on 3 February 2012Still Going Down the Up Escalator
Yes, a common tactic with fake-skeptics Consistency is also a common tactic with people who are correct. Who'd have thunk it? -
Rob Painting at 20:35 PM on 3 February 2012Still Going Down the Up Escalator
And Briggs never "backpedaled." He's remained consistent in his description of averages as models Yes, a common tactic with fake-skeptics - no matter how ridiculous their assertion is, they never admit they are wrong. No claim is too ridiculous to be defended by them it seems. -
michael sweet at 19:55 PM on 3 February 2012Still Going Down the Up Escalator
"And Briggs never "backpedaled." He's remained consistent in his description of averages as models" Defending Briggs by saying he has been consistent about describing measured results as models is absurd. Measured results are measured results. Briggs is attempting to raise doubt (doubt is our product!) by calling the measurements models. This alone proves he is not serious. -
RobertS at 19:05 PM on 3 February 2012Still Going Down the Up Escalator
It's difficult to ascertain what Briggs is talking about here. We're not using the current trend to predict (hindcast) the global temperature in 1940.
Try looking here and hereto get a better idea of what Briggs is saying.Ultimately Briggs completely misses the point of The Escalator.
Plait stated that the WSJ authors were "dead wrong" when they claimed that there had been no warming over the last 10 years, and illustrated this point with a static version of the escalator graph. Briggs says they weren't, and that this particular graphic cannot tell us that they were wrong. The goal wasn't to "get" the purpose of the escalator graph. WheelsOCIt's pretty telling that Briggs seems to have confused real-world, instrumental data records with climate models and predictions, and then tried to trash it.
No, I think Briggs' biggest problem is that people don't understand what he's talking about. Sloppy and inconsistent terminology abounds, and the Plait critique was apparently written with long-time readers or those intimately familiar with Bayesian predictive techniques solely in mind. And Briggs never "backpedaled." He's remained consistent in his description of averages as models. -
owl905 at 18:47 PM on 3 February 2012Check With Climate Scientists for Views on Climate
That temperature illustrated posted by Norman is an excellent example of deception and misrepresentation. If you'd looked at the same layout 48 hours ago, it was a tongue stretching across Eurasia to the eastern Europe. Europe was actually having an above-average winter until a extreme-event cycle built around the northern Siberia high pressure zone. Trying to claim that those cold temperatures are in any way representative and indicative of conditions in the Arctic is Wall Street Journalism: http://markvoganweather.blogspot.com/ -
Tom Curtis at 18:20 PM on 3 February 2012Still Going Down the Up Escalator
macoles @7, the apparent "eleven year cycle" is largely coincidental. For example, the peak of the last solar cycle was around 2000, and coincided with the very low (by 21st century standards) temperatures in the years immediately following the 1998 El Nino. While the solar cycle does have an effect, the El Nino Southern Oscillation is far more important in determining year to year variability, as can be seen in the following graph, originally from NASA: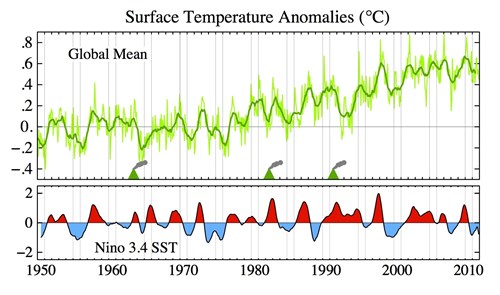
-
macoles at 18:03 PM on 3 February 2012Still Going Down the Up Escalator
Always worth giving Foster and Rahmstorf 2011 a plug whenever using the Elevator graph. The 11 year solar cycles coincide very neatly with the elevator steps (as would be expected). Perhaps someone can superimpose the two onto a single graphic? -
Stephen Baines at 16:55 PM on 3 February 2012Check With Climate Scientists for Views on Climate
Norman, first the phrase "in this area" tells you that Drinkwater is not making a statement about loss ice across the Arctic. Second, those winds drawing warm currents northward could be a function of climate change, as coulod the warmth of the water itself. Drinkwater has himself published as much in a paper simulating effects of climate change on oceanographic processes. So you haven't established whether his position constitutes a contradiction to mainstream climate science with regard to Arctic ice loss generally. You have only interpreted it so. Finally, and more to the point of this thread, why don't you write Drinkwater and ask him if he agrees with the statement of Trenberth et al? -
dana1981 at 16:33 PM on 3 February 2012Still Going Down the Up Escalator
Sure keith, if you have my email, pass it along (if not let me know and I'll contact you). -
keithpickering at 16:20 PM on 3 February 2012Still Going Down the Up Escalator
Dana, As it happens, just today I wrote a program to help with an "escalator" graph using GISS data. I'm not done with the graph, but if you wish I can send you a spreadsheet showing all the negative-slope regressions from each month of 1970-2005 for periods of 60 thru 131 months out. I zeroed out the positive slopes so the negative ones jump right out at you; it's a cherry-picker's dream. -
Norman at 16:07 PM on 3 February 2012Check With Climate Scientists for Views on Climate
muoncounter @66 Sorry. The thread is about how an expert in the field of climate science should be the one to get the correct information from. It is a counter to a Wall Street Journal opinion piece signed by scientists without expertise in the climate sciences. But your link does support the conclusions of Dr. Drinkwater and says much the same thing. Quote from your link to the Arctic sea ice page. "Air temperatures in December were lower than average over much of the Arctic Ocean, but higher than average over the Kara and Barents seas. Higher-than-average temperatures in these regions stemmed from two major factors. First, where sea ice extent is low, heat can escape from areas of open water, warming the atmosphere. Second, surface winds in the Kara and Barents Sea ice blew persistently from the south, bringing in heat from lower latitudes. This imported heat also helped to keep sea ice extent low in this area." -
Philippe Chantreau at 16:05 PM on 3 February 2012Check With Climate Scientists for Views on Climate
Norman brought my attention to the Bjerknes Centre for Climate Research where I found this interview of Susan Solomon, which brings us back to the topic of climate scientists being best suited to talk about climate science -
John Hartz at 15:50 PM on 3 February 2012The Latest Denialist Plea for Climate Change Inaction
For the scoop on one of the letter signers, check out: “Australian Meteorology Bureau Corrects Record On Former Research Head William Kininmonth's Actual Climate Change Experience” by Graham Readfearn, DeSmog Blog, Feb 2, 2012 Click here to access this article. -
Stephen Leahy at 15:49 PM on 3 February 2012Still Going Down the Up Escalator
Composer99: "We don't see things as they are, we see things as we are" Anais Nin. via Frances Moore Lappe's "Ecomind" -
muoncounter at 15:45 PM on 3 February 2012Check With Climate Scientists for Views on Climate
Norman#63: Please do not drag this thread off-topic with weather reports. The topic is getting climate information from climate scientists - not from biologists and not from weathermen. In keeping with that, if you are looking for Arctic temperatures, look here, especially at the December 2011 Arctic Air Temp anomaly map. -
Stephen Baines at 15:35 PM on 3 February 2012Check With Climate Scientists for Views on Climate
Norman, It would appear that transport of warm water into the Barents Sea could be a function of climate change. Drinkwater has written several papers looking at regional simulations on climate change and its impacts on North Sea, Norwegian Sea and Barents Sea. Some of those predict increased wind and wind driven transport of warm waters northward as a result of climate change. He also mentions the AMO at times, so its clear he also thinks there is a regional mode that also tends to drive warm water northward as well. It's clear from his papers though that he considers climate change at the global level a given. -
actually thoughtful at 15:30 PM on 3 February 2012Check With Climate Scientists for Views on Climate
Norman - go ahead and take the next step WHY is the water warming. Hmmm. What could warm the oceans - the largest heat sink on the planet.... Go ahead and think this one through for us, and see if you don't end up understanding climate science a little better for the effort. -
Norman at 15:26 PM on 3 February 2012Check With Climate Scientists for Views on Climate
Composer99 @59 I am not sure that Dr. Drinkwater is a "quack" scientist on the fringe. Here is a current temperature graph of North Asia in Celcius. This graph shows that the land air temperature is definately cold enough to easily freeze ocean water. The only reason the Barents Sea area remains liquid is because of warmer water moving in to the area driven by ocean currents. I think his determination of why the Arctic is not freezing to the normal area is because of this influx of warmer water into this area. source.
Here is a link to the weather at Novaya Zemlya, the elongated island above the Western Russia land mass.
Novaya Zemlya weather.
As you can see the temperatures are well below the freezing point yet in the arctic sea ice graph I posted @57 the water is not frozen.
source.
Here is a link to the weather at Novaya Zemlya, the elongated island above the Western Russia land mass.
Novaya Zemlya weather.
As you can see the temperatures are well below the freezing point yet in the arctic sea ice graph I posted @57 the water is not frozen.
-
John Hartz at 15:20 PM on 3 February 2012Measurements show Earth heating up, think tanks & newspapers disagree
Tom Curtis: Your comment would make a nice blog post. -
actually thoughtful at 15:14 PM on 3 February 2012Check With Climate Scientists for Views on Climate
Norman (or Elsa)- we quickly run into the twin buzz saws of the denier perspectives 1) What is all the CO2 doing in the atmosphere if it is NOT warming the planet as predicted. And 2)If CO2 is not the culprit, what IS warming the planet (with the current El Nino and quiescent sun, we would expect to be in a major cooling trend. What is your response? Anyone having a cogent response to this is on the first rung of the ladder to being a skeptic, and not merely a denier. -
Norman at 15:07 PM on 3 February 2012Check With Climate Scientists for Views on Climate
muoncounter, Also in the Science Daily article I linked to previously. The article does point out: "The entire North Atlantic warmed up during the 1920s and 1930s. More fish appeared not only in the Barents Sea but also off Iceland and Greenland. This warm period reached its peak at the end of the thirties and lasted until roughly 1960, when the waters began turning colder again -- and fisheries resources declined once more." Or this: "Many people recorded what they observed taking place in the ocean nearly 90 years ago. If we can determine what occurred during that warming period," believes Dr Drinkwater, "we will better understand what is going on today, plus we'll have more reliable input as to what we can expect in the future." -
Norman at 14:59 PM on 3 February 2012Check With Climate Scientists for Views on Climate
muoncounter @58 I checked up on Dr. Ken Drinkwater and he is more than a fisheries biologist. "Ken Drinkwater Ken’s expertise is in physical oceanography, climate change, and the impact of physical forcing on marine ecosystems. He graduated with a Ph.D. from Dalhousie University and worked at the Bedford Institute of Oceanography (BIO) located in Halifax, Canada." Note the "climate change" as part of his expertise. source. -
scaddenp at 14:38 PM on 3 February 2012More Carbon Dioxide is not necessarily good for plants.
"We do know coal seams were formed during rampant plant growth during high atmospheric co2 periods." You seem to be implying that coal seams are indicators of high plant growth. However, the requirement for coal seams is an environment which preserves plant material from oxidation combined with low sedimentation rates. The factors favouring preservation are at least as important as abundance of plant source. Plant growth may indeed benefit from CO2 but only if other essentials (especially water) are also unrestricted. It would be a simplistic correlation to equate coal with CO2. -
Minkie41 at 14:19 PM on 3 February 2012Measurements show Earth heating up, think tanks & newspapers disagree
Elsa! I believe I know what Lovelock meant.This is from Paul Edwards's A Vast Machine,MIT Press,page 439,and is not to be taken lightly.The other reference is to M.R. Allen & D.J.Frame in "Call Off The Quest," Science 318,no5850 (2007):582. The discussion involves climate sensitivity,and the idea that doubling CO2 may lead to a temperature rise of perhaps greater than 6 degrees C;which is a lot higher than the IPCC's forecast,and Hansen et al's. "Once the world has warmed by 4 degrees C," Myles Allen and David Frame wrote,"conditions will be so different from anything we can observe today (and still more different from the last ice age)that it is inherently hard to say when the warming will stop."If that is true,the search for mopre precise knowledge has little hope of success.Worse,implicit in the quest for precision is the notion that there is some "safe" level of greenhouse gases that would "stabilise" the climate.Allen and Frame's point is that we do not know this,we cannot find out wether it is true--and we now have good reason to suspect it is NOT true" We need a Churchill of a leader now!All this childish bickering over things like time series anomalies has long gone beyond the ridiculous. Peter Cummins New Zealand -
Composer99 at 14:14 PM on 3 February 2012More Carbon Dioxide is not necessarily good for plants.
JMykos: Your last sentence is technically true yet is part of a larger comment that is essentially misleading (all the more so since the key inferences are left unsaid). The fact of the matter is that the present climate change is occuring at a rate that is unprecedented in paleoclimate history - with the possible exceptions of periods that we would do well to avoid re-visiting (Paleocene-Eocene Thermal Maximum & the like). When you consider also that human agriculture has only developed during the period of relative climate stability during the Holocene, when global climate remained within a tightly constrained range, the above-noted rate of change is hardly encouraging. Nor is it any consolation to look at long-vanished climates, to which our current suite of agricultural crops are not in the slightest accustomed, and marvel at the plant growth apparent. -
Steve L at 14:09 PM on 3 February 2012Still Going Down the Up Escalator
Very quick correction -- you've got 2011 when I think you mean 2012 for some discussion of timelines in the text.Response:[dana1981] Thanks, corrected
-
Composer99 at 14:00 PM on 3 February 2012Check With Climate Scientists for Views on Climate
Norman: If 97 out of 100 surgeons are telling you you should have, say, a tumour, surgically removed, and follow it up with adjuvant chemotherapy, and three others are saying you should just drink some herbal teas, which would you go with? Or would you ignore the surgeons entirely and go with the homeopath, the chiropractor, or the quack who tells you cancer is caused by liver flukes and can be cured with a "zapper"? That is effectively where we are at with climate science. The experts who are paying attention to the evidence are in broad agreement. The remaining tiny minority are espousing positions often indistinguishable from anti-science cranks.
Prev 1295 1296 1297 1298 1299 1300 1301 1302 1303 1304 1305 1306 1307 1308 1309 1310 Next


