


 Arguments


Recent Comments
Prev 1361 1362 1363 1364 1365 1366 1367 1368 1369 1370 1371 1372 1373 1374 1375 1376 Next
Comments 68401 to 68450:
-
CBDunkerson at 03:51 AM on 10 January 2012A Big Picture Look at Global Warming
Hmmm, somehow I missed the 'Fall snow cover' graph in the top article until now. It is interesting that this shows a slightly increasing trend. This would seem to support ideas about increased atmospheric water vapor content and airflow leading to more snowfall. There have been some 'freak' early snow storms in the past few years which may not be all that unusual in the future. If a stronger hydrological cycle means Arctic air gets pulled down to mid-latitudes and mixes with warmer, water-laden, air more often then we may be seeing alot more Fall snow storms. The basically flat Winter results are also interesting. More snow in the Fall should lead to more snow cover in Winter... that it hasn't suggests that we are seeing more Winter snow melt than we used to. The declining trends in Spring and Summer are consistent with increased melt from the rising temperatures. -
dana1981 at 03:15 AM on 10 January 2012The Big Picture (2010 version)
A good place to discuss whether the observed warming has been 'minimal' or 'rapid', for example, would be A Big Picture Look at Global Warming, where we examined a subjective, unsupported claim by a certain blogger, very similar to Carbon500's assertions. -
Eric (skeptic) at 02:37 AM on 10 January 20122012 SkS Weekly Digest #1
I'm not sure that sidelining comments by "trolls" is as effective as snipping (although I realize the latter is more work). Nobody suffers any lasting harm when a comment is snipped and since it improves the threads and reduces volume in latest comments, it is a worthwhile timesaver. But for the sake of future threads it may be valuable to have an array of typical arguments pro and con for each topic (on topic of course). Sidelining the pros and cons and making it more difficult to see or respond may not be as helpful as one might think. For one thing, I doubt that more than 1% of folks redirected to this site by links elsewhere will read the comments; in those cases the trolls simply don't matter. -
Michael Whittemore at 01:42 AM on 10 January 20122012 SkS Weekly Digest #1
A spam button would be good, one that we can all push to hide the trolls comments. This way you can see the comment by revealing it, but it will reduce its effectiveness. -
muoncounter at 00:30 AM on 10 January 2012The Big Picture (2010 version)
Carbon5003147:"of course the temperature changes shown are minimal - just look at it!" This kind of statement reveals you have some continued reading to do. Do you have any idea how much additional energy it takes to raise global temperatures by one degree C? We know where this energy comes from; the 'minimal temperature change' you dismiss is a symptom that something is very out of balance. Start by working your way through the Alley video and the most used climate myths. Then see if your so-called 'sceptical' scientists (and who might they be, by the way?) answer those arguments. -
CBDunkerson at 00:25 AM on 10 January 2012The Big Picture (2010 version)
Carbon500 writes: "...it's not a matter of belief - of course the temperature changes shown are minimal - just look at it!" The word "minimal" is subjective, and thus inherently is a "matter of belief". That 'minimal' rate of change is more than an order of magnitude greater than that which ended the last glaciation. Personally, I do not find a temperature shift sufficient to cover half the planet in ice over a mile thick 'minimal'... but that's just my own subjective belief. As to seeing who is right about AGW over the years ahead, that would have been a somewhat reasonable statement... in 1900. Since then 'the years ahead' have transpired and AGW is now observed reality. Humans have caused atmospheric CO2 levels to increase. That, perforce, will cause (indeed, has caused) global temperatures to rise. Observed reality. If you can't see reality now there seems little reason to assume that you will be able to do so at some time in the future. -
Carbon500 at 23:59 PM on 9 January 2012The Big Picture (2010 version)
CB Dunkerson and Skywatcher: my comment was about the numerical data presented in the four graphs shown; it's not a matter of belief - of course the temperature changes shown are minimal - just look at it! As regards the lack of understanding on my part that you suggest, I assure you that I've done plenty of reading around the subject, from the IPCC's 'Climate Change 2007' and numerous research papers plus books by so-called 'sceptical' scientists. As a result,I don't consider the idea of AGW to be a fact. Who's right? We'll see over the years ahead, won't we? -
OPatrick at 23:56 PM on 9 January 20122011 Expected to be Second Warmest Year on Record for the UK
40 minutes on a motorcycle in to work each morning - you *know* when it's cold. John Prior can say what he likes, this winter has been exceptionally mild in the South West at least! -
2012 SkS Weekly Digest #1
I think the comment policy on SkS is one of the best. Would a ban on new unvetted users making the first comment on a post help? The first comment often directs the further comments in the discussion - a distraction if it was a troll. -
skywatcher at 22:47 PM on 9 January 2012The Big Picture (2010 version)
#143 carbon500: your post is a great example of somebody not understanding the small range of mean temperatures that have been present for all of human agriculture (the Holocene), thus the significance of a degree Celsius warming. Just four degrees or so is a glacial-interglacial transition. Similarly, you don't understand the exceptionally rapid rate of warming we're experiencing in comparison to any other known period in recent, Quaternary or geological history, much faster than animals, plants and particularly soils can adapt. Fancy growing wheat on what is now tundra? How long do you reckon it might take to get fertile soils in the tundra? -
CBDunkerson at 22:31 PM on 9 January 2012The Big Picture (2010 version)
Carbon500, this is an overview post and thus does not include all the details. If you don't understand why rising temperatures are bad (beyond a false belief that this is only because 'models say so') please see positives and negatives of global warming. The links in the list of common climate myths in the upper left portion of the page might also be useful in correcting some of the false information you have apparently absorbed. That said, the flaws in your belief that temperatures show, "tiny variations, with a recent downturn" are amply explained in the article above and directly disproven by figures 2, 3, and 4. That you would repeat a false belief in 'response' to a posting which disproves it is not a particularly good sign. -
Paul D at 21:59 PM on 9 January 20122011 Expected to be Second Warmest Year on Record for the UK
Agree 100% with dorlomin regarding cycling. I tend to be a fair weather cyclist and it is unusual to see me cycling from December through to February. But this year in the South has been dry and warm, allowing me to cycle more. But personal advantages are outweighed by the real threat of drought this year, due to a lack of rain in the South East/South regions. -
JMurphy at 20:55 PM on 9 January 2012Global Warming: Trend and Variation
apiratelooksat50 wrote : "Is there definitive proof that the effect of the GHGs is enough to override the orbital factors as we should be heading into another glacial period?" As a further indication of the way things are going (not "definitive proof", of course, as anyone conversant with science knows that is rarely/ever possible), this recent article on the BBC website is worth a read : Carbon emissions 'will defer Ice Age' It's also interesting (although unsurprising) to read in that article how the GWPF (Lawson's denial group which somehow is able to function as a charity) are using such evidence (and a scientific essay from 1999) to claim that we should be adding more CO2 to the atmosphere ! Perhaps that is the next step for apiratelooksat50...? -
Rob Painting at 20:51 PM on 9 January 2012The Big Picture (2010 version)
Carbon500 - Doug is that you? Yes the Earth is regulating it's temperature so well it keeps going up. Not sure what your point is here. We expect it to go up according to the increased Greenhouse Effect - and it is! No one expects El Nino/La Nina, volcanoes, and other naturally variable factors to suddenly vanish. So a wiggly upward trend isn't exactly shocking news. -
Carbon500 at 20:43 PM on 9 January 2012The Big Picture (2010 version)
You haven't explained why you think these temperatures represent any kind of dangerous threat, apart from reference to models. What I see in these graphs is a 50 year record, with undulating trophospheric anomalies of plus or minus half a degree at the most - tiny variations, with a recent downturn. I suggest that these graphs show that the Earth is in fact regulating its temperature rather well. -
les at 20:20 PM on 9 January 20122012 SkS Weekly Digest #1
another 2c from an occasional poster and avid reader... IMHO the great strength of the site is that the comments are (as I understand it) meant to be Of the Article posted and for improving, correcting and clarifying that article. Often these discussion have been superb and of high quality - including the contributions from, lets say, a wide range of thoughtful opinion. This contrasts with the bulk for blogs where it's more "here's an issue, what do people think...". However, this makes it hard, on the one hand, to get into a conversation of issues arising which may lead somewhere good; and hard, on the other hand, to moderate out trolls (who pretend to be discussing issues arising) without the accusation of censorship. IMHO that dilemma could be cured by having a 'sister' discussion forum - even just something like google groups or such - as a place for 'off topic' interesting discussions + a sink for trolls. Whether or not that's done; I do think a strong and clear comments policy keeping discussion to the topic to had is the right way to go. -
dorlomin at 20:17 PM on 9 January 20122011 Expected to be Second Warmest Year on Record for the UK
And the SE of England has been remarkably dry. The low pressure systems seem to have been steared up towards the north end of the island. Still been some great cycling weather even into december down here in England, my folks back up near Glasgow have been less than impressed though. -
scaddenp at 20:08 PM on 9 January 20122012 SkS Weekly Digest #1
For my 2c. I really like the idea of a little tool for moderators to move posts to an appropriate thread. I am not a moderator so hazy on how it works - but - could there be a button to send a commentor an email from a noreply sks email address, so can say "resubmit with a citation please" (regulars as guilty as skeptics), "try again without the inflammatory tone" etc. ie encouragement to participate in the spirit of the site but without any possibility of a private email war. I would agree that moderation is what makes this site readable. -
CBDunkerson at 19:44 PM on 9 January 20122012 SkS Weekly Digest #1
1: Issues where posts are deemed off topic for a particular thread come up constantly. It would be nice if the moderators could actually move the post(s) to the appropriate thread with just a link to the new location left behind. Yes, this requires work by the moderators... but so does warning people that they are off-topic, specifying another thread in the comments, deleting off-topic comments, et cetera. 2: There should be a standard thread for the many people with little to no understanding of the science beyond false claims they've heard elsewhere. This would be a very powerful feature for reducing off-topic clutter while still allowing questions and false beliefs to be directed to the actual science. If the headline post for the thread contained an overview of major site features and resources for new people (e.g. Most used myths, search box, big picture, fingerprints) it would help cover many of the sorts of issues that would be directed there. It would also simplify moderator duties because the vast majority of off-topic comments could be directed to a single thread rather than the moderator having to identify the best thread to house gish-gallop #734. 3: The 'all caps' rule should be revised to only apply to blocks of text. Currently it is sometimes invoked (and sometimes not) when a single word is capitalized for emphasis... which frankly, is no different than bolding or italicizing. All three are examples of attempting to put the emphasis of speech into text. At that, deliberately (as opposed to by forgetting a tag) putting an entire paragraph in bold text is just as much 'shouting' and overkill as capitalizing the entire paragraph. All forms of emphasis (e.g. putting >brackets< around a word) should be allowed, but only when used sparingly. -
Doug Hutcheson at 19:00 PM on 9 January 20122012 SkS Weekly Digest #1
The cartoon is the funniest I have seen posted here. Should be on a tee-shirt for like-minded people to wear as a gentle form of AGW PR. -
Glenn Tamblyn at 18:44 PM on 9 January 2012Global Warming: Trend and Variation
Often there is something going on in the minds of 'skeptics' that can explain this sort of behaviour. While they use the label 'skeptic' for themselves which implies a dispassionate bur reasonable doubt, in reality what is actually going on for 'skeptics' is actually something else. An actual disbelief in the warming in the face of the evidence. Or more importantly perhaps a 'need' to disbelieve; damn the evidence, this CAN'T BE TRUE. One of these so called 'skeptics' is actually like someone who is looking for the loose thread that they can tug on to make the whole tapestry unravel. How often do you hear AGW described as a 'house of cards'. What a reassuring image that is to them. Pull the right card out and the house comes tumbling down. That whooshing sound you just heard wasn't the sound of cards falling, but rather a huge exhalation of breath. Thank God. This idea that we so desperately needed to make just go away turned out to be 'just a house of cards'. We can all breath a sigh of relief and go back to a life where there aren't any threats, where we all feel safe & comfy. Where as the image that AGW is like a jigsaw puzzle is deeply disturbing. If one piece doesn't fit, that doesn't make the whole puzzle wrong. Which is such a terrifying thought. Because this is the underlying thing revealed by the most vehement, angry, vicious flavour of 'skepticism' The desperate fearfulness of its adherents. Simple rule in life - when you see Anger, look for the Fear that underlies it. So when a 'skeptic' cherry picks a short term trend to say - "see, see, see. Its stopped warming. So much for all your Warmist's theories". Stop and listen for the whoosh; The sense of relief that the fearful feel when they think they have found release from their fear. Oh that life were so simple. -
John Hartz at 15:51 PM on 9 January 20122012 SkS Weekly Digest #1
@actually thoughtful #9: Thank you for your thoughtful (The Devil made me do it!) feedback. Your suggestions about how to handle trolls are particularly welcome. -
actually thoughtful at 15:44 PM on 9 January 20122012 SkS Weekly Digest #1
wysiwyg - yes. Moderation of trolls: - I suggest you let them post their first message (whenever/wherever it occurs). Then, in a moderator response - explain they are "on probation" until they support their claims in that thread. So they would be banned from any thread but that one. Then they get two chances. If they don't show _significant_ signs of being amenable to facts and logic - ban 'em! (As in the Apirate would be the bottom of the barrel for being amenable to facts and logic). But leave their first shot and two chances up for posterity - to demonstrate this is how it works here. This _should_ reduce moderation work over time. Another idea for trolls - I would like this site to either accept that trolls drive up message count (note the BS* post went from 50+ to ~20 when troll was subtracted) - so people obviously _like_ setting someone straight or assign only one person to battle the troll. It gets tiring to read through, literally 5-10 people correcting the one person. It feels like they have won by wrapping us around the axle on whatever their ax is (if I may be so bold as to mix my metaphors). I _don't_ like moderators having to police housekeeping stuff like all caps (a message in all caps is bad, but for emphasis, w/o wysiswyg it seems like a silly thing to spend so much time/effort on). I always think I will use caps for the occasional emphasis until we get wysiwyg around here. I am only avoiding that on this post as you were nice enough to _ask_. And I assume/hope Rob P has better things to do than snip out the best parts of my posts.... For we the great unwashed (regulars who are neither trolls nor moderators) - I would appreciate a moderator response any time you edit my post - so I know what you didn't like, so I can decide to ignore it (grin here) or change my ways. Again, the over-riding goal of moderation is to reduce the moderation load in the future (within reason). Overall the moderation is what prevents this from being a WUWT style yelling and screaming match, with the moderator (referee) throwing the match to the anti-science side. But I think the appearance of fairness is critical - I thought the troll on the BS* post was getting around to asking actually valid questions before he, all his posts and all the response to his post were shown the door (though I didn't pay that much attention). The more the site bleeds fairness (yet stays true to the science right there in the URL) - the more SkS well deserved positive reputation will continue to grow. Thanks for asking. And thanks for the moderation work so far - it is truly valuable, and appreciated by all, yet clearly not as visible as the great articles. -
John Hartz at 15:41 PM on 9 January 20122012 SkS Weekly Digest #1
@Chris G & Stevo: The potential changes to the Comments Policy being discussed by the SkS author team are relatively minor tweaks here and there. No major changes are being contemplated at this time. -
John Hartz at 15:34 PM on 9 January 20122012 SkS Weekly Digest #1
@Daniel Bailey #4: Let's keep this thread focused on the comments policy and moderation. We'll be asking for reader input on other aspects of the SkS website in future editions of the Weekly Summary. -
adelady at 15:12 PM on 9 January 20122012 SkS Weekly Digest #1
I'd really like WYSIWYG. It's becoming more common elsewhere and it does make things easier for people who tend to emPHAsise by using allcaps. Would also make life a bit simpler for moderators - rather than coming down hard on new or naive commenters with a demand that they can't say what they want without acquiring a whole new skill set. (Or at least, that's the way some of them might see it.) As for comments policy and moderation, stay strong. -
Pete Dunkelberg at 14:48 PM on 9 January 20122012 SkS Weekly Digest #1
Comment policy - agree with Stevo @ 3. -
Daniel Bailey at 14:16 PM on 9 January 20122012 SkS Weekly Digest #1
Basically we're looking for user inputs. This site is for you, the user; what we'd like to hear is what you like about the Comments Policy, dislike about it, and any suggestions for improvement you may have. About the Comments Policy or any other present or desired aspect of the site. Such as by Chris G above WRT the image posting tips. I know one thing I'd like to see is the addition of WYSIWYG capabilities to the comments posting box. -
Stevo at 13:46 PM on 9 January 20122012 SkS Weekly Digest #1
Agreeing with Chris. Which aspects of comments policy are you looking at changing? As for the current comments policy, I regard it as the great strength of this site. Please keep it just as it is. -
Chris G at 12:58 PM on 9 January 20122012 SkS Weekly Digest #1
Oh yeah, I still think it would be more clear if the tip on how to link a picture were changed to something like: ‹a href="URL of the page containing the picture"›‹img width="450" src="URL of the picture within that page"›‹/a› -
Chris G at 12:47 PM on 9 January 20122012 SkS Weekly Digest #1
Regarding the comments policy, I think they have done a good job of reducing noise in the comments. I do think short (say ~12 words) copies from what someone else wrote are an acceptable means of identifying a key point of contention, particularly if the previous comment was longish and contained multiple points. However, I concede that copy-paste can lead to clutter and abuse, and so allowing any at all puts more of a burden on the moderators than may be worthwhile. Can you hint at what aspects are being discussed, or would that taint the results? One of my peeves at other sites is the posting of a naked URL; please tell me what you think I should take away from the information there. It is seldom worthwhile to read pages of information and then have to guess at what the linker thinks it means. There are others more important, but that one is a distinguishing feature. Of course, I've only gotten called on policy once that I recall; so, I'm biased toward leaving it as it is. -
skywatcher at 11:56 AM on 9 January 20122011 Expected to be Second Warmest Year on Record for the UK
Scotland's wettest year on record... as a Scot I can say that takes some doing! Of course it's in line with the expected rise in precipitation as the world warms, and observations of (much more damaging) flooding in many parts of the world. I saw recently a graphic by Jeff Masters showing Decembers of the past six years have had the two most extreme positive and two most extreme negative Arctic Oscillation indices on record. This has significant consequences for UK weather, as seen in the past two winters. I wonder if such dramatic AO variation will be a feature of the future? -
skywatcher at 11:39 AM on 9 January 2012The 2011 Climate B.S.* of the Year Awards
DMarshall, in addition to Rob's point, why should professional scientists waste time debunking the latest misinformation in the long line from Watts, especially when the data is available for anyone to carry out the experiment? After Menne et al, Fall et al (which Watts was a co-author), and now BEST, Watts' surface stations ideas are utterly dead in the water, scientifically. Watts just fails to accept that. -
Glenn Tamblyn at 11:22 AM on 9 January 2012Skepticism About Lower Atmosphere Temperature Data
climatewatcher.@3. Since you haven't given the source for your graphics it is very hard to make a judgement about them. If they are radiosonde based, you need to be very careful which series you are using since a great deal of work has gone into correcting problems with them, particularly issues related to instrumentation changes and problems with temperature measurements at higher altitude. If it is the satellite data you are referencing, you need to be aware that of the 4 temperature series produced by UAH & RSS, only their lower Troposphere and Lower Stratosphere series are relatively uncontaminated by mixing Trop & Strat temps together although the lower Troposphere series still has issues with larger error margins due to the processing methods needed and more contamination from ground sourced signals. The Mid Troposphere series is biased low because around 20% of its signal actually originates from the Stratosphere. Even more so the Upper Troposphere series is sourced nearly 50/50 from the actual Upper Troposphere and the Lower Stratosphere. As such it is actually worthless as a true measure of Upper Tropospheric warming. I comment on some of these issues here http://www.skepticalscience.com/Eschenbach_satellite_part.html and here http://www.skepticalscience.com/Primer-Tropospheric-temperature-measurement-Satellite.html -
Tom Curtis at 11:07 AM on 9 January 2012Global Warming: Trend and Variation
pirate @33, you now claim that: 1) The overall temperature pattern will stay the same even though humanity have radically altered the level CO2 (from your response to my 24); and 2) CO2 is a positive forcing that is increasing (from your response to Tmac at 33). Given the scale of the CO2 increase relative to normal glacial levels, and the scale of likely future anthropogenic increases in CO2 levels as shown by DB, these claims are only consistent if net feedbacks are negative so that the increase in temperature due to increased CO2 is much less than the 1.2 degree C increase expected from doubling CO2 with no feedbacks. Not only does such a low response fly in the face of all the evidence on climate sensitivity; but it is also inconsistent with such large temperature changes between glacials and interglacials as shown in the chart you presented. That change is almost entirely due to feedbacks on a locally large but globally very small (<< 1 w/m^2) milankovitch forcing, and if feedbacks are net negative, such a large feedback is in fact impossible. Consequently your beliefs as presented in this thread (because they are contradictory) are not even rational, let alone based on the scientific evidence. -
Tom Curtis at 10:57 AM on 9 January 2012Global Warming: Trend and Variation
pirate @40, it is by no means obvious that we would currently be heading into an ice age even without human generated CO2. Based on modelling, the current milankovitch forcings are such that we would enter an ice age only with CO2 concentrations below 220 ppmv Caption:
(My emphasis. Source, Berger and Loutre 2002) As I have argued elsewhere, it is by no means clear that we would have entered an ice age without pre-industrial anthropogenic CO2 emissions, but it is certainly clear that we will no with industrial CO2 emissions. At least, not for the next 50,000 years. I would suggest, however, that this topic is off topic for this thread."Orbiting the Sun. Long-term variations of eccentricity (top), June insolation at 65°N (middle), and simulated Northern Hemisphere ice volume (increasing downward) (bottom) for 200,000 years before the present to 130,000 from now. Time is negative in the past and positive in the future. For the future, three CO2 scenarios were used: last glacial-interglacial values (solid line), a human-induced conc entration of 750 ppmv (dashed line), and a constant concentration of 210 ppmv (dotted line)." -
Tom Curtis at 10:40 AM on 9 January 2012Skepticism About Lower Atmosphere Temperature Data
climatewatcher @3, the upper tropospheric hotspot is not an predicted consequence of greenhouse warming per se, but of any warming, whether due to changes in solar forcing, green house forcing, albedo or internal variability, and is a consequence of increased absolute humidity reducing the lapse rate. The one certain consequence of those predictions being wrong is that the lapse rate feedback, an important negative feedback will not be as strong as expected. The lack of the hotspot certainly does not call into question the fact that the Earth is warming, as can be seen in the surface measurements in all your illustrations. Therefore, as it is a predicted consequence of all forms of warming, it cannot call into question warming by greenhouse gases. Further, there is good reason to question the accuracy of all the measurements used by you. In particular, the satellite measurements use a channel that detects a signal from both the troposphere and the stratosphere, which is cooling. There is good reason to think that neither RSS and (particularly) UAH have completely removed the stratospheric signal, a fact that would obscure the existence of the hotspot. Other evidence suggests the hotspot in fact exists, although the science continues to remain very ambiguous on this point. Further discussion on this point is best conducted on the tropospheric hotspot thread where much of the relevant evidence is already presented in the main article. -
dana1981 at 09:57 AM on 9 January 2012Skepticism About Lower Atmosphere Temperature Data
CW @3, please learn the difference between 'pattern' and 'trend'. Also see our 'hot spot' rebuttals. -
OPatrick at 09:47 AM on 9 January 20122011 Expected to be Second Warmest Year on Record for the UK
As Dave123 says, focusing on one year can be misleading, but "all the UK's top seven warmest years happened in the last decade" is an important message to emphasise. Also the apparent variation in the weather seems important - is this measurably unusual? Uncertainty is the greatest concern, the UK weather seems to be demonstrating uncertainty in spades. But then maybe it always has. -
Rob Painting at 09:11 AM on 9 January 2012The 2011 Climate B.S.* of the Year Awards
DMarshall - if that happened the goalposts would simply be shifted. Remember Watts said he would accept the results of BEST and now he doesn't. The fake-skeptics are too psychologically invested in denial to accept the 'inconvenient truth.' -
calyptorhynchus at 09:05 AM on 9 January 2012Skepticism About Lower Atmosphere Temperature Data
Very good rebuttal, but "Unfortunately, the article contained a litany of errors...", a litany is not a list, it is a series of supplications to God.Response:[DB] I believe definition #2 is in play:
lit·a·ny/?litn-?/
Noun: - A series of petitions for use in church services, usually recited by the clergy and responded to in a recurring formula by the people.
- A tedious recital or repetitive series.
-
DMarshall at 09:01 AM on 9 January 2012The 2011 Climate B.S.* of the Year Awards
What harm would there be in asking the BEST authors to reanalyze the data over a 30 year cycle. If the warming trend is clear, as we expect, then shutting WUWT up is well worth the trouble. Giving Watts a way to weasel out of keeping his word only emboldens the contrarians. -
scaddenp at 08:16 AM on 9 January 2012Global Warming: Trend and Variation
You might also note that milankovich forcings have always been with us but can only initiate an glacial/interglacial cycle when GHG concentrations are low enough for the ice-albedo feedbacks to be significant. -
scaddenp at 08:10 AM on 9 January 2012Global Warming: Trend and Variation
"Is there definitive proof that the effect of the GHGs is enough to override the orbital factors as we should be heading into another glacial period?" "proof" and science have a difficult relationship. However, since the forcing due to GHG is larger than the forcing due to milankovich, is that arithmetic inequality a good enough proof for you? ie maximum milankovich forcing per century at 65N at 0.25W/m2 cf 1.66W/m2 for CO2 alone for whole globe? -
Rob Honeycutt at 07:34 AM on 9 January 2012Global Warming: Trend and Variation
apirate... "Is there definitive proof that the effect of the GHGs is enough to override the orbital factors as we should be heading into another glacial period?" To more directly answer that question I would have to say that science understands the amount of forcing coming from orbital cycles and those very much pale in comparison to the radiative properties of man-made GHG's. I believe the data is contained within Caillon 2003 that muoncounter linked to. This is also discussed in Miller 2010 where they state that orbital factors are actually acting to drive a "neo-glacial" cycle starting about 5000 years ago. What we've done is counteracted that orbital forcing with anthropogenic GHG's. The uncertainties outside of "settled science" have to do with other factors. No one here would ever claim that climate science has this locked down. There is always more to know. That we are driving warming is settled science. Exactly how the climate system will respond to that warming is still uncertain. -
Rob Honeycutt at 07:26 AM on 9 January 2012Global Warming: Trend and Variation
apirate.... With glacial-interglacial cycles GHG's work to amplify the signal coming from orbital forcing, as do other things like ice albedo. The noise is just the way the climate responds to those forcing and feedbacks over shorter periods. The "definitive proof" is merely physics. We know what atmospheric gases have radiative properties. We have clearly quantified those radiative properties and we can measure the radiative imbalance resulting from increasing GHG concentrations in the atmosphere. That's the settled science. As Stephen Schneider stated in the video I posted a week or so ago, "You can't add 4W/m-2 to the entire surface of the earth and expect nothing will happen." The noise is a function of the climate system itself. Climate is complex and it responds in a wide variety of ways whether the forcing is from orbital factors or it's us adding GHG's. The direction of the forcing is clear. The shorter term ups and downs are expected and somewhat unpredictable. The trend is predictable. Can you predict how far up the beach each wave will reach? No. Can you predict whether the tide is coming in or going out? Yes. That's basic physics. Within the glacial-interglacial cycle can you perfectly model the shorter term noise of warming and cooling? No. Can you model the glacial-interglacial cycles themselves? Yes. It's basic physics. -
ClimateWatcher at 07:11 AM on 9 January 2012Skepticism About Lower Atmosphere Temperature Data
Modeled is upper left. RATPAC (raobs) is lower left. UAH MSU is upper right. RSS MSU is lower right: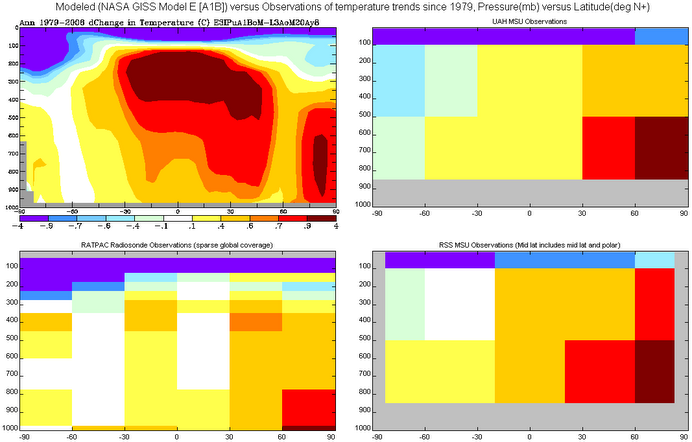 General warming trend in the troposphere and cooling trend in the stratosphere do appear to be corroborated by the observations.
The tropical upper tropospheric hot spot and a general maxima of warming aloft appear to be contradicted by the observations.
Response:
General warming trend in the troposphere and cooling trend in the stratosphere do appear to be corroborated by the observations.
The tropical upper tropospheric hot spot and a general maxima of warming aloft appear to be contradicted by the observations.
Response:[DB] It is considered good form to also publish the paternity of graphics used in one's comments. For example, the URL of your graphic is:
http://photos1.blogger.com/x/blogger2/.../gse_multipart51047.png
Which unfortunately tells us nothing of the sources used for the images.
-
Dave123 at 07:04 AM on 9 January 20122011 Expected to be Second Warmest Year on Record for the UK
Should we be reporting this, interesting as it is, when we keep saying (correctly) that it's about global temperatures? I understand that the context is about UK temperatures being used by Deniers, but maybe that should be how the article is written? -
John Hartz at 07:00 AM on 9 January 2012A Big Picture Look at Global Warming
@ Dana: There's a broken link embedded in "climate denialist" -- first sentence of first paragraph in the Rapid Global Warming section. -
Bibliovermis at 06:49 AM on 9 January 2012Global Warming: Trend and Variation
Pirate, Continuing the analogy of cyclical climate change as tidal rising & ebbing, GHG increase would translate to adding more volume to the sea. There would be variation along the trend. Sea level would still periodically fall, with the ebb point being, not consistently, higher than the previous rise points.
Prev 1361 1362 1363 1364 1365 1366 1367 1368 1369 1370 1371 1372 1373 1374 1375 1376 Next


