


 Arguments


Recent Comments
Prev 1365 1366 1367 1368 1369 1370 1371 1372 1373 1374 1375 1376 1377 1378 1379 1380 Next
Comments 68601 to 68650:
-
ubrew12 at 08:10 AM on 6 January 2012The 2011 Climate B.S.* of the Year Awards
DrTsk@#5 and CBDunkerson@#8: I hope this isn't too far afield of this thread, but why are windmills white (unless as a gift to the fossil-fuels industry)? Why not earth-tones/dark blues and purples (with prominant flashing lights on top that can't be seen from the ground)? Why do people hire landscape architects for homes and buildings and not alt energy projects? Just wondering... -
Minkie41 at 08:04 AM on 6 January 2012A Big Picture Look at Global Warming
From "The Gathering Storm" (May,1935),WS Churchill's first book in his "The Second World" series,page 112,Reprint Society,1951. "There lay in my memory at this time some lines from an unknown writer about a railway accident.I had learned them from a volume of Punch cartoons which I used to pour over when I was eight or nine years old at school at Brighton. Who is in charge of the clattering train? The axles creak and the couplings strain; And the pace is hot,and the points are near, And Sleep has deadened the driver's ear, And the signals flash through the night in vain, For Death is in charge of the clattering train." -
muoncounter at 07:43 AM on 6 January 2012A Big Picture Look at Global Warming
CW#6: "for the last eleven years, warming trends have decelerated" [DB] reply: "The point is without statistical merit... " Not to mention the fact that the point is also incorrect. See Foster and Rahmstorf: There is no indication of any slowdown or acceleration of global warming, beyond the variability induced by these known natural factors." -
CBDunkerson at 07:40 AM on 6 January 2012The 2011 Climate B.S.* of the Year Awards
Ubrew12, as DrTsk implies, the acceptance of wind power in Iowa is largely driven by economic rather than environmental concerns. Indeed, if promoted as a way to oppose global warming, many Iowans might have opposed it. However, the area is part of a major wind corridor (which also contributes to the prevalence of tornadoes) and thus wind power is more economically viable here than in most other parts of the world. Ironically, I am in Iowa at the moment and 60+ degree (fahrenheit) temperatures in Adair county are setting a new record high for the day... yet, while this has been endlessly discussed, absolutely no one I have talked to thinks it has anything to do with global warming. All that said, I think the fact that even my 'Republican corn-grower' relatives are backing things which do work to reduce global warming is a hugely positive sign. If wind and solar power become inexpensive enough we may be able to beat global warming despite the misinformation campaign. Indeed, once they lose on the economic front most of the deniers will likely move on and it is likely that scientific reality will then be allowed to filter through to most people. Just as all but the lunatic fringe of the 'tobacco smoking does not cause cancer', 'acid rain is fake', and 'fixing the non-existent ozone hole would bankrupt the world economy' deniers have given up the ghost, so too will most of the AGW deniers once the underlying economic battle has been won one way or the other. The wind mills I can see all over the countryside here demonstrate that economic battle can be won independently of the fight against misinformation. -
muoncounter at 07:37 AM on 6 January 2012The 2011 Climate B.S.* of the Year Awards
The folks you've awarded First and Second places to are really one and the same. I'd have put J Curry up for an award for such BS* gems as 'Wow,' the 'uncertainty monster' and 'there is no scientific basis for saying the trend hasn't paused.' -
DrTsk at 07:33 AM on 6 January 2012The 2011 Climate B.S.* of the Year Awards
Memo received! -
DrTsk at 07:18 AM on 6 January 2012The 2011 Climate B.S.* of the Year Awards
Ubrew. No subsidies and money are always welcome... -
DrTsk at 07:17 AM on 6 January 2012The 2011 Climate B.S.* of the Year Awards
Excellent choices for the awards! I wish we had a public ceremony to give these to their recipients. -
ubrew12 at 07:15 AM on 6 January 2012The 2011 Climate B.S.* of the Year Awards
I was really hoping someone would ask the Republican Presidential candidates during the Iowa caucus the following question: "If there's no such thing as global warming, why does Iowa now generate 20% of its electricity from wind power? Have these largely Republican corn-growers just naively swallowed the AGW propaganda?" -
Michael at 06:54 AM on 6 January 2012A Big Picture Look at Global Warming
By the way an excellent post by Dana. -
Michael at 06:51 AM on 6 January 2012A Big Picture Look at Global Warming
To @ ClimateWatcher. Please compare paleoclimate quantities of CO2 in the atmosphere to average global temperature. Assuming you accept CO2 is the main level of the Greenhouse effect you can then be left in no doubt that a substantial and rapid Earth System warming is inevitable given the relative atmospheric lifetime of CO2 when compared to manmade aerosols. If you do not accept that CO2 is the main lever for the greenhouse effect please consult with the following papers: http://pubs.giss.nasa.gov/cgi-bin/abstract.cgi?id=la09300d http://pubs.giss.nasa.gov/cgi-bin/abstract.cgi?id=sc05400j http://pubs.giss.nasa.gov/abs/ha05510d.html When discussing the future of the species or climate and ecosystem health it is not very helpful to focus on decadal variations. -
John Russell at 06:46 AM on 6 January 2012The 2011 Climate B.S.* of the Year Awards
I think I'd have put Lord Lawson's 'Global Warming Policy Foundation' -- a charity -- further up the list. I haven't included a link because I don't want to give them the oxygen of publicity. Instead I'll link to one of the many articles rebutting their activities.Response:[dana1981] Here's the SkS version of that rebuttal.
-
Rob Painting at 06:34 AM on 6 January 2012Models are unreliable
Tristan -"There seems to be little indication of increased warming" Nonsense. Over 90% of global warming is going into the oceans. Did you miss Dana's recent blog post? Check out the last 40-ish years: I guess a blog post and graphic(s?) is necessary to clear up this confusion because a lot of the fake-skeptics don't seem to grasp this.
-
John Hartz at 05:41 AM on 6 January 20122011 Year in Review (part 1)
Suggested reading: “Top climate change stories of 2011” by Andrew Freedman, Capital Weather Gang blog, Washington Post, Jan 4, 2011 Although Freedman plows some of the same ground that MarkR does in the above, there are some significant differences in the focus of the two articles. Freedman covers the following: 1. Advances in understanding global warming and extreme weather 2. Surface temperature record holds up to (another) review 3. “Climategate 2” falls flat 4. Congress Nixes National Climate Service -
owl905 at 05:36 AM on 6 January 2012A Big Picture Look at Global Warming
Climate Watcher criticizes paleo ice-core records as regional while resting on HadCrut which has its own limitation of eliminating polar regions. Dana's context is valid to the point of extremely conservative: glacial to inter-glacial 8dC over 5k years is a stability crawl compared to a 2dC rise over a century. It isn't 'climate change', it's 'biosphere disruption'. The big picture is that graph showing heat transfer to the deeper layers of the oceans - 3D AGW at a measurable rate in a human-observable period. -
Composer99 at 05:32 AM on 6 January 2012The 2011 Climate B.S.* of the Year Awards
As far as the OP goes, Rush maybe deserved a climate B[ad]S[cience] award (although it would be a close thing between him, Watts, and Spencer/Christy/Braswell) on account of the size of his listenership. -
PluviAL at 05:31 AM on 6 January 2012Myth of the Mini Ice Age
Amazingly brazen liars that people like to hear. On a related topic. How does the Skeptic Community see Robert B. Laughlin? He wrote a book titled: Powering The Future. It seems he takes some liberties, but he also seems well reasoned. He is a Nobel Prize winner in Physics. He said that Breeder Nuclear will provide 20,000 years of energy. He also siad that CO2 is not really a big deal. That Carbon is our friend. Is he another myth-sayer or just different outlook? -
dana1981 at 04:15 AM on 6 January 2012A Big Picture Look at Global Warming
CW @6 - you continue to miss the point. If you're going to argue that the planet isn't "warming rapidly", you need an objective definition of what that phrase means. My solution was to use the paleoclimate record. Your solution is to compare current warming rates to projected future warming rates. Your argument is thus equivalent to "if the planet isn't currently warming as fast as we expect it to warm in the future, then it's not warming rapidly." To be blunt, that argument makes no sense whatsoever. Moreover, you continue to focus on short-term noise while ignoring the long-term trend. I again refer you to the 'Rising Surface Temperature' section of the above post. -
Dikran Marsupial at 03:58 AM on 6 January 2012Models are unreliable
Tristan As this thread is about the models being unreliable, do the models suggest that this acceleration should be visible over a 40 year timespan, above the noise we should expect to see in the observations due to sources of internal unforced variability such as ENSO? If so, then please give a reference to a paper or model output demonstrating this is the case. If not, then the reason we have not seen the clear accelleration is because of (i) the physics of climate suggest we shouldn't have seen it yet and/or (ii) there is so much noise in the observations it may be there but is obscured by the noise so we can't reliably/unequivocally detect it. -
ClimateWatcher at 03:38 AM on 6 January 2012A Big Picture Look at Global Warming
5. John Russel the GISP record is regional not global, but it does indicate a fair number of temperature spikes: "http://upload.wikimedia.org/wikipedia/commons/5/57/Greenland_Gisp2_Temperature.svg"Response:[DB] Your reference is to local/regional data and is thus off-topic for a global thread such as this one. Please keep in mind the nature of the OP.
-
ClimateWatcher at 03:26 AM on 6 January 2012A Big Picture Look at Global Warming
1. Dana wrote "comparing current warming rates to future projected warming rates." One cannot use future projections to validate future projections. If temperature trends are to reach the future projected trends, they must accelerate. That could still happen, but instead, for the last eleven years, warming trends have decelerated.Response:[DB] "for the last eleven years, warming trends have decelerated"
The point is without statistical merit and amounts to being specious and argumentative.
-
Rob Honeycutt at 03:24 AM on 6 January 2012Science and Distortion - Stephen Schneider
Stephen... Thanks a ton for stopping in to comment. Everyone really likes the video. It's a wonderful tribute to Stephen Schneider and reminds us all of what a great loss his passing was. With respect to the critiques, pretty much everyone here is heavily invested in learning how to effectively communicate climate science. Most of us spend many too many hours on other sites trying to battle people's misinterpretations and misrepresentations of climate science. We are, as Schneider puts it, trying to "take back the airwaves" from those who wish to cause confusion. One of the key points that John Cook discovered was a study showing that sometimes repeating a myth in the course of debunking it can actually reinforce that myth. That's where the concern about the CO2isGreen ad comes in. You're right, the video you created was targeted at a more sophisticated audience who understands the science. For a newbie the video has the potential to actually lodge the myth into a person's mind and make it harder to replace the myth with accurate information. My own interpretation is that the CO2isGreen ad ends up looking like a modern version of the 1960's cigarette ad. And ultimately history will see it exactly that way. In the meantime there are several great take home messages in Schneider's talk that inspire us all. Your video does a great job of capturing that in a compelling and digestible format. -
Tristan at 02:49 AM on 6 January 2012Models are unreliable
The past 40ish years appears to have a fairly straight 0.016C/yr trend. There seems to be little indication of increased warming. Even when exogenous factors are removed, the signal doesn't seem to show any acceleration. Given that we're expected to hit +2C well before 2087 under BAU conditions: A) Why is it taking so long for the positive feedbacks to reveal themselves in the temperature record. B) How long will it be before the rate of change is 0.020 or 0.025C/yr? Ca) If emissions continue at ~BAU and short-term CS is >2.5C (which would result in a visible increase in warming), doesn't it follow that there is a very high chance that the next decade will contain one or more years that are dramatically hotter than '98/05/10? Cb) Isn't that really ****ing bad? -
Bob Lacatena at 02:11 AM on 6 January 2012Science and Distortion - Stephen Schneider
45, Stephen, Thanks for providing the video. Overall I think most people love it (which is why it was posted here). The general complaint only focuses around the fact, I think, that the "CO2 is plant food" advertisement runs for so long that one forgets that it is an example of malicious advertising and not actually part of the case being made. But the video is very well done and gratefully welcomed. By the way, you might choose to click on your name at the left just below the thermometer (where it says "You are logged in as stephenthomson"), click "Update Profile" and add your website. This will let users get to your website by clicking on your name in any comment. -
CBDunkerson at 01:39 AM on 6 January 2012Quantifying Extreme Heat Events
actually thoughtful, and if deniers do use that approach (i.e. 'not one shred of evidence linking CO2 to increased heat') the response should be that it is a flat out lie... the equivalent of claiming that just because you put a hot dog on a lit barbecue grill and it has now been cooked on one side with vertical stripes corresponding to the grill frame that does not mean that the grill had anything to do with the hot dog becoming cooked. Some magical unknown force could have been shielding the hot dog from the grill heat while another magical force (cosmic rays in your example) came in and cooked the hot dog in exactly the same way that the grill would have. As you know, there is overwhelming evidence (rather than 'not one shred') that CO2 is responsible for this warming... to the same level as the grill and hot dog example. I've found that people tend to understand how global warming 'fingerprints' tie it back to CO2 better when presented with this sort of 'heating food' analogy. Just as the grill has observable heating patterns on the hot dog so too does CO2 have specific global warming patterns that differ from cosmic rays, solar, and other warming sources. Given that the observed warming matches both the degree and patterns we would expect from CO2 and does NOT match any other known source the efforts of 'skeptics' to claim 'something else' is responsible have drifted into the realm of denying observed reality. -
stephenthomson at 01:10 AM on 6 January 2012Science and Distortion - Stephen Schneider
Dear SKS community, I wanted to thank you for posting my video and for your feedback and critique. Some of you may think this video hurts the cause, and i'm a little surprised about that; after all, I don't feel i've obscured Stephen Schneider's message; it was his oratory that originally spoke volumes to inspire me, and which I trust will speak volumes to the general public (whom I do believe, contrary to some of you, are smarter than a bar of clay). I understand that it may not follow the debunking bible to a t, but then it wasn't necessarily made for denialists or for debunking. It was my intention simply to shed more light on an inspiring man for an audience normally unwilling to sit through hour-long lectures (and SS himself knew the importance of multiple formats of conveyance). I also happen to believe that no matter which side or set of information is being used to proselytize, 'force-feeding' sometimes doesn't go over all that well. Schneider's monologue was one of repose and of ominous calm, and it was that tone I attempted to garnish without obstructing; hence, no volley between myth and busting. Time will tell if my attempt here was successful or not in furthering environmentalism and attention to climate policy. I respect this community for taking on the denialists head on, and I hope all our work does some good. cheers stephen -
neilrieck at 00:12 AM on 6 January 2012CO2 is plant food? If only it were so simple
I believe this quote:"considering that 90% of a plant’s water use is actually for cooling of the leaves and nothing more"
is not correct so I will search for peer reviewed literature to back up my statement. Remember that plants are solar-powered. (Simplified chart: photosynthesis-chloroplast.jpg ) The first stage of photosynthesis involves the photolysis of water which produces three things: a free electron to power chemical reactions via ATP, O2 which is discarded (this is the only place where oxygen is released), and a charged hydrogen atom. People wishing to "quickly" learn more about the details of photosynthesis should start with these videos: http://www.khanacademy.org/video/photosynthesis Now it is true that plants lose water through their stoma, but as temperature rises, the stoma begin to close and photosynthesis is reduced. (most c3 plants are are 100% open at 24.4C and 100% closed at 30C). If the primary purpose of water was cooling, the plants would release it all to save themselves. In fact, they close off their stomas to limit water loss because water will be needed (photolysis) as soon as the temperature drops and the stomas open. -
John Brookes at 22:40 PM on 5 January 2012Myth of the Mini Ice Age
Interesting stuff Tom Curtis. I think that changes to land use are often ignored in the popular understanding of global warming, with all the emphasis given to industrial emissions. -
John Russell at 22:17 PM on 5 January 2012A Big Picture Look at Global Warming
@Climate watcher #1 I think the problem is one of thinking in human time scales. As I understand it, speaking geologically, a temperature rise equivalent to 15degreesC in just 1,000 years is very rapid. According to the IPCC "although large climate changes have occurred in the past, there is no evidence that these took place at a faster rate than present warming". (IPCC FAQ 6.2) -
Dikran Marsupial at 22:14 PM on 5 January 2012Models are unreliable
mace Please avoid starting up a new discussion without first properly disengaging from another. You made an ill-informed comment here, which several contributors (including myself) took the time to address. It is rather rude to pose questions and the ignore the answers, so please go back to that thread and either acknowledge that you were mistaken or explain why the answers provided are not sufficient. Why should anybody bother respond to your posts if you appear to be ignoring those responses? -
Doug Hutcheson at 21:07 PM on 5 January 2012Science and Distortion - Stephen Schneider
Tom@20 "Humans also adapt, and much faster so that a thousand years from now even in the worst case of the reasonably probable scenarios global warming will have little impact on the standard of living." You have a rosier future view than I do. Assuming we continue on our current trajectory, and I see no evidence of a likelihood that we will change soon or much, are we not looking at millennial changes? Melting poles, increased desertification, mass extinctions, population collapse, sea level rise and associated human migrations, with concomitant wars ... need I go on? When our high-tech, greed-fuelled society hits AGW reality, I cannot imagine the results will be business as usual. Standards of living must surely fall and I have little hope that quality of life will be anything like what we enjoy now. So, what is your projection based on? Please tell me why I am being pessimistic - I could do with the reassurance. -
Tom Curtis at 20:08 PM on 5 January 2012Myth of the Mini Ice Age
skept.fr 16, assuming 260 ppmv and a climate sensitivity of 3 per doubling of CO2 for fast feedbacks, adding 30 ppmv would increase temperature by 0.5 degrees C. With slow feedbacks, ie, the release of additional CO2 due to the extra warmth and and reduced ice shelves that would increase to 0.6 degrees C, or possibly a bit more. That means that with constant CO2, the temperature decrease from the Holocene Climactic Optimum would have been 30 to 60% larger. -
Rob Painting at 20:06 PM on 5 January 2012Myth of the Mini Ice Age
boba10960 @ 15 - I've seen a recent paper abstract that suggests the growth of coral added perhaps as much as 26ppm of CO2 to the atmosphere since the last glacial maximum. I'm going to see if I can get hold of a copy from one of the authors (haven't found a free copy online) - as it relates to a few articles I'm writing. -
Tom Curtis at 19:59 PM on 5 January 2012Myth of the Mini Ice Age
boba10960 @15, thanks, I missed that. You are correct. Michael Sweet @14, thanks also for the link. -
skept.fr at 19:55 PM on 5 January 2012Myth of the Mini Ice Age
#13 Tom : OK, I better understand your view, I agree that "unsettled science" is a better way to describe the question of Holocene duration. What puzzles me (as with the michael #14 link) is the temperature effect of pre-industrial GHGs emissions (from clearance and agriculture). I've not the formula in mind, what would be the sensitivity for adding, say, 30 ppmv CO2 since the middle Holocene? -
boba10960 at 19:42 PM on 5 January 2012Myth of the Mini Ice Age
Tom @11 Actually, Ridgwell does address the Holocene rise in CO2. His Figure 2a shows that the period of greatest regrowth of coral reefs was in the early Holocene. His Fig 2b shows that the modelled impact on atmospheric CO2 is consistent with the Holocene rise after 7000 BP. As stated in the first sentence of his conclusions: "we find that the buildup of coral reefs and other forms of shallow water carbonate deposition, rather than changes occurring in the terrestrial biosphere is the more likely underlying cause of the observed rising trend in atmospheric CO2 during the late Holocene." I'm not contending that humans had no role at all; only pointing out that a case can be made that regrowth of coral reefs and burial of other forms of calcium carbonate on continental shelves may have contributed significantly to the Holocene rise in CO2. -
owl905 at 14:54 PM on 5 January 2012A Big Picture Look at Global Warming
@Moderator - there was no frustration. Climatewatcher got the same respect from me that he gave the science. -
michael sweet at 13:44 PM on 5 January 2012Myth of the Mini Ice Age
Tom and Skept: Last April Real Climate posted this review of the latest data on the influence of pre-industrial humans on climate. It says that there is still some discussion by experts, but most scientists find the explanation of human carbon dioxide starting about 7,000 (!!) years ago as fitting the data best. Interested readers should look at the linked article. It is possible that the stable climate of the last 7,000 years was a fluke caused by human emissions of just the right amount of CO2. -
Tom Curtis at 12:21 PM on 5 January 2012Myth of the Mini Ice Age
skept.fr @12, the eccentricity cycle and obliquity cycles of stage 11 (400 thousand years ago) and stage 1 (the last 10 thousand years) are differently synchronized. The result is that if you align the periods based on their start dates, ie, the end of the previous glacial, the pattern of insolation in the NH is misaligned. On the other hand, if align them based on the pattern of NH insolation, as shown in the second figure @11 above, then we are approaching the time equivalent to the start of the glacial following stage 11 400,000 years ago. Therefore, the crucial question is not the future expected evolution of NH insolation, but the approximately 20 W/m^2 difference in summer insolation at 65 N as shown in that diagram. If it were not for that 20 W/m^2 we would have a strong expectation of having entered an ice age recently. As you point out, Berger and Loutre provide an answer to the question as to whether the that 20 W/m^2 makes a difference. Their very clear answer is that it does make a difference if the atmospheric CO2 concentration is 300 ppmv. Indeed, they say:"Most CO2 scenarios led to an exceptionally long interglacial from 5000 years before the present to 50,000 years from now (see the bottom panel of the figure), with the next glacial maximum in 100,000 years. Only for CO2 concentrations less than 220 ppmv was an early entrance into glaciation simulated."
(My emphasis) As can be seen in the diagram, with a CO2 concentration of 210 ppmv (red dotted line), the simulation does indeed show us entering a new glacial, which we do not leave for over 100 thousand years: (Also of interest is the red dashed line, showing 750 ppmv in which we loose all polar ice for very roughly 20 thousand years.)
So, the question of whether we would have entered an ice age but for the presence of humans resolves itself to the question, would CO2 concentrations have been currently below 220 ppmv (give or take) but for the presence of humans?
Well, we can examine this chart from Lüthi et al and find out some interesting things:
(Also of interest is the red dashed line, showing 750 ppmv in which we loose all polar ice for very roughly 20 thousand years.)
So, the question of whether we would have entered an ice age but for the presence of humans resolves itself to the question, would CO2 concentrations have been currently below 220 ppmv (give or take) but for the presence of humans?
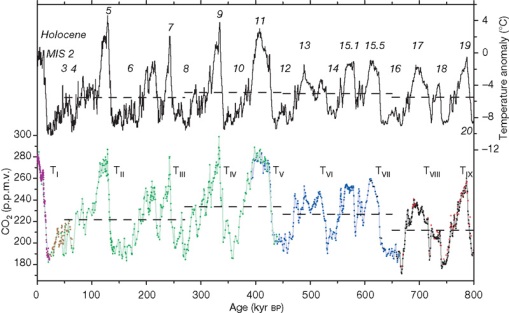
Well, we can examine this chart from Lüthi et al and find out some interesting things:
 I want to note three things:
1) During the interglacials following terminations Tvi, Tvii, and Tviii, CO2 concentrations where in range of 220 to 240 ppmv, so an atmospheric concentration of 220 ppmv is possible in an interglacial;
2) Though atmospheric concentrations of CO2 as high as 300 ppmv have been found in previous interglacials, it has certainly not been for the entire interglacial, and in all previous interglacials, CO2 concentrations have followed temperatures; and
3) This is also true in the interglacial following termination Tv (stage 11), in which temperatures continued to rise after the end of the glacial, peaking in the middle of the glacial before falling away, with CO2 concentrations following the same pattern. That is indeed what we would have expected given the information we have about NH insolation during stage 11.
In stark contrast to stage 11, however, temperatures have not risen since the termination of the glaciation. Rather, they have fallen from the Holocence Climactic Optimum by between 1 and 2 degrees C. Despite this, CO2 levels have not fallen as we would have expected, but risen faster than they have in any other interglacial. It follows that stage 11 is not a counterexample to the claim that CO2 levels have risen throughout the Holocene due to human activity.
It is known that CO2 levels will rise or fall by about 12 ppmv per 1 degree C change in mean global temperature. That may be an underestimate, in that over the last two thousand years the ratio has been closer to 15 ppmv per degree C change in global temperature if recent reconstructions are to be believed. In any event, absent the presence of humanity, we would have expected CO2 levels to have fallen by 24 to 30 ppmv from the Holocene Climactic Optimum levels of 260 ppmv (assuming the most generally accepted temperature differential of 2 degrees C). That reduction in CO2 would have led to a further reduction in CO2, reducing CO2 levels by a approximately 10 ppmv, with a final current level in this scenario of 220 to 226 ppmv.
Given this, we cannot say with any certainty that we would not be entering an Ice Age where it not for human activity. As Boba10960 points out, neither can we say with any certainty that we would. If Hansen is right about Holocene Climactic Optimum temperatures, pre-industrial CO2 levels absent human activity would be in the 240 to 250 ppmv range, with a comfortable buffer against a new glaciation. Further, it is not certain that human activity is responsible for the additional CO2 entering the atmosphere, although the sharp contrast between this inter-glacial and previous inter-glacials is suggestive.
The point is "that GHGs prevent us from entering to the next glacial period" is unsettled science. It is not a myth, contrary to your claim at 6.
I want to note three things:
1) During the interglacials following terminations Tvi, Tvii, and Tviii, CO2 concentrations where in range of 220 to 240 ppmv, so an atmospheric concentration of 220 ppmv is possible in an interglacial;
2) Though atmospheric concentrations of CO2 as high as 300 ppmv have been found in previous interglacials, it has certainly not been for the entire interglacial, and in all previous interglacials, CO2 concentrations have followed temperatures; and
3) This is also true in the interglacial following termination Tv (stage 11), in which temperatures continued to rise after the end of the glacial, peaking in the middle of the glacial before falling away, with CO2 concentrations following the same pattern. That is indeed what we would have expected given the information we have about NH insolation during stage 11.
In stark contrast to stage 11, however, temperatures have not risen since the termination of the glaciation. Rather, they have fallen from the Holocence Climactic Optimum by between 1 and 2 degrees C. Despite this, CO2 levels have not fallen as we would have expected, but risen faster than they have in any other interglacial. It follows that stage 11 is not a counterexample to the claim that CO2 levels have risen throughout the Holocene due to human activity.
It is known that CO2 levels will rise or fall by about 12 ppmv per 1 degree C change in mean global temperature. That may be an underestimate, in that over the last two thousand years the ratio has been closer to 15 ppmv per degree C change in global temperature if recent reconstructions are to be believed. In any event, absent the presence of humanity, we would have expected CO2 levels to have fallen by 24 to 30 ppmv from the Holocene Climactic Optimum levels of 260 ppmv (assuming the most generally accepted temperature differential of 2 degrees C). That reduction in CO2 would have led to a further reduction in CO2, reducing CO2 levels by a approximately 10 ppmv, with a final current level in this scenario of 220 to 226 ppmv.
Given this, we cannot say with any certainty that we would not be entering an Ice Age where it not for human activity. As Boba10960 points out, neither can we say with any certainty that we would. If Hansen is right about Holocene Climactic Optimum temperatures, pre-industrial CO2 levels absent human activity would be in the 240 to 250 ppmv range, with a comfortable buffer against a new glaciation. Further, it is not certain that human activity is responsible for the additional CO2 entering the atmosphere, although the sharp contrast between this inter-glacial and previous inter-glacials is suggestive.
The point is "that GHGs prevent us from entering to the next glacial period" is unsettled science. It is not a myth, contrary to your claim at 6.
-
owl905 at 10:56 AM on 5 January 2012A Big Picture Look at Global Warming
Geez, the troll patrol really sent out a flopper this time. The 'scenarios' aren't ranges, they're forcing expectations under different pollution conditions. There is no "CRU", there is a HADCRUT3 - and leaving out the polar regions is warning bell 1 for troll alert. Warning bell 2 is the "since Jan 2001". The pathos here is that it's not "since Jan 2001", it's 'since 2001' - which is a hoodwink to take advantage of the anomaly temperature peak in Dec 2001. Using a combined set with the rotten cherry-pick produces a flatline - only because of two double-dip La Nina's in the latter half of the decade: http://www.woodfortrees.org/plot/hadcrut3gl/from:2000/plot/hadcrut3gl/from:2000/trend [inflammatory snipped]Moderator Response: [Rob P] - try to keep it civil thanks. We understand the frustration, but this is not the blog for venting. -
skept.fr at 09:52 AM on 5 January 2012Myth of the Mini Ice Age
#8 Tom : as I understand Berger et Loutre 2002, the main point is that "Over the next 100,000 years, the amplitude of insolation variations will be small, much smaller than during the Eemian. For example, at 65°N in June, insolation will vary by less than 25 Wm−2 over the next 25,000 years, compared with 110 Wm−2 between 125,000 and 115,000 years ago." The better analog for our present interglacial (from a solar orbital forcing comparison) is the MIS-11, which lasted longer than other glacial periods. For the CO2 forcing at pre-industrial level, your point is not clear for me. For example, Lüthi et al 2008 showed some concentrations of 270-300 ppmv in past interglacials. -
Tom Curtis at 09:25 AM on 5 January 2012Models are unreliable
mace @452, the satellite observations in the picture are for sea levels, not temperatures. -
Rob Honeycutt at 08:59 AM on 5 January 2012Models are unreliable
I noticed that the link to Tamino's graphic in the "further reading" box is broken.Moderator Response: [DB] Fixed link. -
Tom Curtis at 08:53 AM on 5 January 2012Myth of the Mini Ice Age
boba 10960 @10, the Ridgwell 2003 addresses the rapid rise in CO2 levels from 17 thousand to 11 thousand years before the present, and hence is not germane to the rise in CO2 levels during the Holocene. Broecker and Stocker 2006 is interesting. It is noteworthy, however, that CO2 levels rose significantly faster in the Holocene than in their chosen comparison of period of the Milankovitch stage 11 (approx 410,000 years ago). What is more, the Holocene increase in CO2 levels is set against a backdrop of cooling global temperatures, while the equivalent period in the comparison with stage eleven is for warming global temperatures. Bill Ruddiman points out an even greater disanalogy. Whereas in the Holocene northern insolation peaked 11 thousand years ago, and have been declining since, in stage 11 they continued to rise strongly until the equivalent of 2,000 years ago (in the comparison) so that the standard comparison compares a NH peak in insolation to the current trough in order to prove that an Ice Age could not have commenced recently without the influence of humans. Given the very large known deforestation by humans in the pre-industrial era, not the mention the artificial expansion of swamp lands in Asia due to rice cultivation, it is certain that pre-industrial humans had some effect on CO2 levels, and likely that they contributed at least half of the rise in CO2 over the last 7,000 years.
I will certainly concede that it is controversial whether they contributed more than that. However, that they contributed enough to prevent the onset of a new ice age remains possible on available evidence (SFAIK). Hence it is not a "myth" as claimed by skept.fr @6. Nor of course, is it certain, but I have never claimed otherwise.
Given the very large known deforestation by humans in the pre-industrial era, not the mention the artificial expansion of swamp lands in Asia due to rice cultivation, it is certain that pre-industrial humans had some effect on CO2 levels, and likely that they contributed at least half of the rise in CO2 over the last 7,000 years.
I will certainly concede that it is controversial whether they contributed more than that. However, that they contributed enough to prevent the onset of a new ice age remains possible on available evidence (SFAIK). Hence it is not a "myth" as claimed by skept.fr @6. Nor of course, is it certain, but I have never claimed otherwise.
-
mace at 08:09 AM on 5 January 2012Models are unreliable
Any ideas where the satellite data shown in the main picture comes from? It doesn't seem to match any data that I'm aware of.Response:[DB] "Any ideas where the satellite data shown in the main picture comes from?"
Did you read the linked source?
-
boba10960 at 08:05 AM on 5 January 2012Myth of the Mini Ice Age
Excellent video! A short comment for Tom Curtis @8: Note that the hypothesis that human activities influenced the rise of atmospheric CO2 after 7500 BP is highly controversial. For a rebuttal see Broecker and Stocker 2006 An alternative hypothesis for the rise in CO2 after 7500 BP is the regrowth of coral reefs following the end of the last ice age Ridgwell et al., 2003. Growth of corals and other organisms that generate calcium carbonate shifts the acid-base balance of seawater which, in turn, releases CO2 from dissolved inorganic carbon. -
Chris G at 07:08 AM on 5 January 2012A Big Picture Look at Global Warming
CW, For your IPCC references, could you tell use what the context is for 'high' and 'low'? I'm thinking there are scenarios for high and low emissions paths, and maybe high and low climate sensitivities, but I'm not sure I've heard of any 'rapid' versus 'slow' warming scenarios, strictly speaking. What I'm saying is that you are comparing apples and oranges. If you examine the all the rates of change over the earth's history, would the rate of change since the industrial revolution began fall near the upper end of that range, or the lower? Aside from some other candidates like major impact events or super-volcano eruptions, I'm pretty sure the current rate is very near the upper limit of the range. Any reason you choose CRU rather than GIS or BEST? I was kind of under the impression skeptics did not trust the results from that unit, given the controversy surrounding Dr. Jones and all. Dana, Thanks! I had a thought though that what really matters is ice mass or ice volume. So, rather than say southern sea ice extent growth is more than eclipsed by northern ice extent loss, you could say that both are loosing mass at an accelerating rate. I understand that isn't a simple comparison though because mass loss for Antarctica and Greenland is measured with gravity satellites (GRACE) and it is harder to measure Arctic sea ice volume than it is extent. However, losses in both hemispheres is a simpler message.Response:[dana1981] Good point - text revised to reference Arctic sea ice volume and Antarctic ice mass declines.
As I noted in response to CW's comment, he is comparing future projected temperature changes to past/current temperature changes. As you note, it's an apples to oranges comparison. Showing that the planet isn't yet warming as fast as we expect it to in the future most certainly doesn't demonstrate that the warming thus far isn't rapid. It's just expected to become more rapid in the forthcoming decades.
-
ClimateWatcher at 06:34 AM on 5 January 2012A Big Picture Look at Global Warming
...the planet is not "rapidly warming," although "rapid" is a highly subjective term, which they have failed to define. Per IPCC: Best estimate for a 'high scenario' is 4.0 °C per century Best estimate for a 'low scenario' is 1.8 °C per century Actual trend for CRU since Jan 1979 is 1.5 °C per century. Per IPCC: A temperature rise of about 0.2 °C per decade is projected for the next two decades for all SRES scenarios. Actual trend for CRU since Jan 2001 is -0.05 °C per decade (cooling). By the objective measure of the longer term trend, the planet is not "rapidly warming" but is "slowly warming".Moderator Response: [Rob P] You seem to not understand the 'big picture.' Note figure 1 - labeled - Change in Earth's total heat content. Since 2001 that has increased substantially - as we would expect given our understanding of physics. See also: There has been a massive increase in ocean heat content since 2001. The ocean heat content will likely decline temporarily if we have another large El Nino or sequence of El Nino. La Nina is when the ocean actually gains heat, and since we have been in a largely La Nina dominated period since 2005-2006, it's little wonder global surface temperatures have not changed much. If we see a change to an El Nino-dominant period, we're going to get warming of global surface temperatures quick smart.
[dana1981] You have committed two errors in this comment, (1) cherrypicking (both the data set and the timeframe - see Figure 2 above regarding the latter), and (2) comparing current warming rates to future projected warming rates. Thus you have not justified your (incorrect) conclusion. At best your argument is that the planet is warming more slowly than expected (although even that point is incorrect), but this would not prove that the planet is not warming rapidly.
There has been a massive increase in ocean heat content since 2001. The ocean heat content will likely decline temporarily if we have another large El Nino or sequence of El Nino. La Nina is when the ocean actually gains heat, and since we have been in a largely La Nina dominated period since 2005-2006, it's little wonder global surface temperatures have not changed much. If we see a change to an El Nino-dominant period, we're going to get warming of global surface temperatures quick smart.
[dana1981] You have committed two errors in this comment, (1) cherrypicking (both the data set and the timeframe - see Figure 2 above regarding the latter), and (2) comparing current warming rates to future projected warming rates. Thus you have not justified your (incorrect) conclusion. At best your argument is that the planet is warming more slowly than expected (although even that point is incorrect), but this would not prove that the planet is not warming rapidly. -
John Russell at 06:14 AM on 5 January 2012Science and Distortion - Stephen Schneider
@Tom #40 You're quite right with everything you said after "What should be recognized...". You know it; I know it; and so will everyone who arrives at this point in this website. However... The point that climatehawk1 was making -- and he's dead right -- is that a large majority of the population (I'm guessing over 70%) will not understand a word of what you said in the remainder of your comment. All they hear is '4 watts' and think 'that's not much'. And these are the people we need to get to. The denial community is way ahead of us when it comes to influencing 'the man in the street'. -
Rob Honeycutt at 04:03 AM on 5 January 2012Science and Distortion - Stephen Schneider
Well, put Tom (@41). The point that needs to be made, and I think rarely does (and what I love about what Schneider is saying), is that the act of giving equal time to two sides of the debate distorts the perception of the reality of climate science. In fact, it's worse than that. You rarely ever see the "screaming hairy conniption fit" (Richard Alley's term) AGW side of the story, whereas you DO almost constantly get the "screaming hairy conniption fit" on the denier side. Even from main stream "skeptics" you get this. Never mind folks like Monckton, just reading Richard Lindzen's NYT OpEd this past year the term that pops into your head is "wow, what a screaming hairy conniption fit he's on!" What you get from the actual climate science community is generally very careful nuanced responses that do little to counteract the conniptions on the other side. The actual debate in climate science takes place within a fairly narrow range of potential forcing responses. But it sure is hard to sell main stream news on that kind of story.

Prev 1365 1366 1367 1368 1369 1370 1371 1372 1373 1374 1375 1376 1377 1378 1379 1380 Next


