


 Arguments


Recent Comments
Prev 1379 1380 1381 1382 1383 1384 1385 1386 1387 1388 1389 1390 1391 1392 1393 1394 Next
Comments 69301 to 69350:
-
Bob Lacatena at 16:08 PM on 27 November 2011Climategate 2.0: Denialists Serve Up Two-Year-Old Turkey
74, garythompson, I'd also suggest that he's probably more used to working with the actual numbers and a stats package and could care less himself about graphs. He deals with other (numerical) aspects of the data. He could well have other people create graphs for the people that need them. Graphs are for amateurs. He pretty much says this in his e-mail, when he says "This is a linear trend - least squares. This is how statisticians work out trends. They don't just look at the series. The simpler way is to just look at the data...". -
Bob Lacatena at 16:07 PM on 27 November 2011Climategate 2.0: Denialists Serve Up Two-Year-Old Turkey
74, garythompson, I've known tons of very high paid CEOs that also could not even start Excel, let alone create a graph... yet they do presentations for multi million dollar deals all the time. How do they do it? Oh, that's right, they have other people to handle the trivial details like creating graphs. They do the hard part, the thinking. Similarly, scientists have legions of grad students. Can many scientists do this? Yes, probably. Does it mean he's incompetent? Not remotely. Get off of your high horse. -
garythompson at 15:41 PM on 27 November 2011Climategate 2.0: Denialists Serve Up Two-Year-Old Turkey
I have 2 problems with email #1885. First, It shows Mr. Jones doesn't have a basic grasp of data analysis that should be routine for any scientist-let alone one that requires this type of analysis to prove his hypothesis. Forget about Excel, he says that he can't graph 2 columns of data and no one at the office knows how to do it either! Do they hire any scientists at CRU? According to the email he had someone do this for him in 2006. Again, he can't do it himself? Many people in the world can't do this type of work but they don't call themselves scientists. I can't hit top spin on a tennis ball but I am not a professional tennis player. A scientist who can't do this simple data analysis would be equivalent to a plumber who can't use a pipe wrench, an electrician who can't read wiring diagrams, an auto mechanic who can't change the oil in a car or an astronomer who can't understand the celestian coordinate system. Pretty simple stuff and Jones appears to lack it. Second, Jones makes claims about trends when he hasn't plotted the data and when he knows it is not statistically significant. He says the "trend is up" even though he also says the data isn't statistically significant and he hasn't plotted the data to verify this. So it is now ok to eyeball the data, come to conclusions based on prior bias and not worry about statistical significance? ok, got it. Think how the AGW team would feel if they realized these types of comments came from a prominent skeptic. How would you be reacting? (-Snip-)Response:[DB] First, as noted earlier, Dr. Jones expresses an unfamiliarity with Excel, laments that no one who is familiar with Excel is currently available there at that time, and then proceeds to walk his correspondent through the methodology on how to calculate significance.
Scientists have email corespondences like this all of the time, many more caustic. Those who hacked the servers to steal these emails who have then selectively released a cherry-picked, minute portion are counting on fake-skeptics to overlook that loss of context.
It doesn't say what you imply that it does. The skeptical thing to do would be to acknowledge that and get over it.
Second, Jones makes claims about trends when he hasn't plotted the data because he knows it is not statistically significant because the time series length is too short for any trend to rise to the level of significance (so no need to plot the data and then test for significance).
He says the "trend is up" even though he also says the data isn't statistically significant and he hasn't plotted the data to verify this, because he knows it is not statistically significant (as defined above). So in this case it is now ok to eyeball the data and say that the "trend is up" even though he also says the data isn't statistically significant. Because the time series length in question is too short.
And how does he know that a trend since 1998 is too short? Because he has already tested for significance in temperature trend time series analysis often enough to know that such a length of trend is far too short for it to be significant. Got it?
Third, your focus on "teams" is misplaced. Science is not performed by "teams" (or "tribes"). There is no "us versus them". There are scientists doing science. Period. Anything else is ideology.
Copy of stolen property snipped. A link to it would have been sufficient.
-
Karl_from_Wylie at 15:17 PM on 27 November 2011Memo to Climategate Hacker: Poor Nations Don't Want Your Kind of Help
bill @1 You say... I seriously doubt that concern for the poor is an actual motivation... The Comments Policy states.... "You may criticise a person's methods but not their motives."Response:[DB] Please cease with the Concern Trolling. Thank you.
-
Karl_from_Wylie at 15:11 PM on 27 November 2011Memo to Climategate Hacker: Poor Nations Don't Want Your Kind of Help
Paul D @2 "... politics in the US has taken a path for the worse, resulting in political trench warfare" Your comments are Political... "....I actually consider many AGW skeptics today to be modern luddites" AND ad hominem...... Both are against the Comments Policy Comments PolicyResponse:[DB] The relevant portions of the Comments Policy you refer to are:
- No politics. Rants about politics, ideology or one world governments will be deleted.
Paul D was fairly even-handed in his discussion of politics, so it cannot be construed as a rant.
- No ad hominem attacks. Attacking other users or anyone holding a different opinion to you is common in debates but gets us no closer to understanding the science. For example, comments containing the words 'religion' and 'conspiracy' tend to get deleted. Comments using labels like 'alarmist' and 'denier' are usually skating on thin ice.
Since Paul D is not addressing anyone specifically, but is referring to "many AGW skeptics" he is, at worst, "skating on thin ice" with his use of the word luddite:
1. One who fears technology (or new technology, as they seem pleased with how things currently are...why can't everything just be the same?)
2. A group led by Mr. Luddite durring the industrial revolution who beleived machines would cause workers wages to be decreased and ended up burning a number of factories in protestA luddite generally claims things were "just fine" back in the day, and refuses to replace/update failing equipment/software/computers on the basis that they were just fine 10 years ago. -
rockytom at 13:28 PM on 27 November 2011SkS public talks in Canada and AGU, San Francisco
Hi John, It's interesting that you will be joining Callan Bentley from NOVA. I taught a geology course at the Annandale campus there in 1980 or '81. I don't know Callan personally but have been following his blog. I'm especially interested in his geology photos. Best of luck on your talks and seminars. My wife and I had a great trip to Vancouver Island and Victoria a few years ago. Be sure and see the butterflies. Tom -
Doug Hutcheson at 13:14 PM on 27 November 2011SkS public talks in Canada and AGU, San Francisco
That's great, John. Let's hope you all get plenty of positive publicity. (If not, I guess you will know how to correct it - grin.) -
skywatcher at 12:23 PM on 27 November 2011Climategate 2.0: Denialists Serve Up Two-Year-Old Turkey
#72, it's also interesting that you demonstrate your own ignorance on the subject, taking interpretations from the self-confessed "Interpreter of Interpretations", Delingpole. If you follow the link back to the source, you'll see that Jones was explaining how to do a simple plot and least-squares regression in Excel, but cannot be faffed to do it at that monent (hence the keyword "now"). That he claims modesty on the speed of his computer skills is nothing new - many brilliant people do exactly the same thing, but only a fool would take that completely literally. He was complaining about a junk article by David Whitehouse, who clearly has no idea about how to determine if global warming has stopped, and provided a nice explanation for the guy who answered the question. If Jones couldn't work a spreadsheet, why is it that the second quoted paragraph is a perfectly reasonable explanation of how to plot and do a simple LS regression in Excel? Or do you just swallow whole every bit of misinformation from "the Interpreter of Interpretations"? -
garythompson at 12:03 PM on 27 November 2011Climategate 2.0: Denialists Serve Up Two-Year-Old Turkey
Does anyone else find it odd that Phil Jones doesn't know how to plot data in Excel? Or more importantly, how he makes claimes about trends without doing the plotting and while knowingly stating that the data is statistically insignificant? Sounds odd. It's in email #1885 and here is a link. http://blogs.telegraph.co.uk/news/jamesdelingpole/100119495/climategate-2-0-the-not-nice-and-clueless-phil-jones/#disqus_threadResponse:[DB] "Does anyone else find it odd that Phil Jones doesn't know how to plot data in Excel?"
Many scientists do not, as Excel isn't the best platform for their work (R, or one of several other packages, are better suited for their work).
"while knowingly stating that the data is statistically insignificant?"
PRATT. Jones knows it's statistically insignificant because the time series length is too short for the trend to have risen to the typical level of significance.
Please show the original email in its context, not Delingpole's odd-sounding, served-up-on-a-platter, version.
That's what a real skeptic would do.
-
pauls at 11:09 AM on 27 November 2011Schmittner et al. (2011) on Climate Sensitivity - the Good, the Bad, and the Ugly
Tom Curtis In general, climate change occurs faster over land than at sea, but that is because of the large thermal inertia of the oceans. Over long time spans, the temperature change should equalize. Sutton et al. (2007) is a model study which finds that the land-ocean warming contrast is a robust feature of equilibrium warming as well as transient. To me this suggests equalisation wouldn't be expected. There's supposedly a more detailed follow-up paper on the land-ocean equilibrium response due this year - Dong, B.-W., R. T. Sutton, and J. M. Gregory, 2011: Understanding land-sea warming contrast in response to increasing greenhouse gases. Part II: Equilibrium response (in preparation) -
John Hartz at 10:49 AM on 27 November 2011Climategate 2.0: Denialists Serve Up Two-Year-Old Turkey
@Mikel #70: If someone reading this comment thread knows of such a site, he/she will likely post it. In the meantime, I suggest that you engage in some serious surfing of the web on your own. -
adelady at 10:45 AM on 27 November 2011The Debunking Handbook Part 4: The Worldview Backfire Effect
Steve, tactic or tactful? I wouldn't describe tact as dishonest though many tactics could be. The big thing to remember always is that approaches within tertiary education, not just the hard sciences, tend to be robust ... to put it politely. otoh, I work with students who have various learning problems - very few of them have any intellectual difficulty - just a bad history of inappropriate teaching added to a simple visual or aural processing problem, sometimes short-term memory issues. The big thing is that a 'robust' approach is exactly opposite to what they usually need. And it is not dishonest to tell such a student that the fraction calculation they've done is 'clever!', even though standard testing tells you that they're 4 years behind in maths. It is clever - they just never had the chance to show it previously. When such students change their 'behind' measure by 2 or 3 years within 6 to 12 months, it's glaringly obvious that cleverness is not a problem, the teaching is. We tell ourselves that we're the realist, clear thinkers on scientific issues. But we can be unrealistic, muzzy thinkers about those we see as uninformed, misled or poor thinkers. Many teaching moments are missed if we give a standard scornful, oh, come on! keep up! response to someone who's clearly out of their depth. SkS is actually one of the best blogs at finding a responder who will make the most of a teaching moment. It's not dishonest to always treat people who come across as aggressive or dishonest themselves as though they are looking for information or support. Parents among us can recognise the stroppiness of toddlers or teenagers as cover for confusion or distress. And those of us who've worked with the general public have often encountered adults who are in the same boat. And seen our ham-handed colleagues make bad situations worse by focusing on the attitude rather than the problem. And we must keep in mind what we're asking. To be a realist about what's happening with climate, you have to stare into the horrifying abyss. And then you must take a deep breath and get on with your work, family and social life. Finding ways to tell people that it really is as near to catastrophic as dammit is to swearing - that we can avoid the very worst of it - but a lot of people will die anyway ... not the rosiest of teaching moments. -
muoncounter at 08:02 AM on 27 November 2011Schmittner et al. (2011) on Climate Sensitivity - the Good, the Bad, and the Ugly
Here are the figures from Schmittner et al showing both their data sources and model. Note the paucity of land data and the significant differences between data and model: None of the warmish areas in the northern hemisphere that appear in the data are in the model; the Med isn't cold enough; the equatorial and tropical Pacific isn't warm enough.
If your model truncates the high and low extrema in your data volume, is it any wonder that sensitivity appears lower?
Note the paucity of land data and the significant differences between data and model: None of the warmish areas in the northern hemisphere that appear in the data are in the model; the Med isn't cold enough; the equatorial and tropical Pacific isn't warm enough.
If your model truncates the high and low extrema in your data volume, is it any wonder that sensitivity appears lower?
-
Tom Curtis at 08:01 AM on 27 November 2011Schmittner et al. (2011) on Climate Sensitivity - the Good, the Bad, and the Ugly
Andy S @11, if we had precise knowledge and could measure the climate sensitivity exactly under a variety of conditions (GMST, continential positions, etc) we would find it varies slightly depending on those conditions. If we plotted all those variation, we would be plotting the probability density function (PDF) of the sensitivity. If the PDF of the sensitivity showed a distinct peak with little variance, that would give us great confidence that the sensitivity measured from the LGM or the Paleocene-Eocene Thermal Maximum would be a good predictor of the climate sensitivity over the next century or so. If the PDF of the sensitivity showed multiple peaks and/or substantial variance, we would have less confidence. In contrast, the probabilistic estimate of the sensitivity is the probability that the sensitivity has a particular value given a range of measurements. In this case we know that the climate sensitivity at the LGM had a unique value. We do not know what that value is, but we know there is a high probability that it lies withing a particular range. Because the climate sensitivity at the LGM over land and over sea should be very close to each other (my point @1 and @12), we know that the climate sensitivity should lie somewhere in the overlap of the two land and ocean PDF functions as James Annan says. As it happens Schmittner et al gave the land PDF very little weight in their estimate which means their land plus ocean estimate, while lying within the overlap, is heavily biased towards the ocean estimate. My argument @1 is that there are good reasons to give the land PDF much more weight. The multiple peaks in the PDF is a consequence of Schmittner et al's method of comparing models with sensitivities to their reconstructed temperatures. It is not noise, but probably not very significant either given that they used only one basic model. If multiple models showed the same pattern, it probably would be significant. -
Tom Curtis at 07:42 AM on 27 November 2011Schmittner et al. (2011) on Climate Sensitivity - the Good, the Bad, and the Ugly
muoncounter @8 and skept.fr@7, when I said that "the temperature change should equalize" I did not mean that temperature changes in different latitude bands would be equal, or indeed that their should be the same temperature change within a given latitude band for all seas and land surfaces. Obviously there will be regional variations based on changes in circulation and in changes in land cover. Because these factors do change, we would only expect that " Land temperatures ... should fluctuate about a mean that is close to sea surface temperatures." Close, but not identical. Further, as a point of clarification, this should apply to zonal means rather than to the global mean. Indeed, it will not apply to the global means because of the different zonal distribution of ocean and land surfaces. That we should expect this effect, however, is seen by considering two hypothetical examples, a desert world (no oceans), and an oceanic world (no land). For the thought experiment, assume feedbacks are identical in both. IN that case, doubling CO2 in both will lead to approximately equal increases in GMST because the increase in GMST is determined by the value needed to establish equilibrium in the TOA energy equation. There will be slight differences in the final outcome depending on differences in heat transfer from equator to poles. The main difference will be that while the land only world will reach the equilibrium temperature in a few years, the ocean only world will take a few centuries. In the real world, as noted we will expect slight differences in zonal mean changes in temperature between land and sea. However, those differences will be less than the differences in regional changes in temperature due to changing currents, winds and land cover. With regard to Schmittner et al's figure 1 (the figure three in the caption is a typo), I would regard it as supporting my argument rather than rebutting it. The relevant points are: 1) There observational data shows an increase (!?!) in sea surface temperatures north of Iceland. As the area north of Iceland was almost certainly covered with perennial sea ice, the apparent increase in temperature would indicate that the proxy is measuring under ice temperatures rather than surface temperatures, as per my hypothesis; 2) In the model, in all areas not associated with significant sea ice during the LGM, land temperatures are withing 1 degree of SST temperatures; and in contrast 3) In the model, in areas associated with sea ice land temperatures are significantly colder (up to 4 degrees) than are sea surface temperatures. Please note that this is very much what my explanation predicts. For a true check using models, however, we would need to check out a hot example, where my explanation would predict land temperatures lying withing a degree of sea temperatures in the same zone over the entire globe. -
Mikel at 07:36 AM on 27 November 2011Climategate 2.0: Denialists Serve Up Two-Year-Old Turkey
69 John Hartz SkS provided a very good series of articles about twelve months ago reviewing the furore over the CRU emails, including an article on FOI requests. I was hoping SkS or others viewing this site might know of some other site that looked at the legal issues arising from the release of the CRU emails. I am not expecting SkS to provide a forum but I was asked to set out what I consider to be some of the legal issues. -
John Hartz at 07:24 AM on 27 November 2011Climategate 2.0: Denialists Serve Up Two-Year-Old Turkey
@Mikel #68: Why whould SkS provide a forum to discuss the "legal" issues that you have raised? -
Mikel at 07:10 AM on 27 November 2011Climategate 2.0: Denialists Serve Up Two-Year-Old Turkey
66, JMurphy 67, Philippe Chantreau OK, I'll keep it brief and, yes, I have read the Muir Russell investigation report, the UEA undertaking to the ICO and seen the guidance from the ICO on research information. 1) Offence committed: Yes, but likely to be an offence under the Computer Misuse Act 1990 not the Theft Act. Although unlikely, a leak could be an offence under Section 55 Data Protection Act. Ultimately, a decision for the CPS; 2) Privacy, in particular privacy at work and the difference between privacy and confidentiality. Privacy in the UK derives from the Human Rights Act. Confidentiality can derive from common law, contract law, commercial/trade secrets, need to protect free/frank exchange of views, to name but a few; 3) Status of the IPCC with regard to rights of access to information. IPCC Secretariat is based in Switzerland and subject to Swiss law?; 4) Records retention policy, in particular with respect to email; 5) Ownership of research information. The academic or the institution? 6) Definition of 'holding' information. Use of personal accounts on external systems; 7) Anonymising personal data to remove that data from being covered by the Data Protection Act. Tension between absolute anonymity and highly probable anonymity in the DPA. -
Andy Skuce at 07:08 AM on 27 November 2011Schmittner et al. (2011) on Climate Sensitivity - the Good, the Bad, and the Ugly
I'll confess from the beginning that I don't understand, in Figure 1, what Marginal posterior probability distributions for equilibrium climate sensitivity really are. James Annan says of this figure:remember, they are not estimates of "the pdf of sensitivity" but rather, probabilistic estimates of the sensitivity - but they do need to overlap in order to be taken seriously
I'm not sure I grasp that distinction either. Nor do I understand why the land-ocean line has five peaks (penta-modal?) Is the lumpiness of this curve meaningful or is it just noise or artefact? Any help would be most welcome. -
Rob Painting at 06:52 AM on 27 November 2011Schmittner et al. (2011) on Climate Sensitivity - the Good, the Bad, and the Ugly
This is figure 4 from Schmittner (2011): Their temperature reconstruction (which they attempt to match the model to) seems to show Arctic temperatures at the Last Glacial Maximum (LGM) warmer than today.
-
Steve L at 06:48 AM on 27 November 2011The Debunking Handbook Part 4: The Worldview Backfire Effect
Hi Adelady, thanks. I've been thinking about what you've written. Also re-thinking about what I wrote. I suspect that the proper approach depends on the target audience (surprise!). This debunking handbook is a tool for people who are trying to win recruits or at least trying to soften opposition. Myers' site and many internet fora may be primarily about reassuring and motivating those already on-side. So, combining this with what you've written about honesty, the lesson may be that brutal honesty is effective within ranks but gentle, careful dishonesty(?) is the right approach outside. Intuitively I want to think that both approaches are useful (and ethical!) so I don't like what I've written here about how to interact with opponents. But really, the goal is finding the right tactic to eradicate misinformation that is protected by someone's cognitive psychology. We have to trick them into lowering that guard. It's called effective communication, and I'm not sure it's entirely honest. To avoid the 'Worldview Backfire Effect' when speaking with someone whose worldview one finds odious, perhaps dishonesty is required. Note, on another thread someone pointed to a Naomi Klein article in The Nation in which she indicated the climate problem was perfect for the Left, because addressing it requires supporting things the Left wanted anyway. Almost immediately someone jumped in to say that Klein needed to be pushed back because this is ammunition for political opponents. In searching for the article a second ago I found a Guardian column called "Dear Naomi Klein: Please Stop Making My Work Difficult." Here Klein's use of the word "reparations" needed to stop. The last line in Part 4 above says that framing isn't "about manipulating people." But it is. All communication is! The question I'm asking is whether it helps to reject/censor communication from one's own side if it has a chance of backfiring. Or is exposure of the target to a diversity of approaches more effective? -
skept.fr at 06:43 AM on 27 November 2011Schmittner et al. (2011) on Climate Sensitivity - the Good, the Bad, and the Ugly
dana #3 : "we might expect similarly radical climate changes to result from similar radical temperature changes" Oh yes, for sure. For example with just a small change in temperature and chiefly westerlies humid fluxes from the Atlantic, we know that large parts of Southern Europe (and France's 'Midi' for my personal interest!) may become a semi-arid region, very different from now. We don't need a 3 or 4 K local warming for that, a more modest switch in temperature/humidity mean and forced circulation would be sufficient. -
muoncounter at 06:41 AM on 27 November 2011Schmittner et al. (2011) on Climate Sensitivity - the Good, the Bad, and the Ugly
Tom C#1: "Over long time spans, the temperature change should equalize." Perhaps, but this MARGO graph and the accompanying paper suggest that the sea water temperature did not equalize: Our reconstruction reveals the presence of large longitudinal gradients in sea surface temperature in all of the ocean basins, in contrast to the simulations of the Last Glacial Maximum climate available at present.
Per the Schmittner paper, the MARGO data are the source for their SSTs. Can we expect land-based temperatures to 'equalize' with SST if there is such a distinct variation in SST? (Note that the yellow-beige represents an anomaly of +1C, as computed from LGM - WOA985 values).
The Schmittner model (their Fig. 3) neither matches the variation in this graphic nor shows 'equalized' temperatures from land to sea.
Our reconstruction reveals the presence of large longitudinal gradients in sea surface temperature in all of the ocean basins, in contrast to the simulations of the Last Glacial Maximum climate available at present.
Per the Schmittner paper, the MARGO data are the source for their SSTs. Can we expect land-based temperatures to 'equalize' with SST if there is such a distinct variation in SST? (Note that the yellow-beige represents an anomaly of +1C, as computed from LGM - WOA985 values).
The Schmittner model (their Fig. 3) neither matches the variation in this graphic nor shows 'equalized' temperatures from land to sea.
-
Jim Powell at 06:17 AM on 27 November 2011SkS public talks in Canada and AGU, San Francisco
Break a leg, John! You will do us proud. -
skept.fr at 06:16 AM on 27 November 2011Schmittner et al. (2011) on Climate Sensitivity - the Good, the Bad, and the Ugly
Tom Curtis #1 : "I have been wondering about the very different climate sensitivities determined using sea surface temperature data, and land data, as shown in figure 1. In general, climate change occurs faster over land than at sea, but that is because of the large thermal inertia of the oceans. Over long time spans, the temperature change should equalize." Interesting. Layman question : why would we expect the same equilibrium ∆T on oceanic and land surfaces ? For example, don't SST depend mainly on underlying circulation changes (changes in salinity, pressure, thermohaline, etc.) and land surface temperatures on other factors (such as vegetation density, melting of permanent ice at mid and high latitudes, etc.)? (For those interested by LGM, here , another work, more precise, with another model and proxy data set, Roche et al 2007) -
Albatross at 06:07 AM on 27 November 2011Schmittner et al. (2011) on Climate Sensitivity - the Good, the Bad, and the Ugly
skept.fr @2, Thanks for the link to the presentation on the preliminary CMIP5 results. Interesting. -
DrTsk at 06:01 AM on 27 November 2011Schmittner et al. (2011) on Climate Sensitivity - the Good, the Bad, and the Ugly
The sea level rise was used as an example of significant climate change. That will not happen now (maybe) but since we are heating up something else dramatic might happen. -
Albatross at 05:59 AM on 27 November 2011Schmittner et al. (2011) on Climate Sensitivity - the Good, the Bad, and the Ugly
Dr. James Annan has some thoughts on the new paper. -
dana1981 at 05:52 AM on 27 November 2011Schmittner et al. (2011) on Climate Sensitivity - the Good, the Bad, and the Ugly
skept @2:"how do we know if a 2,5 K warming imposed on initial conditions of the LGM has the same effect that a 2,5K warming on the present conditions, concerning sea-level rise?"
We don't, and I wouldn't expect them to have the same effect. I was just trying to give an example of the kinds of radical climate changes that occur during glacial-interglacial transitions. That's not to say a similar amount of warming now will cause the same climate changes, just that we might expect similarly radical climate changes to result from similar radical temperature changes. -
kampmannpeine at 05:52 AM on 27 November 2011SkS public talks in Canada and AGU, San Francisco
bon voyage ! and a lot of success! -
skept.fr at 05:38 AM on 27 November 2011Schmittner et al. (2011) on Climate Sensitivity - the Good, the Bad, and the Ugly
Healthy skepticism – I'm quite new here and I hope it is the case for all reconstructions! Your point is clear, this is just one sensitivity study among dozens already published, and one whose main result is very dependent of a new proxy data set for LGM. Even if it was nearly correct (only future debates and eventual replications of the results will tell), it would fall in the range of the IPCC AR4 sensitivity, with already 3 models out 17 in 2,1-2,3 K sensitivity for 2xCO2 (and the CMIP5 first results will probably keep this range of 2-4,5 K in the AR5). As Knutti et Hegerl 2008 pointed out in their review, most equilibrium sensitivity estimates with different methods are centered around 3K. "Another concern regarding the study is in the model they used..." I often read paleoclimate reconstruction with models of intermediate complexity. Maybe they are useful for approximate AO equilibrium on long period ("run faster" as Urban says), but far less realists than AOGCM on short-term variations (as Tamino showed)? See for example Claussen et al 2002 for explanations about EMICs, notably : "EMICs include most of the processes described in comprehensive models, albeit in a more reduced, i.e., a more parameterized form. They explicitly simulate the interactions among several components of the natural Earth system including biogeochemical cycles. On the other hand, EMICs are simple enough to allow for long-term climate simulations over several 10,000 years or even glacial cycles ." "If Schmittner et al. are right about climate sensitivity and LGM temperature change, then if we continue with business-as-usual GHG emissions, we will match the amount of warming between glacial and interglacial periods much sooner. Some of the differences between glacial and interglacial periods include 120 meter sea level rise" Here, a question : how do we know if a 2,5 K warming imposed on initial conditions of the LGM has the same effect that a 2,5K warming on the present conditions, concerning sea-level rise? For example, Vermeer et Rahmstorf 2010 found with a semi-empirical approach a 124 cm sea leval rise for 2,6 K in 2100 (see table 1), not 120 m. Even if it is transient climate response, it is hard to imagine that equilibrium response (for the same 2,6 K warming) would add 119 m. I suppose a complete Earth System Model (with A-O coupling on small grids, but also carbon cycle, vegetation, ice etc.) could tell us what would happen with a 2,6 K warming. If there is a high dependency to initial conditions, the previous LGM-Holocene transition is not necessary a good reference. -
Rob Painting at 05:33 AM on 27 November 2011What's Happening To Tuvalu Sea Level?
skept.fr @ 2 - See Timmerman (2010), the full paper is linked to in the post. The projections indicate an El Nino-like trend (a weakening of the wind-driven water mass) in the 21st century, which will oppose sea level rise (SLR) in the Pacific Islands. Sadly it's nowhere near enough to counter the contributions to SLR by thermal expansion and melting land ice. Victull @ 5 - see SkS post: Hiding the incline in sea level William @ 8 - Thanks. See the SkS rebuttals on coral atolls. I hyper-linked to it in the post, but it's not conspicuous. Further reading on this related topic is in the SkS rebuttal on coral bleaching. It is incredibly simplistic to think that sand accumulation (indicated in your link) will alleviate problems. I'm sure you can see the flaws of such "skeptic logic." I don't even broach the issue of ENSO (La Nina/El Nino) effects on rainfall in the tropical western Pacific, nor the threat of storm surge intensification. Add ocean acidification into the mix, and I expect most rational people can connect the dots. Tuvalu is living on borrowed time. -
Steve L at 05:29 AM on 27 November 2011What's Happening To Tuvalu Sea Level?
Hi Michael (@4) for all that interesting information. I was thinking in terms of detecting rising sea levels and understanding direct impacts in general. Sea level rises and falls with perhaps a decadal periodicity and AGW is adding an increasing trend on top of that. At the same time rain patterns change, there's irrigation, etc. That trend in aquifer salinity might not be easily detectable over short time scales. If saltwater contamination is an important prediction and outcome of AGW, then perhaps there should be a good baseline developed of the world's vulnerably coastal areas. I just briefly googled to see if there was a sort of global monitoring. I found this webpage for Tasmanian aquifer salinity. Looks to me as though good baselines probably aren't widespread. -
Tom Curtis at 05:28 AM on 27 November 2011Economic Growth and Climate Change Part 1 - Factors Influencing CO2 Emissions
MA Rodger @42, thankyou. I believe that this graph shows conclusively that natural variation is the major component in changes from year to year in atmospheric CO2 concentration. To avoid misrepresentation it should be noted that the graph does not show the annual emissions of CO2, but the change in the emissions from one year to the next. Had it shown the annual emissions, they would clearly have been much larger than the year to year fluctuations. Indeed, the first graph in post 40 shows exactly that. Therefore, and without any doubt, anthropogenic emissions are responsible for the long term trend in the graph of CO2 concentration. -
Philippe Chantreau at 05:20 AM on 27 November 2011Climategate 2.0: Denialists Serve Up Two-Year-Old Turkey
I'm not sure anyone can without more specifics Mikel. What are these "issues"? For a start, why don't you look in details at the various investigations that have already been conducted on these e-mails? The leftovers that are being served up now to attempt to derail the Durban talks have absolutely nothing new, so whatever "issues" are there were already there 2 years ago, I presume. -
Tom Curtis at 05:13 AM on 27 November 2011Schmittner et al. (2011) on Climate Sensitivity - the Good, the Bad, and the Ugly
I have been wondering about the very different climate sensitivities determined using sea surface temperature data, and land data, as shown in figure 1. In general, climate change occurs faster over land than at sea, but that is because of the large thermal inertia of the oceans. Over long time spans, the temperature change should equalize. Land temperatures should still show a greater day/night, seasonal and annual fluctuations, but should fluctuate about a mean that is close to sea surface temperatures. Once exception is if the SST freezes. In that event, "Sea Surface Temperatures" as measured by proxies will not actually be the Sea Surface Temperature, ie, the upper surface of the ice, but rather the temperature of the liquid water beneath the ice. That water will, of course, be just above freezing temperature. Consequently, sea surface temperatures have a floor below which they will not fall. The consequence of this is that the lower global means surface temperatures fall, and hence the more extensive the sea ice, the greater the discrepancy between global mean sea surface temperature and global mean Surface Air Temperature. Unfortunately, as temperatures rise, there is no ceiling on Sea Surface Temperatures (except for a runaway greenhouse effect). Ergo, with rising temperatures, SST will rise to match land Surface Air Temperatures. That being the case, the land only climate sensitivity (in green in figure 1) is probably a better predictor of future climate change with increased CO2 than are the ocean, or land and ocean values. -
MA Rodger at 05:10 AM on 27 November 2011Economic Growth and Climate Change Part 1 - Factors Influencing CO2 Emissions
Off-topic graph as requested @37.
-
Tom Curtis at 05:00 AM on 27 November 2011Lindzen and Choi find low climate sensitivity
Can I recommend that we take discussion of Schmittner et al across to the new post discussing it? -
JMurphy at 04:57 AM on 27 November 2011Climategate 2.0: Denialists Serve Up Two-Year-Old Turkey
What legal issues, Mikel ? -
william5331 at 04:56 AM on 27 November 2011What's Happening To Tuvalu Sea Level?
No argument whether sea level is rising or not or where it is rising. You have the hard data which says it is and any reasonable person would have to admit that the rise will most likely accelerate over the coming years. However, we may be focusing on the wrong factor. It could be that sea level rise is the least of the worries of the coral atoll nations. http://mtkass.blogspot.com/2011/09/by-by-coral-atolls.html William -
JMurphy at 04:54 AM on 27 November 2011Lindzen and Choi find low climate sensitivity
There is also an informative interview with Nathan Urban (second author of the Schmittner et al paper) at Planet3.org. He is not too happy about the way some so-called skeptics have used the graph shown in les's comment above, especially mentioning Pat Michaels. The interview also mentions the double-think of the so-called skeptics in general, because they can highlight and praise this paper as being something they find easier to believe in (because of the possibility of lower climate sensitivity); even though it also makes it very unlikely that Lindzen and Spencer are right with their claims that sensitivity is even lower, i.e. under 1. So, are Lindzen and Spencer now to be dismissed by the so-called skeptics ? As soon as pigs can fly... -
Mikel at 04:45 AM on 27 November 2011Climategate 2.0: Denialists Serve Up Two-Year-Old Turkey
64, Sphaerica Wow! I tried asking a polite question. Definitely did not expect such a response. I can answer your question, but I'll take the Moderator's advice before getting into a whole range of legal issues here. Perhaps someone else can answer my question.Response:[DB] Your original question:
"Is there any site dedicated to legal matters that discusses the legal issues raised by the content of these emails?"
You are ignoring the extremely large pink mamuk in the room: The theft of the emails was a crime currently under investigation. Your continued focus on the content of the stolen emails is misplaced.
Given that, Sphaerica's answer:
"there is no evidence whatsoever of anything remotely close to criminal activity in the content of the e-mails"
Is spot-on.
Edit: As is this quote from dhogaza over at RC:
"Stealing private e-mail discussions and publicizing them is akin to bugging the supreme court during their private deliberations and releasing the recording"
-
DrTsk at 04:27 AM on 27 November 2011Memo to Climategate Hacker: Poor Nations Don't Want Your Kind of Help
Thanks John. Good resources. -
John Hartz at 04:01 AM on 27 November 2011Memo to Climategate Hacker: Poor Nations Don't Want Your Kind of Help
As she surveys her small, bare plot in Zimbabwe's capital, farmer Janet Vambe knows something serious is happening, even if she has never heard of climate change. "Long ago, I could set my calendar with the date the rains started," the 72-year-old said. Nowadays, "we have to gamble with the rains. If you plant early you might lose and if you plant late you might win. We are at a loss of what to do." Paramu Mafongoya, a University of Zimbabwe agronomist, says Vambe's worries and those of millions of other poor farmers — most of them women — across Africa are a clear sign of the impact of climate change on a continent already struggling to feed itself. Changes have been noted in the timing and the distribution of rainfall on the continent. Zimbabweans say the rainy season has become shorter and more unpredictable, Mafongoya said. Climate change "is a serious threat to human life," Mafongoya said. "It affects agriculture and food security everywhere." Source: “Climate change hits Africa's poorest farmers” AP, Nov 26, 2011 To access this in-depth article, click here. -
skept.fr at 03:51 AM on 27 November 2011Economic Growth and Climate Change Part 1 - Factors Influencing CO2 Emissions
#39 muoncounter : "That is not a little effect; it is plainly visible on the CO2 emissions curve, as are the Arab oil embargoes, the post-Gulf War recession and even the GWB recession of 2001. Zooming in further, changes in US emissions very visibly drop during these economic stress points" Oh so, we can go back to the real topic of perseus post: if (fossil-based) economic growth is the major driver of CO2 emissions' upward trend since 1850, can we break the correlation in the future (keep the growth up with CO2 down) and if we can't, should we break the growth itself? (But these core questions will probably be treated in the part 2, so may be it is better to wait for the next perseus post? I don't know when (s)he plans to post). -
muoncounter at 03:47 AM on 27 November 2011Economic Growth and Climate Change Part 1 - Factors Influencing CO2 Emissions
Here's another look at the same graphic; this one by Ferdinand Engelbeen, via our very own Dikran Marsupial: Engelbeen also produced this graph, demonstrating a remarkably consistent slope (percentage of cumulative emissions remaining in the atmosphere) of 0.53:

-
muoncounter at 03:34 AM on 27 November 2011Economic Growth and Climate Change Part 1 - Factors Influencing CO2 Emissions
Tom C#37: "just how little major economic shocks actually effect the actual productive capacity (and production) of the global economic system." This graph (and others on more suitable scales) dispute that. "Even the great depression reduced CO2 annual emissions by only around15%26%" That is not a little effect; it is plainly visible on the CO2 emissions curve, as are the Arab oil embargoes, the post-Gulf War recession and even the GWB recession of 2001. Zooming in further, changes in US emissions very visibly drop during these economic stress points: tamino addressed this entire question here.
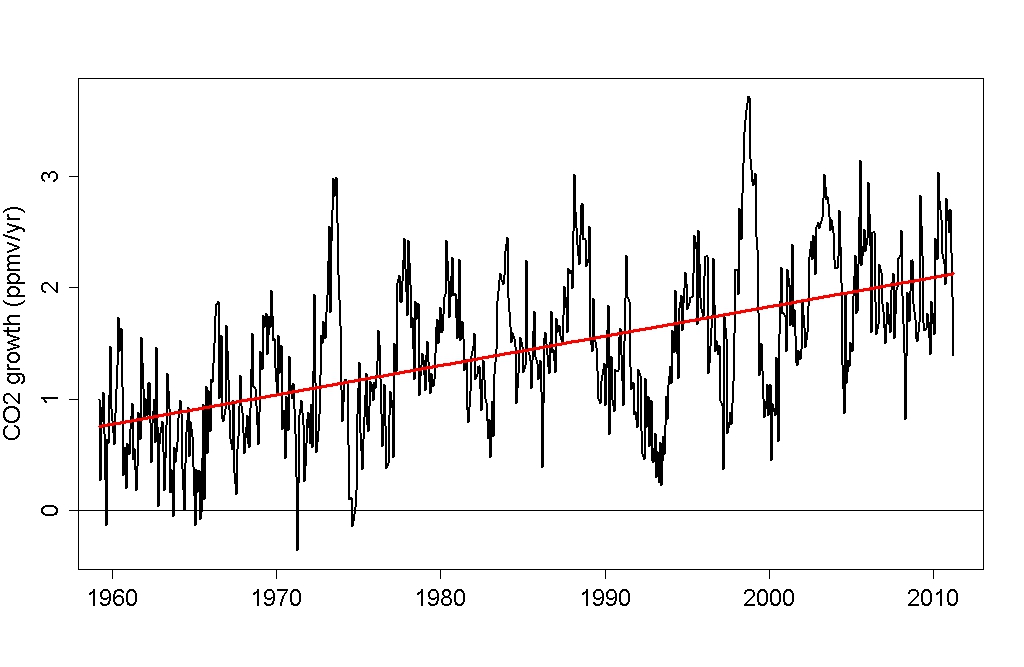 He models the CO2 growth curve remarkably well from a combination of the linear trend and MEI:

-
Daniel Bailey at 03:33 AM on 27 November 2011What's Happening To Tuvalu Sea Level?
Another thing to consider is that the human mind generally thinks in linear fashion on human timescales, which tend to be day-to-day. That makes it exceedingly difficult to grasp non-linear, or exponential changes. Like projected SLR vs that which already has occurred. -
les at 03:32 AM on 27 November 2011Lindzen and Choi find low climate sensitivity
An interesting contribution from the Azimuth blog, including a link to the paper, this graph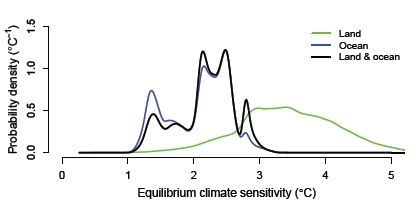 and a link to an interview with one of the authors.
-
DrTsk at 03:22 AM on 27 November 2011What's Happening To Tuvalu Sea Level?
@5 You can take any 10 year interval and see a leveling off a decline or even pink elephants. What in the "long-term rise" don't you get?? The same is true for temperatures droughts sea ice extent etc. False arguments and strawmen...
Prev 1379 1380 1381 1382 1383 1384 1385 1386 1387 1388 1389 1390 1391 1392 1393 1394 Next


