


 Arguments


Recent Comments
Prev 1417 1418 1419 1420 1421 1422 1423 1424 1425 1426 1427 1428 1429 1430 1431 1432 Next
Comments 71201 to 71250:
-
Tom Curtis at 14:51 PM on 1 November 2011Baked Curry: The BEST Way to Hide the Incline
Rickoxo @34, taking your questions in order: 1) Yes, Muller made his statement first. 2) No, Muller was (probably) talking about the whole body of evidence. The trend from 1975 to current is just as much evidence about what will happen in the future as the trend from 2000 to present. Muller chose not to ignore that evidence, and to make his statement based on the whole of the evidence before him. 3) No. Curry explicitly only talks about the period from January 2001 to May 2010, a period of just under 10 years. It is important to her case that she uses just under 10 years, rather than 10 years or 12 years. Had she used either of the longer periods, a clear (but not statistically significant) positive trend would have been present. Finally even if we confine ourselves to consideration of just the last 12 years data, we can only conclude that global warming has stopped by ignoring the physics. We know from evidence in the last 12 years that early in that period we had frequent El Nino's, whereas since 2008 ENSO has tended to La Nina's. We know that El Nino's result in warmer years, and La Nina's result in cooler years. We know that solar activity has reduced over the last 12 years to levels not seen since 1910, so much so that some solar physicists are predicting a new maunder minimum. Therefore we know that without an significant warming factor temperatures would have declined drastically over the last 12 years, instead of remaining fairly constant. That they have not is clear evidence of a countervailing warming force that will restore warming once the ENSO cycle switches to neutral or El Nino's. In essence, Curry has taken a line with troughs and peaks, and drawn a line from a peak to a trough and insisted that that is the trend. We don't need to know statistics to know that that is garbage. -
Tom Curtis at 14:35 PM on 1 November 2011Baked Curry: The BEST Way to Hide the Incline
muoncounter @33, with respect, I believe I was making the same logical point that Tamino made with his entire post, not just one graph. Using Tamino's preferred ARMA(1,1) model, the uncertainties of successive trends to March 2010 in BEST data are as follows: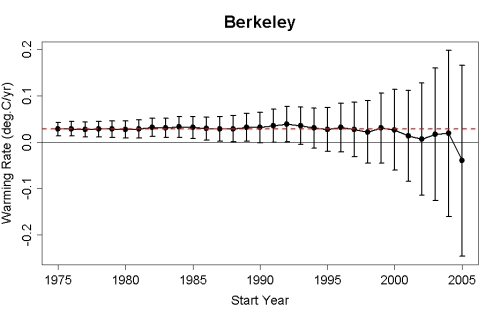 You can see from that that if we only had the data from 1993 onwards, we could not say with certainty that the underlying trend was positive, let alone that it was close to 0.27 degrees C per decade. Given that, we would still be in the position to say that "not one single start year gives an estimate which contradicts" a rate of 0.27 degrees C per decade. But we would also be in a position to say that "not one single start year gives an estimate which contradicts" a rate of -0.01 degrees C per decade.
As it happens, we are in a position to say something far stronger than that, ie, that the underlying trend is very likely (greater than 0.95 probability) to be close to 0.27 degrees per decade. We are in that position because the trend from 1992 to May 2010 is also evidence regarding that underlying trend. And so on for the years that go back. (We can also say that for reasons of physics, which are more important that mere statistical reasons, but that is beside the point here.)
Perhaps it would be more accurate to state Tamino's point this way:
1) We have strong evidence from medium term trends (greater than 17 years) that the temperature trend is close to 0.27 degrees C;
2) No short term trends provide evidence significant enough to bring suggest the evidence in (1) is misleading about the future temperature trend.
I believe you are focusing on (2), but logically, without (1), (2) is largely irrelevant.
(I do not exclude the possibility that we are merely talking at cross purposes.)
You can see from that that if we only had the data from 1993 onwards, we could not say with certainty that the underlying trend was positive, let alone that it was close to 0.27 degrees C per decade. Given that, we would still be in the position to say that "not one single start year gives an estimate which contradicts" a rate of 0.27 degrees C per decade. But we would also be in a position to say that "not one single start year gives an estimate which contradicts" a rate of -0.01 degrees C per decade.
As it happens, we are in a position to say something far stronger than that, ie, that the underlying trend is very likely (greater than 0.95 probability) to be close to 0.27 degrees per decade. We are in that position because the trend from 1992 to May 2010 is also evidence regarding that underlying trend. And so on for the years that go back. (We can also say that for reasons of physics, which are more important that mere statistical reasons, but that is beside the point here.)
Perhaps it would be more accurate to state Tamino's point this way:
1) We have strong evidence from medium term trends (greater than 17 years) that the temperature trend is close to 0.27 degrees C;
2) No short term trends provide evidence significant enough to bring suggest the evidence in (1) is misleading about the future temperature trend.
I believe you are focusing on (2), but logically, without (1), (2) is largely irrelevant.
(I do not exclude the possibility that we are merely talking at cross purposes.)
-
Bob Loblaw at 14:34 PM on 1 November 2011Pielke Sr. and SkS Dialogue Final Summary
A few odds and ends - it has been a busy day, so time is limited. Tom: I'd disagree that OHC content has no implications for future climate. Sea Surface Temperature (SST) is strongly linked to ocean temperature - at least for the mixed layer. How and where in the ocean the heat accumulates affects SST, which affects large parts of the climate system during the period of transition as TOA radiation returns to balance. I agree with your statement of the importance of TOA radiation, and the importance of SST on climate, but personally I think it is unlikely that increased flux of energy into the ocean surface would be exactly balanced by increased flux to depth, so that SST would remain the same. I would more expect that SST would rise, leading to increased flux of heat into the ocean - even if there is increased mixing by factors such as wind. Just a hunch, though. Tom and Victull: one aspect of the idea that OHC be the "primary" metric is that OHC is really mainly answering just one question: where does the heat that accumulates due to the TOA imbalance end up? Measuring OHC really doesn't help a lot to find out how the heat gets into the ocean, and that is the fundamental question for understanding the climatology of the issue, which is what we need to know to make predictions and improve models. To make what might be a bad analogy: the indicator that tells you what illness you have may not tell you what to do to cure it or prevent it - for that you need additional information that helps you understand the disease, not just test for it. -
Rickoxo at 14:12 PM on 1 November 2011Baked Curry: The BEST Way to Hide the Incline
I had posted about this over on the no warming since 1998 thread but this specific argument seems to be taking place here. I posted a question there (124) that while it got a number of responses, it at least seems to me that they missed the basic point. According to the daily mail article, Muller made the following statement before Curry made any public statement. When asked about recent data showing global warming has stopped, Muller answered, "There is no evidence of it [global warming] having slowed down." The first part of this is timing. At least from what I understand, Muller made his comment first, before Curry, so Curry's comment is a response to Muller. Is that accepted as true? Second, Muller said there is no evidence of global warming having slowed down, is it accepted that he meant that statement in relation to recent climate data (i.e. roughly the last 12 years)? When Curry responded to Muller, is it accepted that when she says, ‘There is no scientific basis for saying that warming hasn’t stopped’ that she's talking about roughly the last 12 years? So Muller spoke first and said: there is no statistically significant scientific evidence looking at data from the last 12 years proving global has slowed down. Curry responded saying: there is no statistically significant scientific evidence looking at data from the last 12 years proving global warming hasn't stopped. 1. From what I can tell, those two statements are accurate restatements of what they said. 2. Those two statements are logically identical. 3. Both are technically true. 4. As Tamino and many others point out, both are meaningless and useless for intelligent discussion. Whatever people think about Curry or other things she may have said, Muller spoke first and made the first meaningless, misleading statement. Curry called him on it, argued that the exact same data he cited could be used to say the exact opposite of what he said and that she was embarrassed he would put out such a misleading statement. Her position was simply, don't over-speak, we just put out the most accurate, reliable data set to date, let it speak for itself. No matter what you think about the bigger argument, Muller made a technically true but meanignless statement in talking to the Daily Mail reporter. He could have simply said 10-12 years is too small of an amount of time to know anything about what's happening with global warming, he could have talked about decadal fluctuations, but he started the "there is no evidence" ball rolling. It seems seriously inconsistent to hammer on Curry but not put the blame on Muller who started it. -
muoncounter at 14:05 PM on 1 November 2011Baked Curry: The BEST Way to Hide the Incline
Tom C#26: "the point of Tamino's post." I find that tamino is making a much stronger point than you've highlighted. In the text surrounding this graph, he speaks directly to Dr. C:
"The red dashed line shows the trend rate from 1975. Note that not one single start year gives an estimate which contradicts that rate. That is evidence — damn strong evidence in fact — that the underlying trend rate has not changed since 1975. Hey Judith: there’s a REAL scientific basis for you."
--emphasis in originalI think that's the key point: The uncertainties in the trends calculated from the more recent data values are so large that we cannot say with confidence that any such change has occurred. In other words, we have no evidence of that change; on the contrary, we have evidence that it has not changed. This is still a signal processing problem. Until we can separate the signal (the trend) from the noise (short term variations), we should not be fooled into thinking that noise is signal. That was exactly what Dr. Pielke insisted we should be doing: to ignore the obvious that the warming of the lower troposphere has halted, when averaged over the time period 1998 (or 2002) to the present, ignores the obvious signal in the data. That's only true if you like the noise more than you like the signal.
-
Tom Curtis at 14:05 PM on 1 November 2011Baked Curry: The BEST Way to Hide the Incline
NewYorkJ @29, yup, his retrodiction that in April 2010, the globe would shrink so that it would only include Antarctica was right on the money. -
actually thoughtful at 14:02 PM on 1 November 2011Sorting out Settled Science from Remaining Uncertainties
I fear a return of solar activity, as the deniers will then say it is the sun now, it was the sun, and it will always be the sun. A little bit of luck could turn this either way (ie a heat wave/El Nino in the US before the next election would put global warming back on the agenda; a strong solar showing could feed the deniers for years). -
Stevo at 13:55 PM on 1 November 2011Baked Curry: The BEST Way to Hide the Incline
scaddenp @30 Thankyou for that. I'll refer any further questions to the appropriate thread. -
scaddenp at 13:45 PM on 1 November 2011Baked Curry: The BEST Way to Hide the Incline
Note that there are several sub-heading articles on "temperature record in unreliable" covering proxy records. Thermometer records have issues with screens, time of day, recording interval, height etc. For the GHCN stations are homogenised by procedures which are linked at GISTEMP site. A tougher call is why would it show a warming bias? However, this is best discussed on the appropriate thread. The point of BEST is that the best effort by skeptics have yet to show reason to reject GISTEMP. If warming is just an instrumentation problem, then explain the satellite MSU readings, glacier retreat and sealevel rise which broadly agree. -
NewYorkJ at 13:40 PM on 1 November 2011Baked Curry: The BEST Way to Hide the Incline
Wow, look at that decline. Maybe that McLean fellow was right after all... -
Stevo at 13:26 PM on 1 November 2011Baked Curry: The BEST Way to Hide the Incline
scaddenp @27, I used the "temperature record is unreliable" thread yesterday. I suspect I might be being "trolled" but have passed on your request for exact claims and specific sources and thank you very much for your kind offer to assist. An article I was refered to was at WUWT entitled 'the metrology of thermometers'. Of course it read to me as sounding like "we reserve the right to ignore any instrument readings we dislike because they were probably inaccurate". -
scaddenp at 13:05 PM on 1 November 2011Baked Curry: The BEST Way to Hide the Incline
Stevo - go here (taxonomy) and look at articles around "temperature record is unreliable" right at the top. If you dont find the answers you want there, how about some more exact claims (and their source) and we could look at it. -
Tom Curtis at 12:53 PM on 1 November 2011It hasn't warmed since 1998
Rickoxo @124, I am in broad agreement with Dana, muoncounter and Sphaerica. However, using the term in a very technically correct way, what Muller said was false. That is irrelevant, however, because he was speaking to the popular press, and in popular usage, people say "There is no evidence that p" when they mean "There is no significant evidence that p" or, "The overwhelming balance of evidence is that not p". Substituting "there has been no pause in global warming" for p and we find that in popular usage, Mullers claim is true. For an examination of the pedantic meaning of evidence, see the posts by Dikran Marsupial and myself on the new thread. -
Tom Curtis at 12:43 PM on 1 November 2011Baked Curry: The BEST Way to Hide the Incline
Commenting on Dikran Marsupial @1 (who knows all this), he raises an interesting point. I prefer to use a definition of evidence by which: x is evidence of y if and only if the probability of y given that x is true > the probability of y given that x is false. By this definition, the slope of the BEST temperature data from January 2001 to May 2010 is certainly evidence that global temperatures will not continue to rise in the near to medium future. I think it is important to recognize that if we are to be guided by the whole body of evidence, but it is even more important to recognize the weight of the recent temperature record as evidence. The importance of recognizing this is illustrated by the paradox of the raven. The paradox of the raven, pointed out by Carl Hempel, is one of many paradoxes of induction. Hempel pointed out that "All ravens are black" is logically equivalent to "All things which are not black are not ravens". It follows that discovering something which is both not black, and not a raven is evidence that all ravens are black. As paradoxical as it seems, that result is sound. Finding a green apple does indeed make it more likely that you will never discover a raven which is not black - by an imperceptible amount. This can even be shown with Bayes theorem, so it cannot be denied without logical inconsistency. But while the green apple is evidence that all ravens are black, it is not significant evidence. Scientists, who only have a limited time on Earth to discover a great many things, try to work efficiently. Consequently, if a scientist was trying to test the hypothesis, "all ravens are black", she would go around examining ravens, not apples. In like manner, when examining temperature series for evidence of future behavior, they concentrate on those series long enough to have a narrow error range. By convention, they focus only on those results which lie within the 95% confidence interval, a standard temperature trends with less than 10 years data do not achieve. Not only are there issues of significance involved; there is also the issue of using all the available data. The temperature series from January, 2001 to May 2010 is not the only evidence that bears on the issue of future temperature rises. The series from December 2000 to May 2010 is also relevant. So is the series from November 2000 to May 2010, and so on. If we were to take all possible trends from the BEST data terminating in May 2010, and weight them according to statistical significance to determine what the balance of evidence shows, it would show a rising trend. In fact, that is the point of Tamino's post. The slope of the temperature data between January 2001 and May 2010 isn't significant evidence of anything much, because of the very wide error bars on the regression. But that does not cause the slope on the data from January 1975 to May 2010 to stop being evidence of future behavior of the temperature series. On the contrary, it remains evidence, and highly significant evidence. Consequently we can categorically state that the balance of scientific evidence indicates that global warming is continuing unabated. This does not mean that there is no evidence, which taken in isolation, and no matter how weak, does not indicate the opposite. But it does mean the great bulk of the evidence strongly favours that hypothesis. It is not clear that this long discussion really adds anything to what Dikran said. However, given the experience of Phil Jones on "statistical significant warming", I think it necessary to be absolutely clear when you say things like "There is evidence that global warming has slowed down", or that somebody is incorrect in denying that. In fact, the response to Muller's claim shows clearly that so called "climate skeptics" will roll rough shod over any subtleties to extract the message they want to hear, regardless of what the data shows. Given that, I fully understand Muller's shorthand expression. What he should have said is that, "There is no significant evidence that global warming has stopped", and "The balance of evidence shows global warming to be continuing unabated". But for a popular audience, that is correctly summed up with the claim that, "There is no evidence global warming has stopped" - to which, were the faux-skeptics not trying to manufacture faux-controversy, nobody would have demurred. -
muoncounter at 12:37 PM on 1 November 2011Baked Curry: The BEST Way to Hide the Incline
The fouls just keep on coming: In this comment at RC, it appears that Fred the-patron-saint-of-denial Singer committed the very same foul. Singer has violated both Nature’s strictures against science by press conference, and the very principle he pretends to defend, by giving it to Watts to publicize Of course, didn't Dr. Roy also play the science-by-press-conference game? I suspect - but have no proof of it - that Dessler was under pressure to get this paper published to blunt the negative impact our work has had on the IPCC's efforts. -
Rob Painting at 12:18 PM on 1 November 2011Baked Curry: The BEST Way to Hide the Incline
Seems a bit silly to just include the temperatures from Antarctica for that month. Why not wait until other data come in? People will be very confused by that blip. -
robert way at 12:14 PM on 1 November 2011Baked Curry: The BEST Way to Hide the Incline
Michael Hauber, Well in fairness to that month... it is only including stations from Antarctica haha -
Michael Hauber at 12:12 PM on 1 November 2011Baked Curry: The BEST Way to Hide the Incline
Wow that one month looks like about the coldest month since 1956. Just like McClean predicted. Except he predicted that it would be next year. More seriously I find it ironic that the more sensible sounding opponents of the climate consensus do focus on two major talking points: - that the temperature record should be more open and transparent - that warming has slowed/stopped in the last decade, and that this pause is significant and reflects a reduction in Co2 warming, and not a temporary cooling caused by some other factor. And that HADCRUT shows less warming than GISS over the last decade, and is also the series with the biggest issues around transparency. And now BEST was created by skeptics specifically to address their concerns around openness and transparency shows a greater warming rate than GISS over the last decade - as long as that cool value in Apr 2010 is excluded,. -
muoncounter at 12:03 PM on 1 November 2011Baked Curry: The BEST Way to Hide the Incline
Sphaerica#19: "quickly cried "foul"" So, releasing info to the press (or online) prior to publication in peer-reviewed journals is a foul? This rule did not apply to Mme Curry's blog release of 'The Uncertainty Monster,' a full 3 months before it appeared in press. I guess that's how they roll in faux-skeptic world: the rules are different for the other guys. -
Stevo at 11:56 AM on 1 November 2011Baked Curry: The BEST Way to Hide the Incline
Some opponents of BEST results are arguing that about inaccuracies of thermometer records, and the supposed unreliability of temperature proxy data. Sorry to drift off topic, but I've found a few threads here at SkS that are very helpful but ask if anyone here can direct me to any articles which deal with those two specific questions?Response:[dana1981] Temp record, proxies
-
Bob Lacatena at 11:56 AM on 1 November 2011Baked Curry: The BEST Way to Hide the Incline
16, JMurphy, I didn't think I could stomach the comments on Curry's blog, but looking it now, they saw the same thing and quickly cried "foul" on Muller's November deadline excuse. The plot thickens. Why am I not surprised? -
DrTsk at 11:52 AM on 1 November 2011Baked Curry: The BEST Way to Hide the Incline
Enough cherrypicking already `nough said!!!! -
Brian Purdue at 11:03 AM on 1 November 2011Baked Curry: The BEST Way to Hide the Incline
To add some light entertainment to this important conversation. http://www.youtube.com/watch?v=TrURLJ6Vlsg But I don’t think the Watts, Singer, Curry crowd are in denial – it’s a lot more complicated than that. -
JMurphy at 10:40 AM on 1 November 2011Baked Curry: The BEST Way to Hide the Incline
I'm not convinced about that November cut-off date mentioned by Sphaerica, supposedly mentioned by Muller. On the IPCC website is the following : WGI AR5 literature cut-off for submitted papers, 31 July 2012 -
dana1981 at 10:17 AM on 1 November 2011Baked Curry: The BEST Way to Hide the Incline
Sphaerica @11 - that sounds like a likely explanation. I guess if they convince the IPCC not to rely on HadCRUT as the main surface temperature record in the AR5, that might actually be a useful result.Moderator Response: [John Hartz] AR5=IPCC's Fifth Annual Assessment report. -
Albatross at 10:06 AM on 1 November 2011Baked Curry: The BEST Way to Hide the Incline
To build on muoncounter's excellent post @10: The Merchants of Doubt (Watts, Curry, Pielke etc.) are behaving just like defense lawyers do and using the same tactics/tricks that they use on jurors: caste doubt, confuse, obfuscate, and make ad hominem attacks. I'd suggest one small change to "muoncounter's law": "If you don't have the science, and you do not like the signal, then argue the noise" -
Bert from Eltham at 09:50 AM on 1 November 2011Baked Curry: The BEST Way to Hide the Incline
To show how easily the human senses can be fooled, J S Bach used to have compositions where the pitch seemed to ever rise. For more see here http://en.wikipedia.org/wiki/Shepard_tone I think the opposite is happening here with the wished for 'decline' being seen as obvious by our highly evolved pattern recognition systems working overtime in some people. As muoncounter pointed out at 9.22 am the BEST graphs can be potrayed as an ever rising set of 'steps' with the noise hiding the 'risers'. Bert -
Jeffrey Davis at 09:48 AM on 1 November 2011Baked Curry: The BEST Way to Hide the Incline
I like muoncounter's new law at 10, and I thought I'd add one: if you don't have any noise, make some. -
Bob Lacatena at 09:42 AM on 1 November 2011Baked Curry: The BEST Way to Hide the Incline
9, dana1981, My guess is that they just haven't finished yet. Curry's site says that Muller said they rushed to publication before November so that it would be eligible for inclusion in AR5. That makes sense, and if that's the case, and they started from the oldest date and worked forward, the obvious inference is that by publication they'd only gotten halfway through 2010, and are still working on the rest. But... the smart move would have been to completely leave out April/May, not include it with only 47 data points processed. -
muoncounter at 09:22 AM on 1 November 2011Baked Curry: The BEST Way to Hide the Incline
The 'let's have fun with BEST graphs' started here. It's a hoot that this comes so quickly on the heels of the Pielke statements as summarized by Albatross and Dikran. In law, if you don't have the facts, you argue the law. In this newly evolving pseudo-skeptic 'science,' if you don't like the signal, you argue the noise. -
dana1981 at 09:20 AM on 1 November 2011Baked Curry: The BEST Way to Hide the Incline
michael @8 - I'm not sure why the BEST analysis effectively ends a year and a half ago. I found that odd as well. -
michael sweet at 08:44 AM on 1 November 2011Baked Curry: The BEST Way to Hide the Incline
Why don't the BEST team have the data from 2010 like everyone else? Could they be "hiding the incline" ;)? Really though, how can they be the "BEST" data set when they are so far out of data? -
Bob Loblaw at 08:40 AM on 1 November 2011Baked Curry: The BEST Way to Hide the Incline
Re: Sphaerica @ 3, dana @ 4. Quite to the contrary. If you want to do a linear fit, I highly recommend that you stop collecting data after you have two points. Anything more just adds to the confusion. The trick is making sure that you have only the two data points you want to show the trend you want. [If anyone wants to disagree with me, keep in mind that I disagree with me, before you start arguing.] I actually read a paper once that did a linear regression on about 100 points, and found that the relationship was not statistically significant. They then duplicated the data set - i.e., they added a second copy of the same data to make 200 points - and then claimed that the regression was now significant, so they had shown that the relationship was real and the only reason for the lack of significance in the original data was that they didn't have enough data. They then proceeded under the assumption that they had come up with a proper result. I have no idea how it got past peer review. -
dana1981 at 08:37 AM on 1 November 2011Baked Curry: The BEST Way to Hide the Incline
I'm considering writing a post that centers around the graph Sphaerica created showing global warming "pauses" every 8 years or so (if you don't mind me stealing your idea, Sphaerica). It looks like "global warming has magically stopped" is becoming the new favorite "skeptic" argument, and it's argument they can always make with some creative cherrypicking of dates, as Sphaerica showed. And the likes of Pielke and Curry and Spencer are not helping matters, effectively encouraging the propagation of this myth. -
Albatross at 08:31 AM on 1 November 2011Baked Curry: The BEST Way to Hide the Incline
Sphaerica @3, "Really, how can you identify such a trend with just two data points?" Good point ;) Good one. But we do have a fairly large sample size. Watts, Singer, Curry, Pielke, Delingpole, Eschenbach, McLean, Monckton and many others I suspect claim that the warming has stopped, some of those even claim that we are cooling or have entered a long-term cooling trend. Where is that neat graph that you showed elsewhere? I do not wish to steal your thunder :) -
dana1981 at 08:22 AM on 1 November 2011Baked Curry: The BEST Way to Hide the Incline
Dikran - fair enough, evidence but not statistically significant (or less than weak) evidence. Really the issue is that, as often happens, the short-term noise is temporarily slowing the long-term trend (in a couple of years the converse will likely happen). The so-called "skeptics" are screaming that this proves global warming has stopped. The scientists who are trying to "bridge the gap" between real science and hysterical "skeptics" (a few of whose names have been mentioned here) don't seem to know how to react to this short-term change in trend. Dr. Pielke has said we should lower the standards of our analysis and essentially admit that global warming has slowed/paused/stopped/whatever. Dr. Curry is frankly all over the place. Dr. Muller started out saying there's no evidence the warming has slowed, then backtracked and apparently said we're in the midst of a "pause". The real failure amongst these scientists is in communicating that short-term pauses are expected, commonly occur, don't tell us anything about the long-term warming trend, and the current one is no surprise given that so many short-term effects have been in the cooling direction in recent years. -
scaddenp at 08:11 AM on 1 November 2011Richard Milne separates skepticism from denial
Shibui - just as a matter of interest, since you dont like the journal's subscription costs, who do you think should pay for the publishing? -
Bob Loblaw at 08:11 AM on 1 November 2011Climate's changed before
The full term you are interested in is "bright sunshine hours", and it has a formal WMO definition (CIMO Guide chapter 8) based on direct beam solar radiation - you accumulate bright sunshine when direct solar exceeds 120 W/m². The Campbell-Stokes instrument is the classic, but has its limitations. The Campbell-Stokes instrument has been around much longer than the formal WMO definition. There are several other manufacturers of more modern instruments (e.g., Kipp and Zonen). There are long records of Campbell-Stokes data around the world, but the data is of quite limited value compared to actual measurements of solar radiation. I think sunshine hours was part of the whole "Global Dimming" craze a few years ago. Using the SkS search tool gives a few hits for "global dimming", and RealClimate had at least one discussion of it. A good place for global surface radiation data is the Baseline Surface Radiation Network. A fairly recent paper that looks at some of this is Wild 2009. -
scaddenp at 08:06 AM on 1 November 2011Climate's changed before
Change in sunshine hours is surely just a measure of changing cloudiness. Satellite records would provide far better global measure of this rather than station records. IPCC reports certainly mention cloud cover. -
Bob Lacatena at 07:58 AM on 1 November 2011Baked Curry: The BEST Way to Hide the Incline
2, muoncounter,Do you suspect a trend?
I object. Your erroneous-global-cooling-trend-statements trend is not statistically significant. Really, how can you identify such a trend with just two data points? Surely you jest, sir. -
muoncounter at 07:44 AM on 1 November 2011Baked Curry: The BEST Way to Hide the Incline
Dikran: First we had Pielke Sr. and now Curry making the same error. Do you suspect a trend? Here's one: Suppose one student from all four grade levels in high school walk into my classroom. The 9th grader was shorter than the 10th grader who was shorter than the 11th grader. However, the 12 grader was shorter than the 11th grader. My conclusion: teenage growth stops in 11th grade - alert the media! -
Dikran Marsupial at 07:36 AM on 1 November 2011Baked Curry: The BEST Way to Hide the Incline
Being a bit pedantic (giving Curry as much of the beneit of the doubt as possible), Muller is not absolutely correct in saying "We see no evidence of it [global warming] having slowed down". The measured trend from 2001-present is lower (0.13642 per decade) than the trend since, say 1993 (0.357871 per decade), which is evidence that the rate of warming had fallen. However it is not statistically significant evidence - it doesn't reach the minimum standard scientists generally regard as being sufficient to proceed with an hypothesis.So Muller's comment is perhaps an over-statement, but Curry's comment is silly; she needs to demonstrate that the decline really exists before she can complain that the BEST team are hiding it.
-
Bob Lacatena at 07:23 AM on 1 November 2011It hasn't warmed since 1998
124, Rickoxo, On Curry's statement vs. Muller's, this is logic 101. Curry says "A is proven to be true." (i.e. A = the globe has been cooling). Muller says "There is no evidence of A." Muller's statement is not the opposite but equal of Curry's. Curry's statement is false not because A is false, but because there is no valid evidence to support her statement A. Muller's statement is true not because A is either true or false, but rather because it is a statement about the evidence, not about proposition A itself. Do you see the difference? -
Rob Painting at 07:20 AM on 1 November 2011Richard Milne separates skepticism from denial
Shibui doesn't appear to have watched the Richard Milne lecture, otherwise he may have realized his little meme was the one I referred to @ 1 - the bull in the china shop. -
muoncounter at 07:15 AM on 1 November 2011It hasn't warmed since 1998
Rickoxo#124: "if Tamino said Curry screwed up bad for making her statement that there is no evidence global warming hasn't stopped, wouldn't the exact same argument apply to Muller's statement?" In a word, no. First off, let's lose the double negatives and translate Curry's statement: 'There is evidence that global warming stopped.' This, as shown by tamino, is clearly false. For a change in trend (warming stopped) to be considered as evidence, it must be statistically significant - or else it is just more than likely noise. Muller's statement: "We see no evidence of it [global warming] having slowed down." That's consistent with the statement made in the FAQ and the requirement that evidence be statistically significant. All else (including this spin job by some very frantic denialists) is noise. Further discussion of this Curry/Muller question should go to this new thread. -
dana1981 at 07:08 AM on 1 November 2011It hasn't warmed since 1998
Rickoxo - the short answer is that what Muller said was correct, and what Curry said isn't. See our new post on the subject. The "good reasons for doubt" comment is a different issue. Reasons for doubting what? AGW? The surface temperature record? Frankly Muller is exaggerating the importance of the BEST results regardless of what specifically he was talking about, but exaggerating the importance of BEST is nothing new for Muller. BEST shouldn't have been necessary to accept the accuracy of the surface temp record to begin with. Regardless, Curry's statements were ill-conceived and inaccurate, as the new post discusses. -
Rickoxo at 06:58 AM on 1 November 2011It hasn't warmed since 1998
Murry made this comment publically, when asked about the question of recent temperature data: ‘We see no evidence of it [global warming] having slowed down,’ he told BBC Radio 4’s Today programme. There was, he added, ‘no levelling off’. Read more: http://www.dailymail.co.uk/sciencetech/article-2055191/Scientists-said-climate-change-sceptics-proved-wrong-accused-hiding-truth-colleague.html#ixzz1cOGjgBRy Curry's argument was much like Tamino's argument against her, that the statement from Muller was a stupid statement and meaningless. He could have simply said that short term trends don't matter due to decadal fluctuations, but he didn't. It seems like she called him on a statement of his that was not careful and that she saw as misleading. Help me with this if you can Tom or Muon, if Tamino said Curry screwed up bad for making her statement that there is no evidence global warming hasn't stopped, wouldn't the exact same argument apply to Muller's statement? And since he made it first, isn't it more logical to see her statement as a correction of his? The second thing Muller said that seemed pretty crazy stupid was the comment in the WSJ article, ‘there were good reasons for doubt until now’. Read more: http://www.dailymail.co.uk/sciencetech/article-2055191/Scientists-said-climate-change-sceptics-proved-wrong-accused-hiding-truth-colleague.html#ixzz1cOIS0rEw Curry said she critiqued him in part because of this comment. The site you referenced Muon makes the following statement at the end of the FAQ: Our study addressed only one area of the concerns: was the temperature rise on land improperly affected by the four key biases (station quality, homogenization, urban heat island, and station selection)? The answer turned out to be no – but they were questions worthy of investigation. Berkeley Earth has not addressed issues of the tree ring and proxy data, climate model accuracy, or human attribution. Why would answering this one question mean that there was no longer any basis for skepticism? The insinuation that there used to be a basis for skepticism but the only possible reason was potential inaccuracy in the temperature data is pretty silly and Curry called him on it. It seems like he has backed way off his strong interpretational statements of what the data means and is going back to what Curry said earlier, let the data speak for itself and let the project be simply about trying to make the cleanest and most accurate, publically available set of temperature data available. -
muoncounter at 06:25 AM on 1 November 2011Richard Milne separates skepticism from denial
Shibui#35: "to convince the general public" Go back to the Milne video, where he cites the examples of CFC and SO2 pollution. Both controlled by worldwide efforts, despite there being no proof of 'the issue down to the last detail'. Look at the Dutch Delta Project, where a society invested enormous capital against the probability - not the certainty - of future catastrophe. No proof to the last detail there either. A sufficiently motivated population reacts on the basis of risk avoidance - unless they have been lulled to sleep by false information. Here's Milne again: Science determines facts - to the best ability of experiment and model, which are not absolute. Politicians create policy. To insist that science meet an artificially high standard of 'proof' is a guarantee that nothing will ever come of anything scientific. Is that what you're after? -
Bob Lacatena at 06:17 AM on 1 November 2011Climate's changed before
246, Tom, Sorry, I added 2 myself after I'd written the response and forgot about my own lead in statement. -
muoncounter at 06:06 AM on 1 November 2011It hasn't warmed since 1998
Rickoxo#122: "It is pretty odd, however, that Muller was wrong about his own data." Odd because that is incorrect. Read the BEST FAQ under 'has global warming stopped?' the decadal fluctuations are too large to allow us to make decisive conclusions about long term trends based on close examination of periods as short as 13 to 15 years. There is no evidence of a change in trend on that long a time scale. Muller said it correctly; it's Curry and others who are deliberately spreading disinformation. #120: "a fact confirmed by a new analysis" There is no 'new analysis'; there is just a deliberately cherrypicked graph. Based on that kind of science, consider this: It was cooler today than it was in July; is that evidence that global warming stopped?
Prev 1417 1418 1419 1420 1421 1422 1423 1424 1425 1426 1427 1428 1429 1430 1431 1432 Next


