


 Arguments


Recent Comments
Prev 1474 1475 1476 1477 1478 1479 1480 1481 1482 1483 1484 1485 1486 1487 1488 1489 Next
Comments 74051 to 74100:
-
DSL at 01:50 AM on 11 October 2011Book review: The Inquisition of Climate Science
For those who want another look into the minds of US conservatives, you might check out the NYTimes review of Corey Robin's The Reactionary Mind here. Keep in mind that the reviewer is thoroughly middle-class liberal (Barnard College political scientist). Robin's reply to the review is here. The response is, for me, more enlightening than the review, but both speak to what has been said on this stream and others at SkS. critical mass, I'm not sure what you mean by "effectively." Could you characterize the exchange for us (on the appropriate thread)? -
Jeffrey Davis at 01:48 AM on 11 October 2011Pielke Sr. and SkS Warming Estimates
I think there's a weird kind of thinking that can flow from the fractioning of various influences to global warming. Since CO2 is the main culprit, it has become a kind of stand-in for all human contributions. So, if you diminish the role of CO2 you can pretend that it really isn't that big a deal. But soot is also significant contributor and all too human in its provenance. Fix one (clear coal out of our energy production) and you can go a long way to fixing both. But our carbon-extraction overlords have pointedly gone out of their way to make sure we don't address either. Any thing and everything can be used to make delay seem a viable alternative. -
pdt at 00:55 AM on 11 October 2011Imbalance in US TV Media Coverage of Greenhouse Gas Regulation
I'm not sure if anyone reads this or even cares, but I just read the book "Earth: the Sequel" which strongly argues for Cap-and-Trade. This made me consider this more deeply and answer some of my own questions, stated above. There are some very big differences between regulations for CO/NOx/soot from vehicles and regulation of CO2 which I think make Cap-and-Trade a better solution than straight regulation. The most obvious is that fossil CO2 emissions come from a wider array of sources, some of which have a very long lifetime. For NOX/CO/soot, regulations are put in place and the vehicle fleet essentially turns over in 10 years, solving the problem. Regulations for CO2 would be much more complex to implement in order to be effective. Still, the effectiveness of Cap-and-Trade will depend greatly on the details of implementation. It also will not come without downsides, such as speculation in the carbon markets causing uncertainties in prices. We have been reminded rather brutally recently of the issues with markets. So far I haven't heard of a better solution though. -
Eric (skeptic) at 00:23 AM on 11 October 2011Pielke Sr. and SkS Disagreements and Open Questions
Tom, no argument that there is a lot of feedback from several sources needed to create a hysteresis, one of which is CO2. The other large feedback besides albedo, as suggested by Dr. Pielke, is weather. The problem comes when trying to ascertain the warming contribution of albedo feedback, CO2 feedback and weather feedback. Ice albedo being responsible for the hysteresis does not simplify the calcuation. There are, in short, two ways to do it. Extremely crude energy balances that ignore the changes in weather and produce results between 1 and 6C (Knutti 08) or models which must not only have parameterized weather but parameterized paleo weather. Neither method produces anything more than a guesstimate. -
critical mass at 00:15 AM on 11 October 2011Book review: The Inquisition of Climate Science
If anyone is searching for a 'thoughtful skeptic' there is a very interesting and civil discussion going on at Real Climate under the thread title "Global Warming and Ocean Heat Content" in which Dr Roger Pielke Snr is engaged with several participants who are questioning Gavin Schmidt rather effectively. -
DSL at 00:13 AM on 11 October 2011It's not bad
It seems bad for Tuvalu. The Economist, likening the situation to a "canary in a coal mine," reports that Tuvalu is both running out of fresh water and beginning to suffer from sea level rise. -
Harald Korneliussen at 00:09 AM on 11 October 2011Book review: The Inquisition of Climate Science
The misinformers link is a bit cluttered. I think it would be a good idea to distinguish between people with climate science credentials (e.g. Lindzen and Spencer), scientists in related fields, and out and out ideologues who rely on the former groups for ammunition (Ron Paul, Christopher Monckton, Anthony Watts etc.) Producers and consumers, so to say. Sourcewatch does a good job on these people, but hardly presents it in a way that's useful for convincing people. It would also be useful if the more honest misinformers, those who have objections to the consensus that can actually be articulated scientifically get such views presented briefly there, ideally in a way they wouldn't object to (e.g. "Pielke Sr. believes the radiative forcing from methane is far higher than is generally accepted"). -
Tom Curtis at 23:17 PM on 10 October 2011Pielke Sr. and SkS Disagreements and Open Questions
Eric (skeptic) @41, Calov and Ganopolski 2005 argues that NH summer insolation alone is not sufficient by itself to explain the transition between glaciated an non-glaciated states. Fairly obviously, nobody disagrees with that. The difference in albedo between glaciated and non-glaciated state makes an important difference. Importantly, nothing Calov and Ganopolski show suggests that anything other than this change in albedo is the cause for the hysteresis. That being the case, the hysteresis they find is not bar to determining the climate sensitivity of CO2 so long as changes in albedo are treated as a forcing, not a feedback. That is what Hansen has done, so no issue arises. -
CBDunkerson at 23:16 PM on 10 October 2011Pielke Sr. and SkS Disagreements and Open Questions
Dr. Pielke, isn't there a logical inconsistency in suggesting that 7 years is sufficient time to determine a long term trend for upper ocean heat content? How can that be true when different 7 year periods show radically different trends? If 2003-2009 is sufficient to establish a trend of only slight warming why wasn't 1997-2003 (or various other earlier periods) sufficient to establish a more pronounced warming trend? Unless you are suggesting that some major climate forcing has recently changed to a new state which will remain stable for a prolonged period the position seems inherently insupportable. There have been significant trend variations for longer than seven years in the heat content estimates before now. Logically that would seem to indicate that a longer period is needed to screen out data fluctuations and determine the long term trend. Would you be arguing that upper ocean heat content had established a clear long term trend and should serve as the primary (sole?) 'measuring stick' for climate change if we were back in 2003 with only the data available up to that point? Obviously that would have pointed to completely different conclusions than focusing on the past several years does... so either the underlying trends have suddenly changed for some reason or the position is not internally consistent. -
John Russell at 22:56 PM on 10 October 2011Understanding climate denial
Here's some interesting news relevant to this discussion of denial. I'm sure we've all come across people who, seemingly illogically, just refuse to consider negative evidence; as if they have some sort of mental block. It seems it might have a basis in brain function. -
elsa at 22:18 PM on 10 October 2011Book review: The Inquisition of Climate Science
However, Powell points out one distinction between the Roman Inquisition and the modern day Climate Inquisition. At least the Roman inquisitors had an alternative theory - Ptolemy's 2nd Century theory of Earth-centered astronomy. The Climate Inquisition have no alternative theory that can explain the many lines of evidence that point to human caused global warming. I am not sure why you say "at least". You seem to assume that it is better to have a theory, no matter how wrong, than to have no theory at all. This is a bit like arguing that doctors in the middle ages who attributed disease to bad humours should not have been criticised for their rubbish views because there was no better explanation available at the time. -
Micawber at 22:12 PM on 10 October 2011Changes in Arctic Sea Ice: Young and thin instead of old and bulky
Thanks for an excellent article reporting real in situ data on the many facets of Arctic sea ice changes. The stable surface layer is clearly shown in the UW APL Airborne Expendable CTD cast profile from Beaufort Sea in August 2011. http://psc.apl.washington.edu/northpole/AXCTD_ADA_Aug2011.pdf Differences between Atlantic and Pacific sectors are very interesting. I recall the 2007 melt season was enhanced by warm Pacific seawater intrusion through shallow Bering Strait. -
Eric (skeptic) at 21:49 PM on 10 October 2011Pielke Sr. and SkS Disagreements and Open Questions
Since it has hysteresis, the data from glacial to interglacial transition is not just uncertain, but inapplicable. See http://www.pik-potsdam.de/~calov/pre_prints/calov_and_ganopolski_2005.pdf for a description. Within a stable state such as the present interglacial, the climate sensitivity to a doubling of CO2 bears no relationship to the glacial stable state or the state transition. -
Alan E at 21:00 PM on 10 October 2011Lessons from Past Climate Predictions: IPCC AR4 (update)
In all the huffing and puffing it seems that a most important post by Bernard J @56 has passed unnoticed ... worth considering:If you want to raise an eyebrow and impute falsification, one first needs to demonstrate that certain assumed model inputs have actually behaved as was assumed at the time of modelling. As others have noted, solar output has been much lower than was expected at the time of modelling for AR4. Such a result does not falsify the models. Unless, of course, one revisits the models and repeats them with the inclusion of the real-world parameters obtained subsequent to the original runnings, and gets a result that then invalidates the predictions.
-
nealjking at 19:54 PM on 10 October 2011Pielke Sr. and SkS Warming Estimates
Tristan: Currently there is a discussion underway at: http://www.skepticalscience.com/pielke-sks-disagreements-open-questions.html Starting at about item 37. -
Glenn Tamblyn at 19:41 PM on 10 October 2011Book review: The Inquisition of Climate Science
Lloyd Flack "What you describe as values centered people refuse to see that physics puts constraints on the degree to which thay can act on their values" Lloyd, you just nailed it. A fundamental disconnect in their mode of thinking, where values actually over-rule physics because of the psychological need to live a values-centric life (which isn't an issue) and that thus the Universe must be a place that reflects those values back at them - which is poppycock. So how do we engage the values-centric in debate? Not on what their values are but on the idea that values trump physics. How do we get non-physical thinkers to recognise that physical thinking trumps everything else? -
villabolo at 19:27 PM on 10 October 2011Changes in Arctic Sea Ice: Young and thin instead of old and bulky
"The Arctic Ocean is in a Death Spiral. Personal estimate! Effectively Ice free in Summer by 2016" Don't tell Steven Goddard that. He actually said that the ice cap had quadrupled in thickness since 2008! -
Peter Hogarth at 19:23 PM on 10 October 2011Pielke Sr. and SkS Disagreements and Open Questions
pielkesr at 07:14 AM on 10 October, 2011. Agreed, climate was different during glacial periods, the question being how different was it in interglacial periods. Though there are obviously uncertainties, these do not mean we can not make increasingly robust estimates of climate sensitivity. The past continental configurations are relatively well defined, but clearly we can only infer Ocean circulation from the proxy temperature records and modelling. Models are becoming more consistent with the limited data we have, and the data itself is becoming more consistent as methodologies improve and uncertainties are reduced. Looking at recent re-evaluations of paleo proxy CO2 levels and the accumulating data sets of regional paleo temperatures, there seems to be reasonable consensus emerging amongst the paleo-climate community, driven by weight of evidence. For example see van de Wal 2011, and also Park and Royer 2011. The latter gives an estimated 95% probability that CO2 driven climate sensitivity is > 3.4 degrees C, and that glaciation, if anything, can increases climate sensitivity, with a longer tail on the upper end of probability distribution. On the other hand Hargeaves 2011 suggests constraining the upper end of overall sensitivity to less than 4 degrees C from ongoing modelling work using an ensemble of SST reconstructions, and this (and other work) hints at meridional overturning in the Atlantic being similar to today. -
Lloyd Flack at 18:29 PM on 10 October 2011Book review: The Inquisition of Climate Science
Oh, there are threats of violence from some denialists but I think they are rarer even in proportion to the population. And if they were carried out I think they would be the end of the denialist movement here. I fear they might not be in America. Americans would have a better on this than me. -
Lloyd Flack at 18:22 PM on 10 October 2011Book review: The Inquisition of Climate Science
Stevo, There is an anti-elitism streak in Australia and you can see it in the denialists here. But it does manifest itself differently. Denialists here tend to strike a larikin pose, especially the journalists. (For Yanks and Poms that roughly translates as smartarse.) They can't get away with as much in the way of moralizing because people here react with scorn to anything that looks like a claim of moral superiority. I don't think there is as much in the way of pretensions of self-reliance here. After all what is mateship but an ethos of mutual support? Granted, this a non hierarchical idea of mutual support. Denialists here try to make a joke of the whole matter. This makes them hard to pin down. But it also makes it hard for them to whip up huge levels of indignation. -
Tristan at 16:12 PM on 10 October 2011Pielke Sr. and SkS Warming Estimates
Excellent post, I sincerely hope Dr Pielke continues to discuss the points of contention with SkS. -
Stevo at 14:59 PM on 10 October 2011Book review: The Inquisition of Climate Science
Dave123 @36 Your first paragraph could apply just as accurately to Australia. The difference is in the second and third paragraphs. A British colony populated by british convicts (including many Irish catholics)and non-british (initially mainly German) settlers didn't end up showing a lot of respect of deference to political authority (or religious authority for that matter). Thus, a similar culture of self reliance to the USA but with a different origin. Add the political import of ideology, especially on the right, from the USA and you end up with considerable similarlties with regard to resistance to science. -
skywatcher at 14:30 PM on 10 October 2011Review of Rough Winds: Extreme Weather and Climate Change by James Powell
And Guirguis et al 2011 [h/t Rob P] takes a Northern Hemisphere view to put the last few winters into context, using NCEP data, finding that the warm extremes of the last few winters were more extreme and of a longer duration than the much-pulicised cold extremes, and that this is part of a multi-decadal trend. Severe Heat Indexes are generally rising, while Severe Cold Indexes are generally falling. -
skywatcher at 14:10 PM on 10 October 2011Review of Rough Winds: Extreme Weather and Climate Change by James Powell
And another paper on quantifying North American extremes - Peterson et al (2008). Norman, I think you'll find quite a lot of quantification of changes in North American extremes in there, and the relevant trends. Their well-supported conclusion:"Detailed homogeneity assessments of daily maximum and minimum weather observing station data from Canada, the United States and Mexico enabled analysis changes in North American extremes starting in 1950. The measures of extremes assessed were primarily indices developed by the joint CCl/CLIVAR/JCOMM Expert Team on Climate Change Detection and Indices. Similar decreases in cold extremes and increases in warm extremes were found when examining the 10th, 5th and 2.5th percentiles. Annual extreme cold temperatures are warming faster than annual extreme warm temperatures when the parameter measured is the actual temperature but cold and warm extremes are changing about the same when examined on a percentile or normalized basis. By any of several measures, heavy precipitation has been increasing in recent decades and the average amount of precipitation falling on days with precipitation has also been increasing. These changes in extremes are likely to impact natural ecosystems as well as agricultural and societal infrastructure."
There you go, Norman, the task of compiling the North American data has been done for North America (including Canada and Mexico). Or is this not quantitative enough? -
DSL at 14:07 PM on 10 October 2011Book review: The Inquisition of Climate Science
Dhogaza, unionism is itself a complex historical development. But unions had their teeth pulled when globalization started in earnest. Manufacturing jobs in the US have dropped to around 12% of all jobs. Service, sales, and the middle class (managerial class) make up a large majority (65-70% as I recall) of jobs in the US. Productive labor has been moved overseas or replaced with machines. There has been a recent service union movement (SEIU), and the leftovers of the big unions of the past have been increasingly returning to their radical roots. Yet these unions no longer represent a major segment of the labor market, and they no longer carry the cultural power they did in their dying days of the 1970s. The OWS movement is less indicative of a return to strong unionism and a popular front than the audible gasp of a middle class that sees the writing on the Wall. I agree with Dave123 about Protestantism being one of the historical conditions that developed the current culture. Capitalism is another, because it atomizes society, encouraging competition between individuals for basic goods and services. Capitalism also encourages commodity relations, where things in the world are thought of more in terms of their exchange value than their use value. Under such a condition, the history of objects disappears. The narratives that tie us together under a common set of values are broken apart and re-presented to us as a series of products. Capital also isolates the culturally powerful minority that is the middle class from the ultimate origin of its power in the working classes. When the middle class represents the working class in novels, TV shows, movies, news programs, and other narratives, it must do so according to the central contradiction of its class (the middle class is privileged by property owners in exchange for maintaining the conditions that reproduce the existing structure of economic power). The cultural representation of the working class, then, inevitably sympathizes with workers but refuses to empower them. When the middle class became dominant in terms of cultural representation (perhaps the late 1930s but certainly by the 1950s and the young adulthood of mass media power), the working class in the US was set for the fall. Finally, the roots of US individualism shouldn't be considered without looking deep. The US pedigree, before the massive migrations of the late 19th century, can be traced back through some of the most aggressive, on the move, shoot first cultures of the last 2000 years. American exceptionalism is the result of dozens of generations of people fighting to create conditions that would render them exceptional or at the very least completely independent/self-reliant/kings of their domains. All of this is shorthand, though. History is far more overwhelming than science. One more note on athletics. Athletic power is largely apolitical (except in the way it is produced) and simple to understand. It also fits well with the Protestant work ethic and the needs of the current economic mode. Scientific power is altogether different. Every move of science re-shapes what we know, and knowing things forces the development of responsibility. Science places a heavy burden on the traditional narratives of the world, and the burden grows rapidly. Science is not simply threatening in the way it forces metaphysical change; it's threatening in the overwhelming rapidity of the change. No wonder people cheer simple games of violence and then go physically and mentally abuse critical thinkers. That was me, too, dhogaza. I dropped out of high school to avoid it. If it weren't for Biology Honors, I suspect high school would have been a total loss. -
Albatross at 13:52 PM on 10 October 2011SkS Weekly Digest #19
Nice toon John. Thanks for this-- nice to have everything pulled together once a week. -
skywatcher at 13:32 PM on 10 October 2011The Deep Ocean Warms When Global Surface Temperatures Stall
A more general point to consider is that there are open question in relation to the science of climate change. This is one of them. Some have gone for one mechanism, others for an alternative mechanism. Either may be entirely right or wrong, perhaps more plausible in this case is that both mechanisms are operating, but we shall see. Some climate skeptics like to think that climate scientists consider the science a closed shop where there is but one single view and no discussion allowed. That leads to some of the more egregious accusations levelled. Of course this is not the case, and here we have a prime example of active disagreement on part of the science. It does not, of course, change the need for action, as whichever hypothesis is right has bad news following right along behind it. That Trenberth and Hansen have different views on one aspect of all this does not cause any significant issues, and is quite natural in science. -
skywatcher at 13:20 PM on 10 October 2011CERN - Saying Nothing About Cosmic Ray Effects on Climate
tblakeslee, to add to the collection of mistakes, perhaps you'd like to note that the Intergovernmental Panel on Climate Change was formed in 1988. Perhaps you could tell us all why that highlights one particular fallacious claim of yours? -
snapple at 11:40 AM on 10 October 2011Book review: The Inquisition of Climate Science
Galileo's opponents included astronomers, too. His Dialogue on the Two World Systems included a character named Simplico who was a composite of two of his detractors. Some people told the Pope that he was the target of Galileo's ridicule. In those days, Galileo's theory was difficult to prove. He famously said: The Bible teaches man how to go to Heaven, not how the heavens go. I think what happened to Galileo was very sad but also very complicated. Recently the Pope had a two-way dialogue with the astronauts. The whole idea of the need for dialogue with scientists was stressed. If you know the Vatican, they were alluding to Galileo's dialogue. The Jesuit who runs the Vatican's observatory is a very interesting guy. On May 14, 2008, Jesuit Father Jose Gabriel Funes, director of the Vatican Observatory and a member of the Vatican’s Pontifical Academy of Sciences gave a really remarkable interview to the Vatican newspaper L’Osservatore Romano (LOR). You might want to translate it with Google. Funes said: “I believe that the [Vatican] Observatory has this mission: to be on the frontier between the world of science and the world of faith, to give testimony that it is possible to believe in God and be good scientists.” “[I]t is necessary [for the Church to dialogue with men of science.] Faith and science are not irreconcilable…Pope John Paul II and Benedict XVI [have said]: faith and reason are the two wings which elevate the human spirit. There is no contradiction between what we know through faith and what we learn through science. There may be tensions or conflicts, but we should not be afraid. The Church must not fear science and its discoveries. As was the case with Galileo.” http://www.vatican.va/news_services/or/or_quo/interviste/2008/112q08a1.html The Church is telling people to listen to the scientists. That's the point of the conversation with the astronauts. -
dhogaza at 10:13 AM on 10 October 2011Book review: The Inquisition of Climate Science
Dave123 makes some excellent comments, Riccardo. "Smart kids are teased and bullied in schools while athletes are admired." Bullied endlessly, that was me. It's a good thing my family didn't own guns and that I largely bought into pacifism early in life. Dave123, good stuff regarding the influence of protestantism, and the rest. I'd add that the US has historically been anti-elitist ... the rise of the common man, the American Dream, etc. What's weird to me is the willingness of the working class in this country to cede wealth to the wealthy, in essence giving up much of what was won in the 1920s, 1930s, through world war II by the union movement. -
dhogaza at 10:07 AM on 10 October 2011Book review: The Inquisition of Climate Science
Riccardo: "I may easily accept that my superficial thoughts are wrong. It's a complex sociological issue that I do not easily grasp and I thank you for sharing your thoughts. I'll sure think more about it." It's complex, that's for sure. Have you heard of "American Exceptionalism"? This notion, particularly strong among US conservatives but really a part of the culture we grow up in, is another part of the puzzle (wikipedia has a piece on it). Again, people in my social circle, who have for the most part traveled extensively and in many cases have worked in countries other than the US, tend not to buy it. But it's a kind of default belief a great many Americans are raised with (hey, if we're not exceptional, then we can't be the world's policeman, eh? :) ) and carry to the grave. -
Dave123 at 08:33 AM on 10 October 2011Book review: The Inquisition of Climate Science
Because in the US we believe deeply that one person's opinion is as good as another's. And it's all opinion you know. The resentment of there being people who actually know more or are smarter runs deep and kicks up a contrarian stubborness. Smart kids are teased and bullied in schools while athletes are admired. It makes a great racket...if you can hide your smarts under a folksy "great guy to drink beer with" attitude, you can swindle people out of their skins. We have a cultural blindspot about interdepence and celebrate the illusion of the lone pioneer, the nuclear family. I think a lot of it goes back to the Protestant notion of everyone being able to read the Bible for themselves...which turned into "you can read each verse for it's own message without reference to the rest of the chapter, historical context", which is the antithesis of scholarship. These were not the views of the founding fathers, but rather the self-justifications of the South that lost the Civil War, and has been fighting back with this kind of ideology ever since. that's my rough edged take on it -
Glenn Tamblyn at 08:31 AM on 10 October 2011Changes in Arctic Sea Ice: Young and thin instead of old and bulky
The comments about light penetration through the ice is an interesting extra 'wrinkle' in the Arctic story. It is easy to fall into the trap of thinking that it is about air temp's, or sea water temps. But this is an interesting synergy type interaction. And the extent of lots of thin ice isn't good. Melting shrinks it each year then it recovers in winter. But the more thin ice you have, the more of the ice is structurally weak - vulnerable to wind, waves, currents etc. Ice doesn't just 'melt' - that is only part of the story. Structural weakness leads to more open water, more ice able to move to lower latitudes etc. Using Ice Extent seriously underestimates the pressures on the ice. Ice Mass & Thickness is a far more important metric. The Arctic Ocean is in a Death Spiral. Personal estimate! Effectively Ice free in Summer by 2016 -
Philippe Chantreau at 08:09 AM on 10 October 2011CERN - Saying Nothing About Cosmic Ray Effects on Climate
Tblakeslee, please provide clear concrete examples of real ad hominem arguments. If you can't, you should withdraw that accusation. R Pielke Sr. recently proved to be incapable of supporting the same argument and resorted to talking about other things. Not that talking about other things was a bad idea, but then he shouldn't have launched the accusation in the first place. Not to be off topic [DB] but Tblakeslee brought up contrails as an element that, as suggestedt, was related to GCRs. No substantiation. Is there any scientific information that would establish such a link? You provided a page talking about soot. The relatively abundant soot in aircraft exhaust makes any possible influence of GCRs deeply irrelevant. However, I stand by my assertion that the increased water vapor pressure is the most important factor in their formation. Proof of that is that they quickly dissipate or fail to form in dry air, despite the same concentration of soot particles. I am yet to see any study even atempting to link contrails and GCRs. Do you know of any? http://ww2010.atmos.uiuc.edu/(Gh)/guides/mtr/cld/cldtyp/oth/cntrl.rxml I note that you did a very selective quoting of the AGU abstract, here is more: Soot controls ice formation in contrails for high number emission indices including the range of current global fleet values. A fivefold reduction of soot emissions from average levels of 5 × 10¹⁴ − 1015 (kg-fuel)−1 approximately halves the initial contrail visible optical depth. Further soot reduction reverses this trend at temperatures well below the formation threshold temperature unless emissions of sulfur and organics are cut substantially. " Also, I noted that you said that Global Warming was Arctic warming, yet in your map in post 134, the entire globe is showing positive anomalies, except for a few patches in the Southern hemisphere. I don't see that as being limited to the Arctic, even if the Arctic is seeing more warming. -
Rob Painting at 07:54 AM on 10 October 2011The Deep Ocean Warms When Global Surface Temperatures Stall
David Lewis - I'm another SkS author who has the utmost respect for Dr Hansen and the work he has done to further scientific and public understanding of the climate, but that doesn't make him automatically right about all things climate. And just for your info, both Trenberth and Fasullo are co-authors of Meehl (2011) - hence the similarity. Who's right? Well, we'll have to wait and see, but there are a number of papers awaiting publication that look at this issue. -
Riccardo at 07:24 AM on 10 October 2011Book review: The Inquisition of Climate Science
dhogaza I may easily accept that my superficial thoughts are wrong. It's a complex sociological issue that I do not easily grasp and I thank you for sharing your thoughts. I'll sure think more about it. Assuming you're right, we're left with nothing in our hands. If it's true that denialism grows thanks to the contrast between values and reality, we still have to find which values are at stake. The succesfull anti-science campaigns in the US must have touched a nerve of the americans. Similar campaigns in Europe are unthinkable, they would be laughable. Here you more likely see greenwashing campaign to fool consumers, steer politics to more profitable "green" or "health" choices, etc., because no one would accept that, say, CO2 or some other pollutant or tobacco smoke is not an issue. In a few words, if anti-science PR campaigns are successful in USA but not in Europe it's because (significant part of) the public is ready to accept them. Where's the difference between us? What different values brought us so far apart? -
pielkesr at 07:14 AM on 10 October 2011Pielke Sr. and SkS Disagreements and Open Questions
dana1981- In response to #38, the geography at the time, due to vast areas of continental glaciation with substantial altitude, and of larger areas of sea ice, resulted in the polar jet (apparently) being depressed equatorward. This would make for a quite different climate regime that we currently have. I also question that robustness of calculating the land part of a global average surface temperature anomaly when the elevations in these large continental ice sheet regions was so different than today. -
scaddenp at 06:51 AM on 10 October 2011It's methane
1/ I have heard this too. Kangaroos (and rabbits) are not ruminants so methane/kg-human-product is less than sheep/cattle. Kangaroos requires less processing than rabbit but are challenging to farm to say the least. -
David Lewis at 06:19 AM on 10 October 2011The Deep Ocean Warms When Global Surface Temperatures Stall
Maybe after a while people might understand if I ask a question I'm not playing some game. I have been involved in debate as a climate activist and would be politician since 1988. I staked the success of my political career on whether voters would vote for stabilizing the composition of the atmosphere, starting in 1988 in Canada. Obviously, I was unsuccessful. I thought everyone in this civilization should be alarmed at what climate scientists were discovering, as of back then. I posted my question about whether Schmidt thinks Hansen is contradicting NCAR to Gavin Schmidt at RealClimate. I was unable to understand his brief response to a question I thought was similar to one I might ask. I don't understand the difference between Meehl and Trenberth - the Meehl paper abstract indicates they think the Earth's energy imbalance is around 1 W/m2 and they are looking for ways to explain why what they call the "observed globally averaged surface-temperature time series", "shows little increase or even a slightly negative trend". This appears identical to Trenberth's thought, i.e. where is the missing energy. So when Hansen says he thinks the Earth's energy imbalance if the solar cycle is removed is 0.75 W/m2, and he puts a paragraph into his paper saying "there is no missing energy", it seems to me he's staking out a somewhat contradictory position to Meehl. The NCAR group is looking for ways to explain where all this 1 W/m2 is and they are using models to do it. Hansen is saying there is only 0.75 W/m2 to explain, and models aren't going to be able to explain where even 0.75 W/m2 is as all current models happen to assume things that are incorrect about ocean heat storage and aerosols. I don't say Hansen is right. I happen to be studying his ideas right now and wondered why in a discussion of the NCAR work Hansen's name didn't come up. So I brought it up. I tend to think we're all just on the bridge of the Titanic after it has hit the iceberg exchanging views, although I believe there is a lot that could be done if civilization woke up to the situation. I study current climate science with a view to increasing my understanding so that as I discuss the topic anywhere I can be more clear. I'm sorry if I antagonize people with my questions.Response:[DB] "I don't understand the difference between Meehl and Trenberth"
Remember, Trenberth is also an author of Meehl (2011). Trenberth's famous "missing energy" statement is worded as follows:
"The fact is that we can't account for the lack of warming at the moment and it is a travesty that we can't."
In regards to this statement, Dr. Trenberth is on record asstating:
Thus Dr. Trenberth laments the lack of measurement tools to close the accounting gap - nothing more. How do I know this? From the link...and he told me as such (personal correspondence).
My takeaway from Meehl (2011) is that the team that Dr. Trenberth was a part of has identified a mechanism through which deep ocean energy sequestration occurs on decadal timescales. And by adding that into the accounting mix we can better close the budgetary gap in the planetary energy flows (as measured and modeled).
That being said, the new mechanisms identified by Meehl (2011) do not preclude Dr. Hansen's new aerosol forcings from also playing a significant role in also closing the planetary energy budget. Time will tell as to how big a player each is in this drama unfolding as we watch.
This is how science works. The difference is that formerly this all happened in meeting rooms and was hashed out over months and years of research, but now (in the information age) we see this played out in real-time.
Have patience.
-
Eric (skeptic) at 05:17 AM on 10 October 2011CERN - Saying Nothing About Cosmic Ray Effects on Climate
Thomas R Blakeslee, I looked through your website (link above) and saw that you are very talented and successful. Despite your proven track record in many areas, it is quite possible (and seems likely) that you have made some mistakes or received incorrect information regarding the effect of solar magnetic modulation of cosmic rays and thus clouds. Like other solar effects on weather, the cloud modulation is complex and multifaceted causing both cooling and warming depending on factors like cloud altitude, diurnal cycle, latitude, etc. It seems to me (and hopefully to the rest of the SkS regulars) that the ideas of the Clearlight foundation (linked above) are very useful to the cause of fossil energy mitigation. It would be a shame to lose that focus in arguments over various details of the cosmic ray effects. -
dana1981 at 05:00 AM on 10 October 2011Pielke Sr. and SkS Disagreements and Open Questions
Dr. Pielke - thank you for answering our questions. Our responses follow, here is the first point: 1) We will have to disagree on this subject. Dr. Hansen has looked at the most recent glacial cycles when the land configuration and oceans currents were very similar to those of today, and was able to estimate an equilibrium climate sensitivity of approximately 3°C for doubled CO2. We have yet to see an explanation for the large discrepancy from those arguing for low climate sensitivity (primarily Spencer, Christy, and Lindzen), and believe it represents a glaring flaw in their hypotheses. Ironically, while Christy and Lindzen have touted their low climate sensitivity estimates as being data- rather than model-based, they are ignoring the paleoclimate data which contradicts their conclusions, and dismissing a whole scientific discipline and volume of data that has been essential in understanding our climate system. -
Tom Curtis at 04:59 AM on 10 October 2011The Deep Ocean Warms When Global Surface Temperatures Stall
David Lewis @46: 1) Gavin Schmidt claimed that there was no contradiction between Meehl et al, 2011 and Hansen. He did not claim that there was no contradiction between Hansen and Trenberth. Essentially the difference is this: Meehl et al find a mechanism that can result in more rapid removal of heat to the deep ocean under some circumstances. Nothing Hansen says implies that such a mechanism cannot exist. However, Hansen does claim that even should such a mechanism exist, it is not responsible for the reduced growth of upper level OHC over the last few years. Trenberth, on the other hand, is committed to such a mechanism being responsible for that hiatus. 2) I suspect that most members of the skeptical science team, like myself, do not consider Hansen a guru whose every pronouncement must be believed. He, like Trenberth, is a working scientist of considerable accomplishment. Therefore, when he makes a scientific argument, it pays to listen. But he, like any other scientist, can be wrong and it is the evidence that decides whether he is or not. Consequently when, as in this case, he and Trenberth disagree we pay attention to both positions and the evidence in the expectation that that evidence will soon sort out who is wrong and who is right. As it happens I tend to think Trenberth is more likely to be right than Hansen on this issue. I think this primarily because models tend to over estimate the temperature effect of volcanoes, whereas if they had been overestimating heat transfer to the ocean (and hence thermal lag), they would be more likely to underestimate it. However, that is only a small piece of evidence in a complicated issue, so like everybody else, I'm going to have to wait and see. What I am not going to do is assume that, if Hansen is wrong, that makes all his other opinions wrong as well. Those other opinions where accepted based on evidence, and it is that evidence which supports them, not some false supposition of infallibility. -
Albatross at 04:54 AM on 10 October 2011The Deep Ocean Warms When Global Surface Temperatures Stall
David @46, "Or, is Gavin Schmidt correct that Hansen is not contradicting NCAR? Or, is it the case that Hansen is losing scientific credibility in the minds of the writers here at Skeptical Science?" Please, enough with the "gotchas" and strawmen and "wedge" politics already. Hansen is not losing scientific credibility here at SkS or anywhere else just because he has a different hypothesis than does Trenberth. The slowdown between 2003 and 2010 depends on the depth used in the OHC data and which data analysis one uses-- for example, the Palmer et al. analysis shows an accumulation of heat consistent with the trend for 1993-2008. But that rate is not supported by the isostatic contribution to sea level, so it appears that there has been a temporary slowdown. Hansen et al. (2011) find an energy imbalance of ~0.6 W m-2 for 2005-2010, compared to ~0.8 Wm-2 for 1993-2008. Regardless, the slowdown in the accumulation of heat in the 0-700 m layer is in all likelihood a combination of three factors: 1) Interdecadal variability in ocean heat content, 2) Increased aerosol loading, and 3) Prolonged solar minimum. I would not be optimistic as to what changes in such a short time window mean in terms of climate sensitivity or model skill if I were you. -
dhogaza at 04:48 AM on 10 October 2011Book review: The Inquisition of Climate Science
Riccardo: "There's one thing i don't understand. The direction the world is taking is pretty clear today and your best interest should be to get involved, help determine the best way to go and lead. But for some reason the door is still closed." I think our physical isolation from asia and europe plays a large role. We have an emerging economy to the south, and an english speaking nation to the north that's not nearly as different from the US as they'd like to believe. Where I live, in Portland Oregon, most of the people I know have traveled quite extensively (as have I) and have a much more global outlook than the average american. But the vast majority of americans haven't had that experience and tend to be very provincial. Heck, many people from the mid west have never visited the coasts (except perhaps to go to disneyland or yosemite or ...) and vice-versa. Also isolationism has a long history here, in part due to the fact that back in the days when we welcomed immigrants, large numbers of people came here and explicitly turned their backs on Europe (such as my German great grandparents who arrived here in the very late 1800s). Think about it ... our involvement in world affairs has grown through our participation in a couple of world wars, and the resulting notion of being the world's policeman. That's a pretty narrow vision of how to participate in the global community ... -
dhogaza at 04:39 AM on 10 October 2011Book review: The Inquisition of Climate Science
Riccardo ... "you're right but that's one side of the coin, you americans tend to unite and show a very strong will when you feel threatened. Environmental protection fits because it's a kind of threat to your country, not because it's a value by itself..." No, that's not at all true. The Wilderness Act of 1964, for instance, explicitly states that the reason for the existence of the Act is that Wilderness has intrinsic value of its own. The Endangered Species Act was similarly value-based ... the National Forest Management Act expresses similar values in requiring that the range of native species on National Forest lands be preserved despite the fact that it was known at the time that this would prevent the Forest Service from converting all of our national forests into heavily managed tree farms (a stated goal of the service). -
Riccardo at 04:17 AM on 10 October 2011It's methane
abhi541 1) i didn't know about kangaroo meat. A quick search led me here. Apparently there's some merit in eating this meat. 2) Methane is some 25 times more potent on a molecule by molecule basis, though the effect, i.e. the forcing, is not proportional to concentration. 3) sulphate aerosols have a cooling effect. In a geo-engeneering framework, you want them in the stratosphere. Sorry for the short and schematic answer. Follow DSLs suggestion, maybe someone else will give you more details, assuming you want more :) -
DSL at 03:58 AM on 10 October 2011It's methane
Hi, abhi541. 1. I have no idea, but someone here might. 2. See this thread and the comment stream that follows it. 3. See this thread. Post further questions on the relevant threads. -
David Lewis at 03:56 AM on 10 October 2011The Deep Ocean Warms When Global Surface Temperatures Stall
I would hope that everyone understands that scientists often find they disagree on how to interpret data and that their disagreements are often resolved over time. I described what I understood of Hansen's ideas in order to ask if it appears to others that Hansen's idea that most models respond to forcing too slowly because they send too much heat into the deep ocean contradicts this NCAR research. Gavin Schmidt at RealClimate (in his reply to comment #3 under his post Global Warming and Ocean Heat Content) appears to have answered a question similar to mine by saying there is no contradiction. Here is the question posed at RealClimate: "[regarding “Earth’s Energy Imbalance and Implications”] In that paper, especially in sections 6 & 7, it appears – to me anyway – that James Hansen and his colleagues have given up on the search for the so-called “missing heat” in the deep ocean and have instead concluded it must have been radiated away as a result of the negative anthropogenic aerosol forcing. I take this as suggesting that Hansen has parted company with Kevin Trenberth and others and has conceded that the IPCC models are flawed – flawed in their “climate response functions”. Do you know if the model used by Meehl suffers the same problem with the “climate response function” that Hansen discusses? Do you have any other comments on the Hansen et al. paper?" [Response by Gavin Schmidt]: I don't see any contradiction. Meehl et al are looking at a generic behaviour which will exist in all models, while Hansen is thinking about the specific forcings and response for the last decade. Different issues. - gavin Yet in Earth's Energy Imbalance and Implications Hansen republished Trenberth's "Global Net Energy Budget" diagram from Trenberth's "Perspectives" piece, which was originally published in Science, i.e. this one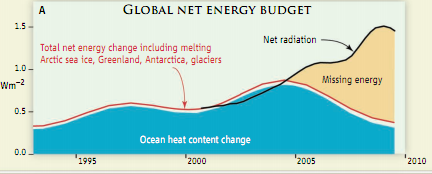 And Hansen says this about it: "the slowdown of ocean heat uptake, together with satellite radiation budget observations, led to a perception that Earth's energy budget is not closed (Trenberth 2009, Trenberth and Fasullo 2010), as summarized in Fig. 19A. However, our calculated energy imbalance is consistent with observations (Fig 19b), implying there is no missing energy in recent years."
Which sounds like he is making sure everyone knows he is contradicting Trenberth and the NCAR research as described in this "The Deep Ocean Warms when Global Surface Temperatures Stall" Skeptical Science post.
When describing the NCAR work it seems there must at least be a mention that a scientific group with the stature of Jim Hansen's appears to completely disagree.
Or, is Gavin Schmidt correct that Hansen is not contradicting NCAR?
Or, is it the case that Hansen is losing scientific credibility in the minds of the writers here at Skeptical Science?
And Hansen says this about it: "the slowdown of ocean heat uptake, together with satellite radiation budget observations, led to a perception that Earth's energy budget is not closed (Trenberth 2009, Trenberth and Fasullo 2010), as summarized in Fig. 19A. However, our calculated energy imbalance is consistent with observations (Fig 19b), implying there is no missing energy in recent years."
Which sounds like he is making sure everyone knows he is contradicting Trenberth and the NCAR research as described in this "The Deep Ocean Warms when Global Surface Temperatures Stall" Skeptical Science post.
When describing the NCAR work it seems there must at least be a mention that a scientific group with the stature of Jim Hansen's appears to completely disagree.
Or, is Gavin Schmidt correct that Hansen is not contradicting NCAR?
Or, is it the case that Hansen is losing scientific credibility in the minds of the writers here at Skeptical Science?
-
abhi541 at 03:45 AM on 10 October 2011It's methane
1. Authors of super-freakonomics have said that eating kangaroo meat as opposed to a ham-burger is good for climate as methane is a greater threat! Is that scientifically correct? 2. Same book mentions that methane is 25 times more potent than CO2 as greenhouse gas. If CO2 level is 200 times CH4 how does it contribute 28% warming than CO2? (I am assuming law of proportions to hold. Correct if wrong) 3. Will emitting sulpher in atmosphere help cooling the planet? After what altitude exactly does sulpher cease being trouble (acid rain etc..) Thanks! -
John Hartz at 03:32 AM on 10 October 2011Book review: The Inquisition of Climate Science
The American public in general, and conservatives in particular, are constantly bombarded by a stream of propaganda about both the validity of the science of climate change and the integrity of climate scientists A case in point is “The phony ‘consensus’ on climate change”, an editorial by the Daily Herald of Utah Valley posted on Oct 9, 2011. This editorial is a veritable Gish Gallop of climate denial memes. Because similar statements have recently been popping up all over the place on conservative media outlets, it is safe to conclude that one of the conservative think tanks generated and distributed a shell statement far and wide. As my fellow SkS author, Neal J King is wont to say, “We’re in a propaganda war!”
Prev 1474 1475 1476 1477 1478 1479 1480 1481 1482 1483 1484 1485 1486 1487 1488 1489 Next


